. 2022 Jul 19:11:e76854.
doi: 10.7554/eLife.76854.

Reconstruction of transmission chains of SARS-CoV-2 amidst multiple outbreaks in a geriatric acute-care hospital: a combined retrospective epidemiological and genomic study

Affiliations

Reconstruction of transmission chains of SARS-CoV-2 amidst multiple outbreaks in a geriatric acute-care hospital: a combined retrospective epidemiological and genomic study

Mohamed Abbas et al. Elife. .

Abstract

Background: There is ongoing uncertainty regarding transmission chains and the respective roles of healthcare workers (HCWs) and elderly patients in nosocomial outbreaks of severe acute respiratory syndrome coronavirus 2 (SARS-CoV-2) in geriatric settings.

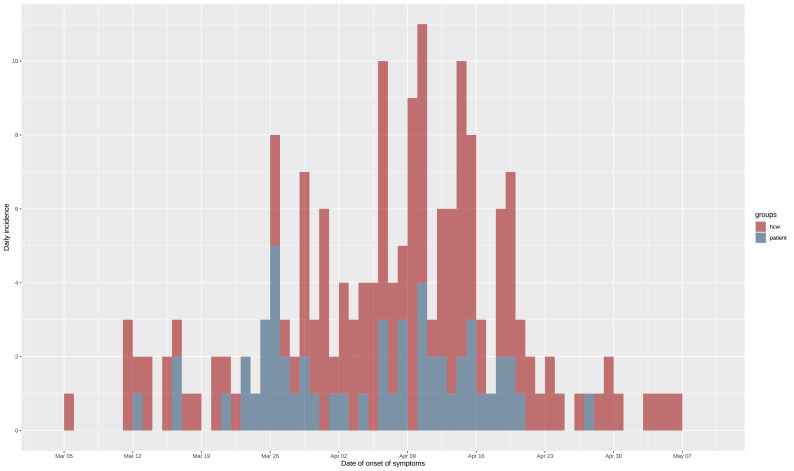
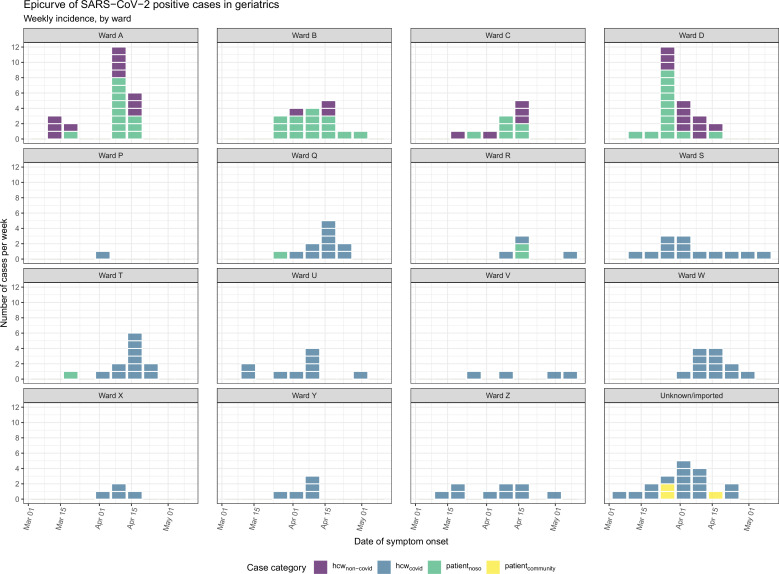
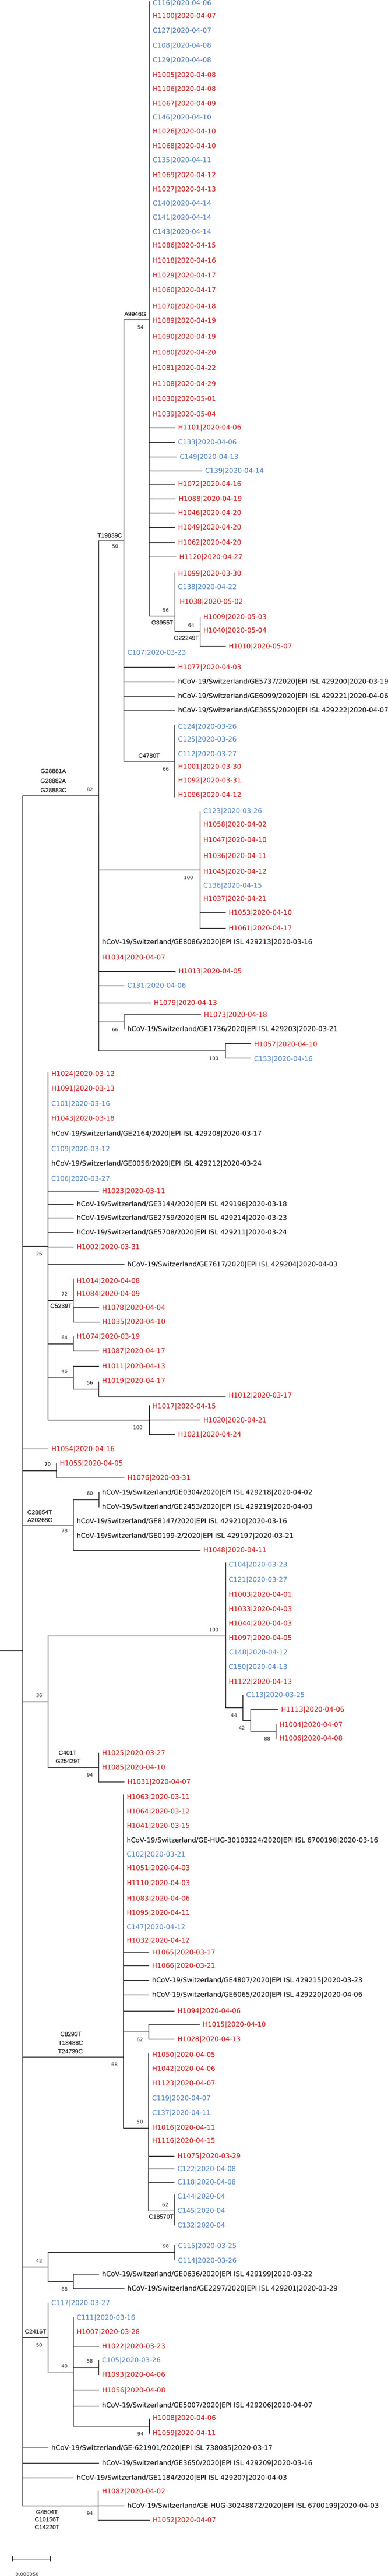
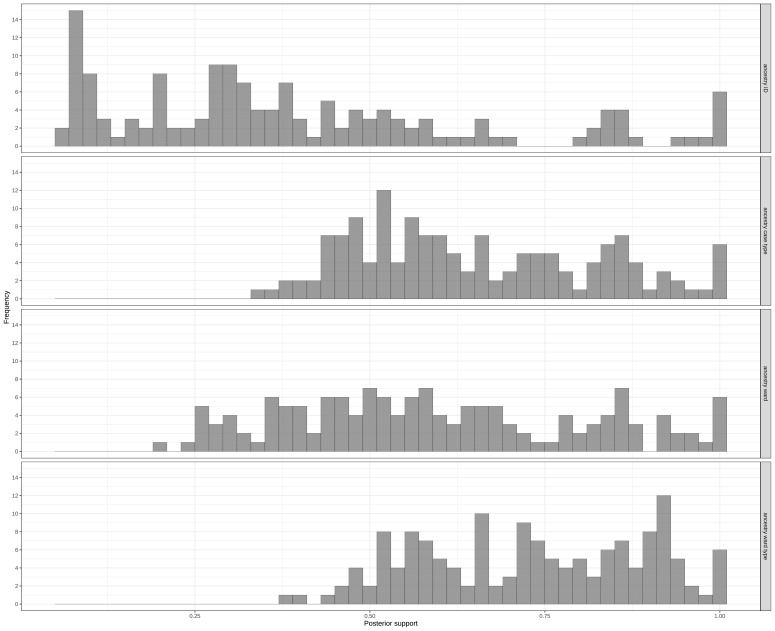
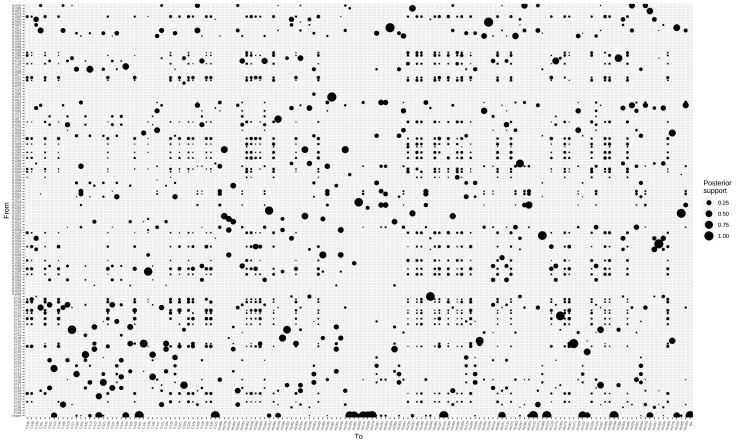
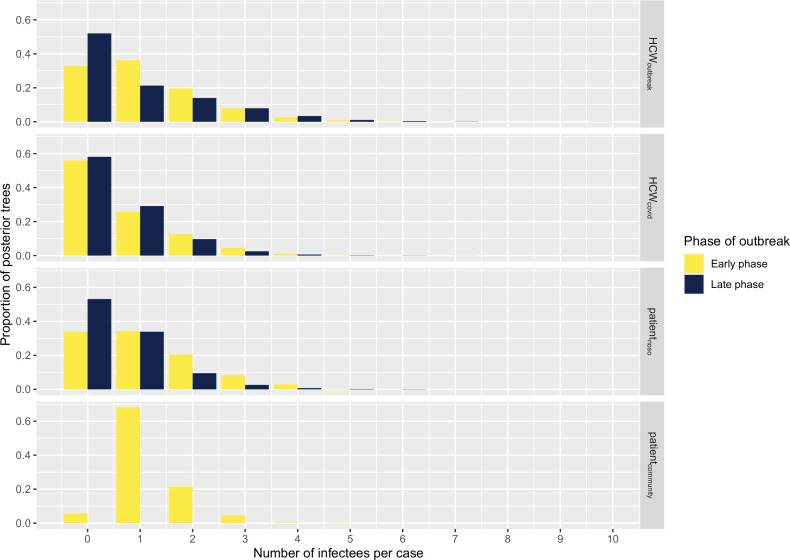
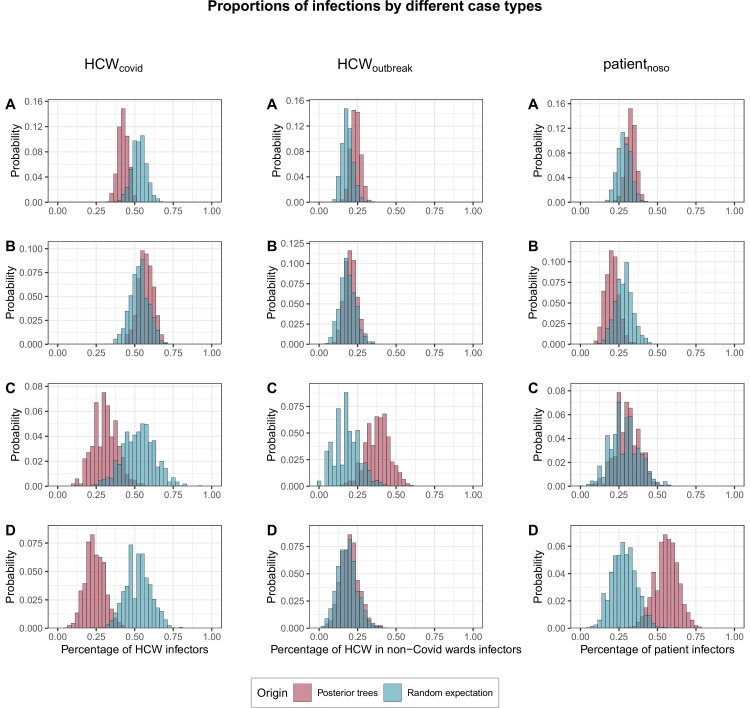
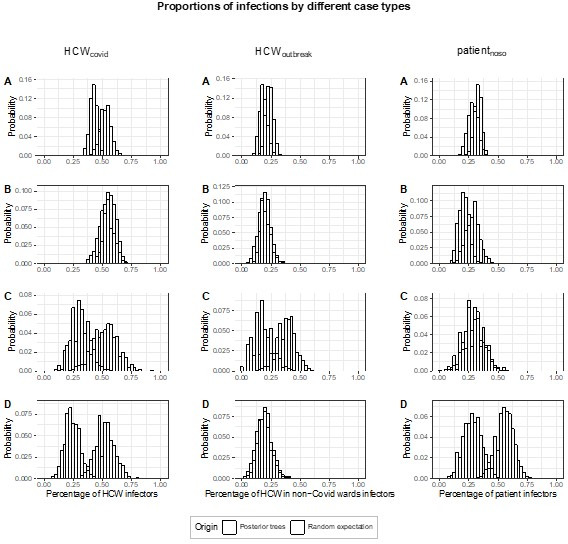
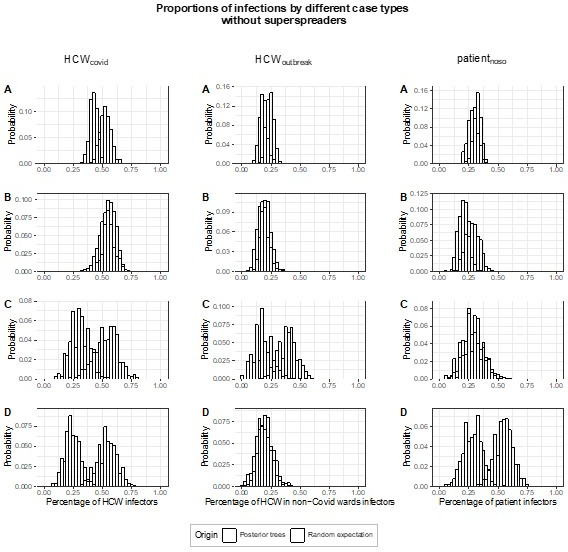
Methods: We performed a retrospective cohort study including patients with nosocomial coronavirus disease 2019 (COVID-19) in four outbreak-affected wards, and all SARS-CoV-2 RT-PCR positive HCWs from a Swiss university-affiliated geriatric acute-care hospital that admitted both Covid-19 and non-Covid-19 patients during the first pandemic wave in Spring 2020. We combined epidemiological and genetic sequencing data using a Bayesian modelling framework, and reconstructed transmission dynamics of SARS-CoV-2 involving patients and HCWs, to determine who infected whom. We evaluated general transmission patterns according to case type (HCWs working in dedicated Covid-19 cohorting wards: HCWcovid; HCWs working in non-Covid-19 wards where outbreaks occurred: HCWoutbreak; patients with nosocomial Covid-19: patientnoso) by deriving the proportion of infections attributed to each case type across all posterior trees and comparing them to random expectations.

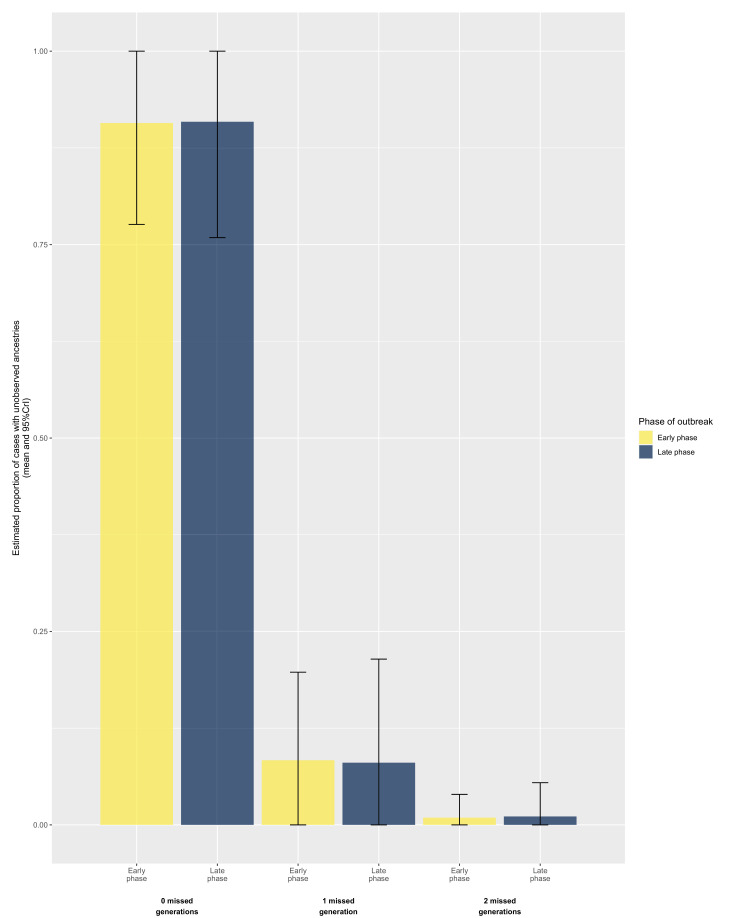
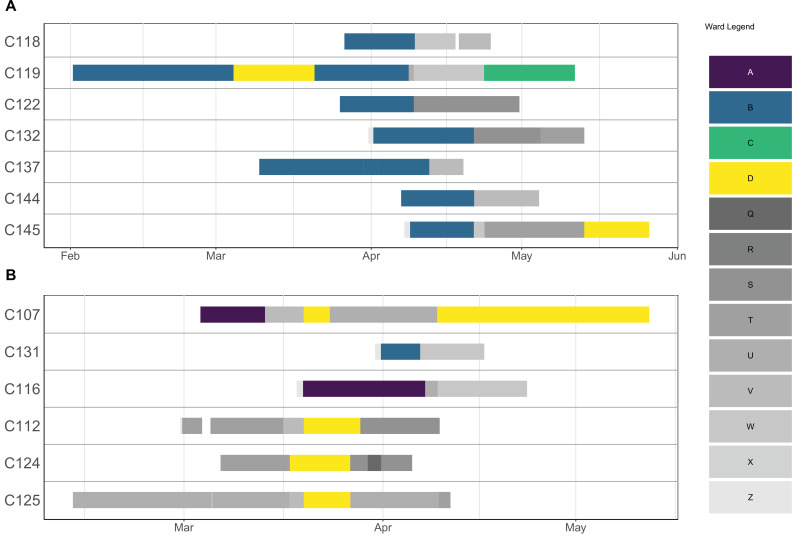
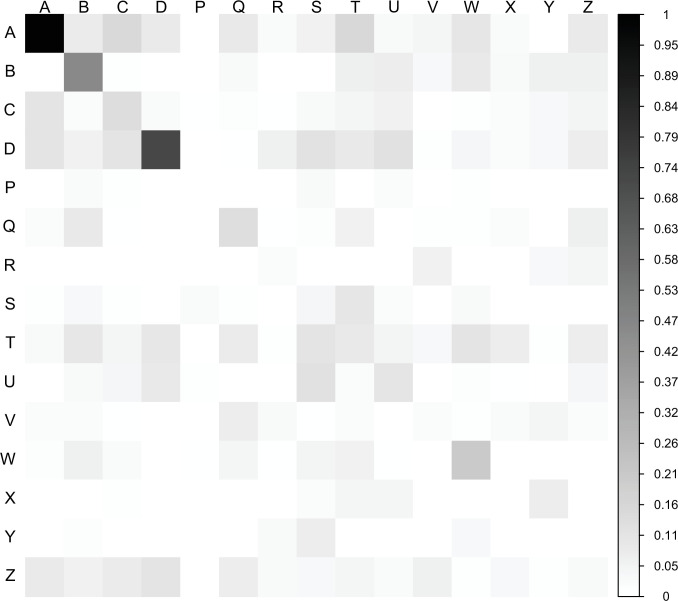
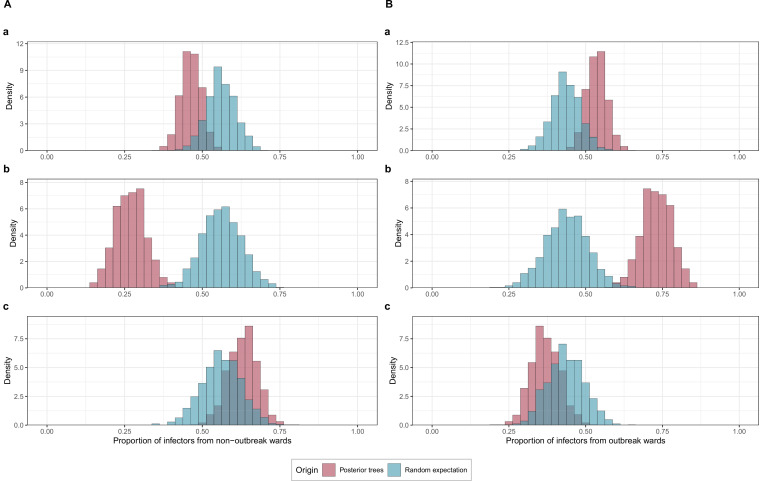
Results: During the study period (1 March to 7 May 2020), we included 180 SARS-CoV-2 positive cases: 127 HCWs (91 HCWcovid, 36 HCWoutbreak) and 53 patients. The attack rates ranged from 10% to 19% for patients, and 21% for HCWs. We estimated that 16 importation events occurred with high confidence (4 patients, 12 HCWs) that jointly led to up to 41 secondary cases; in six additional cases (5 HCWs, 1 patient), importation was possible with a posterior probability between 10% and 50%. Most patient-to-patient transmission events involved patients having shared a ward (95.2%, 95% credible interval [CrI] 84.2%-100%), in contrast to those having shared a room (19.7%, 95% CrI 6.7%-33.3%). Transmission events tended to cluster by case type: patientnoso were almost twice as likely to be infected by other patientnoso than expected (observed:expected ratio 2.16, 95% CrI 1.17-4.20, p=0.006); similarly, HCWoutbreak were more than twice as likely to be infected by other HCWoutbreak than expected (2.72, 95% CrI 0.87-9.00, p=0.06). The proportion of infectors being HCWcovid was as expected as random. We found a trend towards a greater proportion of high transmitters (≥2 secondary cases) among HCWoutbreak than patientnoso in the late phases (28.6% vs. 11.8%) of the outbreak, although this was not statistically significant.

Conclusions: Most importation events were linked to HCW. Unexpectedly, transmission between HCWcovid was more limited than transmission between patients and HCWoutbreak. This finding highlights gaps in infection control and suggests the possible areas of improvements to limit the extent of nosocomial transmission.

Funding: This study was supported by a grant from the Swiss National Science Foundation under the NRP78 funding scheme (Grant no. 4078P0_198363).

Keywords: COVID-19; SARS-CoV-2; geriatric hospitals; healthcare-associated infection; infection prevention; infectious disease; medicine; microbiology; nosocomial outbreaks; transmission dynamics; viruses.


Conflict of interest statement

MA, SC, FL, TR, AM, JS, PH, DZ, VP, AI, LV, VS, CG, SH No competing interests declared, AC received honoraria (which was paid to the institution) from Pfizer for lecturing on a course on mathematical modelling of infectious disease transmission and vaccination book. The author has no other competing interests to declare

Figures

Figure 1.
Figure 1.. Epidemic curve of the nosocomial COVID-19 outbreak in a geriatric hospital involving HCWs and patients.
Includes eight asymptomatic cases for whom date of onset was inferred (c.f., text). HCW, healthcare worker.
Figure 1—figure supplement 1.
Figure 1—figure supplement 1.. Ward-level epidemic curve.
Figure 2.
Figure 2.. Phylogenetic tree of SARS-CoV-2 genome sequences.
The tree includes 148 sequences related to the outbreak (patient and employee sequences are named C1xx [blue] and H10xx [red], respectively), alongside the community cases in the canton of Geneva, Switzerland, that were sequenced in March–April 2020 by the Laboratory of Virology (Geneva University Hospitals) and submitted to GISAID (virus names and accession ID [i.e., EPI_ISL_] are indicated) in the context of an epidemiological surveillance. For each sequence the date of the sample collection is mentioned (yyyy-mm-dd).
Figure 3.
Figure 3.. Distribution of posterior support of maximum posterior ancestry for all cases, according to identity of (A) individual ancestor, (B) ancestor’s case type (i.e. , ‘HCWcovid’, ‘HCWoutbreak’, ‘patientnoso’, and ‘patientcommunity’), (C) ancestor’s ward, and (D) ancestor’s ward type (i.e., ‘outbreak ward’, ‘non-outbreak ward’).
Figure 3—figure supplement 1.
Figure 3—figure supplement 1.. Ancestry reconstruction (who infected whom) of the outbreaker2 model.
Infectors are on the vertical axis and infectees are on the horizontal axis. Each bubble represents the posterior probability of each infector-infectee transmission pair. The bottom row denotes the probability that an infectee was in fact an imported case. Patients and employees are named C1xx and H10xx, respectively.
Figure 3—figure supplement 2.
Figure 3—figure supplement 2.. Distribution of number of missed generations across posterior trees, stratified by phase of outbreak.
Figure 3—figure supplement 3.
Figure 3—figure supplement 3.. Comparison of the accuracy of ancestry attribution of each sensitivity analysis.
Each case is on the horizontal axis. The shading corresponds to a value indicating the magnitude of the difference in attribution of the case’s ancestor and the main analysis. For each infectee (case), we calculated the absolute difference in probabilities of infectors (ancestor) between the main analysis and each sensitivity analysis. Values of difference 1 indicate 100% difference in ancestry attribution, and 0 indicate absolute agreement. Sensitivity analysis #1: absence of contact data. Sensitivity analysis #2: longer serial interval (mean 5.2 days, SD 4.7).Sensitivity analysis #3: contacts were based on human resources data for HCWs and on infectious and susceptible periods. Sensitivity analysis #4: patients are considered to be no longer infectious after the date of the positive RT-PCR for SARS-CoV-2. Sensitivity analysis #5: higher value (3) for the threshold for identification of outliers. Sensitivity analysis #6: default value (5) for the threshold for identification of outliers. HCW, healthcare worker.
Figure 4.
Figure 4.. Histograms displaying the distributions of secondary cases by each case type (‘HCWcovid’, HCWs working in Covid-19 wards; ‘HCWoutbreak’, HCWs working in outbreak wards; ‘patientnoso’, patients with hospital-acquired Covid-19; ‘patientcommunity’, patients with community-acquired Covid-19) and stratified according to early (up to 9 April 2020) and late phases (as of 10 April 2020).
Number of cases in early phase: HCWoutbreak 19, HCWcovid 43, patientnoso 25, patientcommunity 1. Number of cases in late phase: HCWoutbreak 7, HCWcovid 36, patientnoso 17, patientcommunity 0. HCW, healthcare worker.
Figure 5.
Figure 5.. Proportions of transmissions (fcase) attributed to each case type (HCWcovid, HCWoutbreak, patientnoso, and patientcommunity) for each of the 1000 posterior trees retained.
The blue histograms indicate the expected random distributions of fcase, given the prevalence of each case type. The red histograms show the observed distribution of fcase, across 1000 transmission trees reconstructed by outbreaker2. (A) All cases. (B) Transmission to HCWs in Covid-19 wards only. (C) Transmission to HCWs in non-Covid-19 wards (i.e., outbreak wards) only. (D) Transmission to patients with nosocomial Covid-19 only. HCW, healthcare worker.
Appendix 1—figure 1.
Appendix 1—figure 1.. Ward movements for patients involved in a cluster.
Each row corresponds to a patient, and the solid lines indicate hospitalisation dates. The lines are coloured according to which ward a patient was in on a particular day. Outbreak wards (A–D) are coloured differently from non-outbreak wards (Q–Z).
Appendix 1—figure 2.
Appendix 1—figure 2.. Ward-to-ward transmission matrix.
The matrix indicates the sum of transmission events across all posterior trees from cases in ‘infector’ wards (vertical axis) to cases in ‘infectee’ wards (horizontal axis). The degree of shading is proportional to the estimated posterior number of transmissions for each ward-to-ward pair. Outbreak wards: A–D; non-outbreak wards: P–Z (Z is ‘all wards’).
Appendix 1—figure 3.
Appendix 1—figure 3.. Proportions of transmissions attributed to (A) outbreak (foutbreak-ward) and (B) non-outbreak (fnon-outbreak-ward) wards.
The blue histograms indicate the expected random distributions of fward, given the proportion of HCWs amongst cases. The red histograms show the observed distribution of fward, across 1000 transmission trees reconstructed by outbreaker2. (A). All wards. (B) Transmission to outbreak wards only. (C) Transmission to non-outbreak wards only.
Author response image 1.
Author response image 2.

References

    1. Abbas M, Robalo Nunes T, Cori A, Cordey S, Laubscher F, Baggio S, Jombart T, Iten A, Vieux L, Teixeira D, Perez M, Pittet D, Frangos E, Graf CE, Zingg W, Harbarth S. Explosive nosocomial outbreak of SARS-CoV-2 in a rehabilitation clinic: the limits of genomics for outbreak reconstruction. The Journal of Hospital Infection. 2021a;117:124–134. doi: 10.1016/j.jhin.2021.07.013. - DOI - PMC - PubMed
    1. Abbas M, Robalo Nunes T, Martischang R, Zingg W, Iten A, Pittet D, Harbarth S. Nosocomial transmission and outbreaks of coronavirus disease 2019: the need to protect both patients and healthcare workers. Antimicrobial Resistance and Infection Control. 2021b;10:7. doi: 10.1186/s13756-020-00875-7. - DOI - PMC - PubMed
    1. Abbas M, Zhu NJ, Mookerjee S, Bolt F, Otter JA, Holmes AH, Price JR. Hospital-onset COVID-19 infection surveillance systems: a systematic review. The Journal of Hospital Infection. 2021c;115:44–50. doi: 10.1016/j.jhin.2021.05.016. - DOI - PMC - PubMed
    1. Aggarwal D, Myers R, Hamilton WL, Bharucha T, Tumelty NM, Brown CS, Meader EJ, Connor T, Smith DL, Bradley DT, Robson S, Bashton M, Shallcross L, Zambon M, Goodfellow I, Chand M, O’Grady J, Török ME, Peacock SJ, Page AJ, COVID-19 Genomics UK (COG-UK) Consortium The role of viral genomics in understanding COVID-19 outbreaks in long-term care facilities. The Lancet. Microbe. 2022;3:e151–e158. doi: 10.1016/S2666-5247(21)00208-1. - DOI - PMC - PubMed
    1. Ali ST, Wang L, Lau EHY, Xu X-K, Du Z, Wu Y, Leung GM, Cowling BJ. Serial interval of SARS-CoV-2 was shortened over time by nonpharmaceutical interventions. Science (New York, N.Y.) 2020;369:1106–1109. doi: 10.1126/science.abc9004. - DOI - PMC - PubMed

Publication types