. 2022 Jul 18;13(1):4167.
doi: 10.1038/s41467-022-31719-0.

Proteomic analysis reveals key differences between squamous cell carcinomas and adenocarcinomas across multiple tissues

Affiliations

Proteomic analysis reveals key differences between squamous cell carcinomas and adenocarcinomas across multiple tissues

Qi Song et al. Nat Commun. .

Abstract

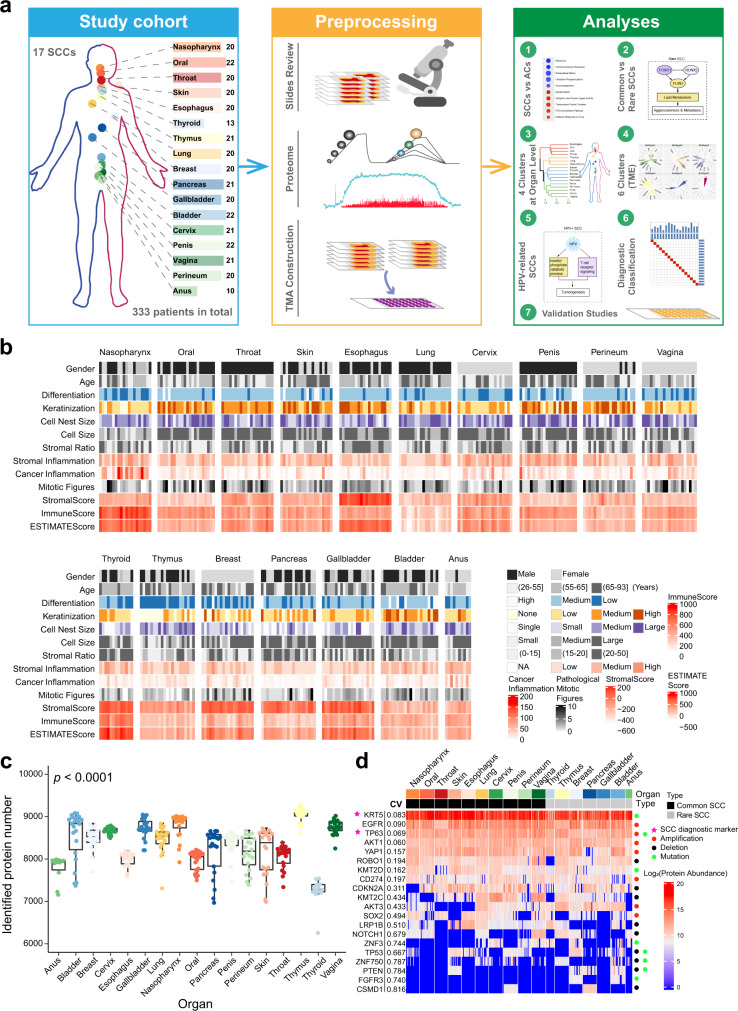
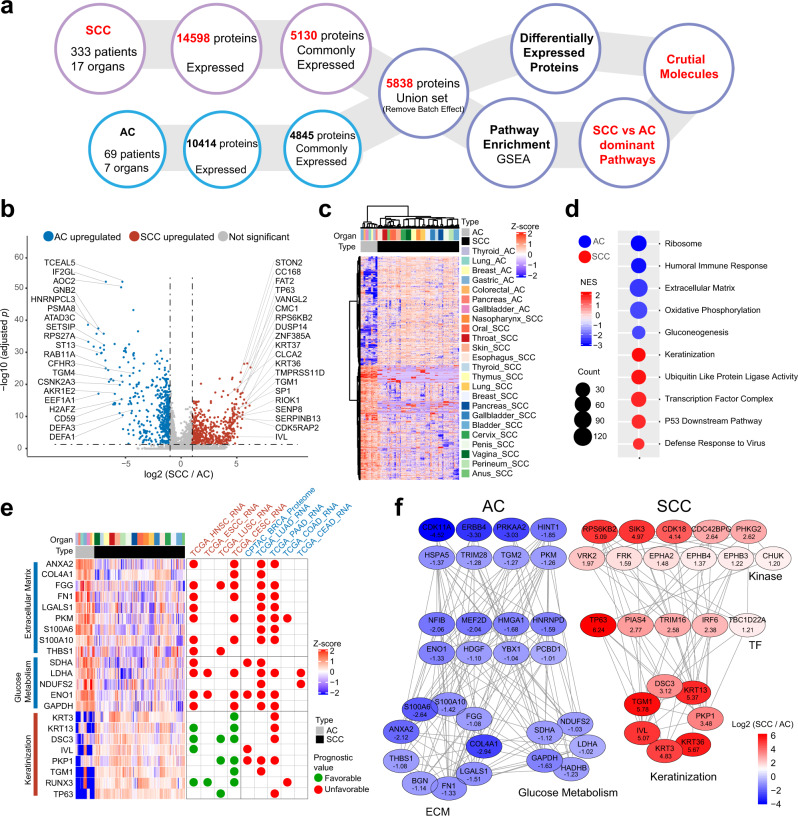
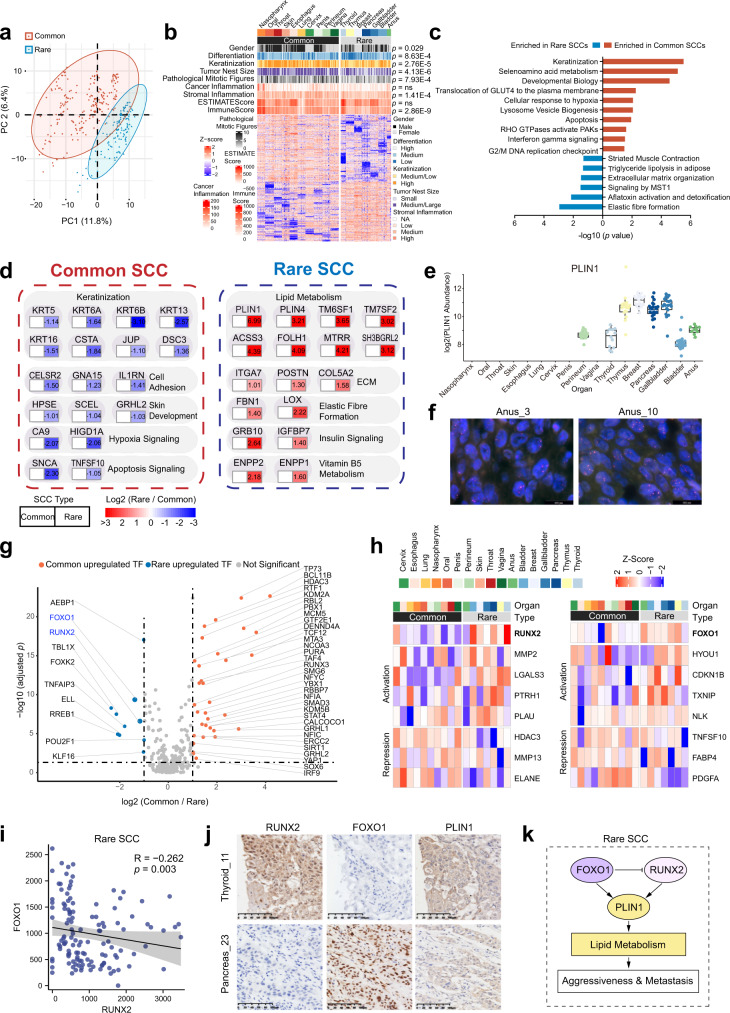
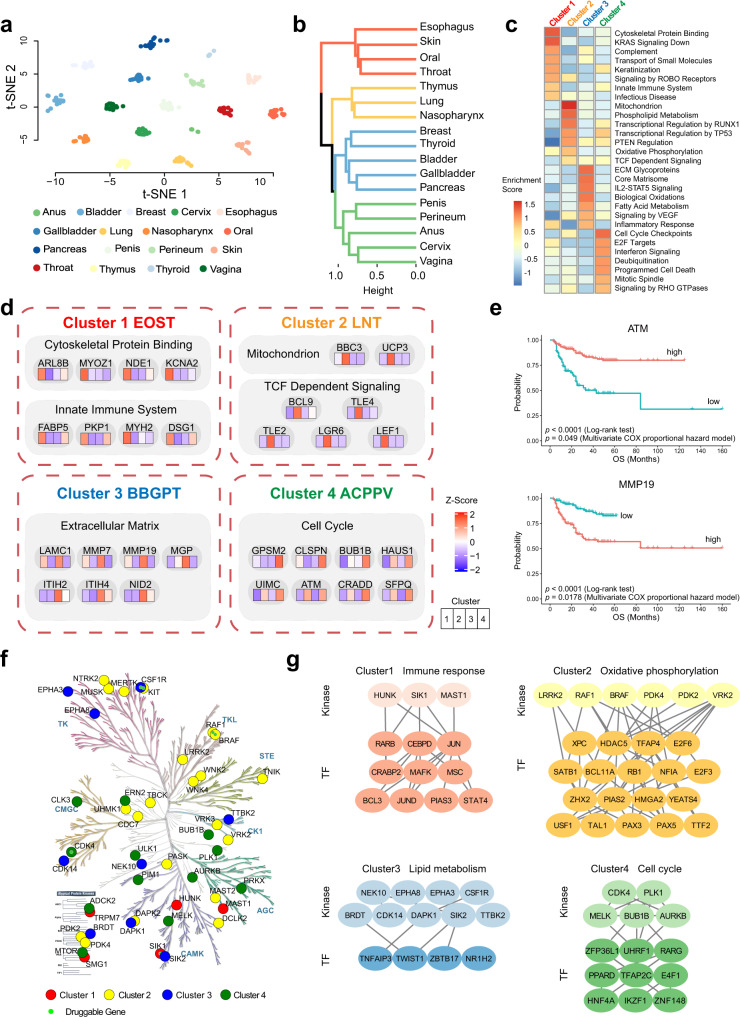
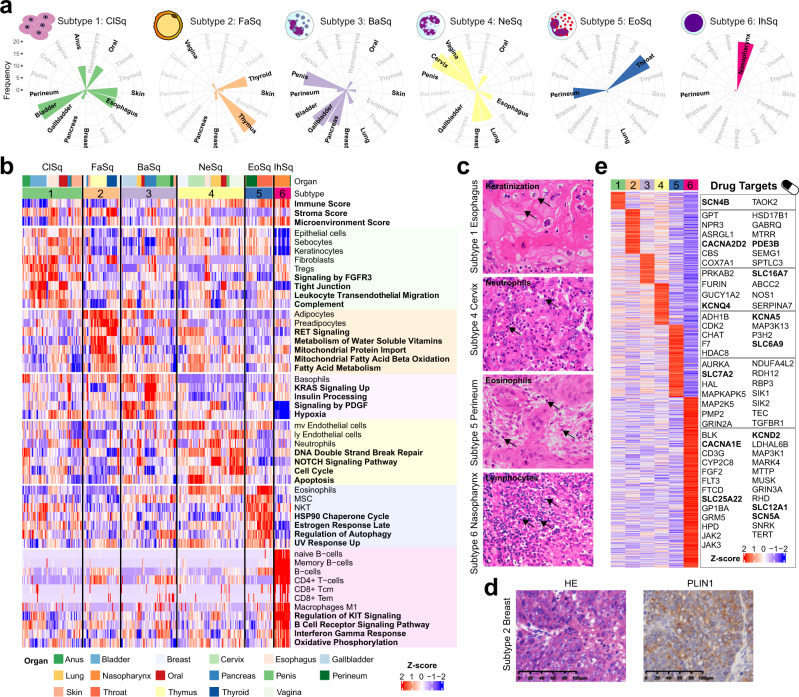
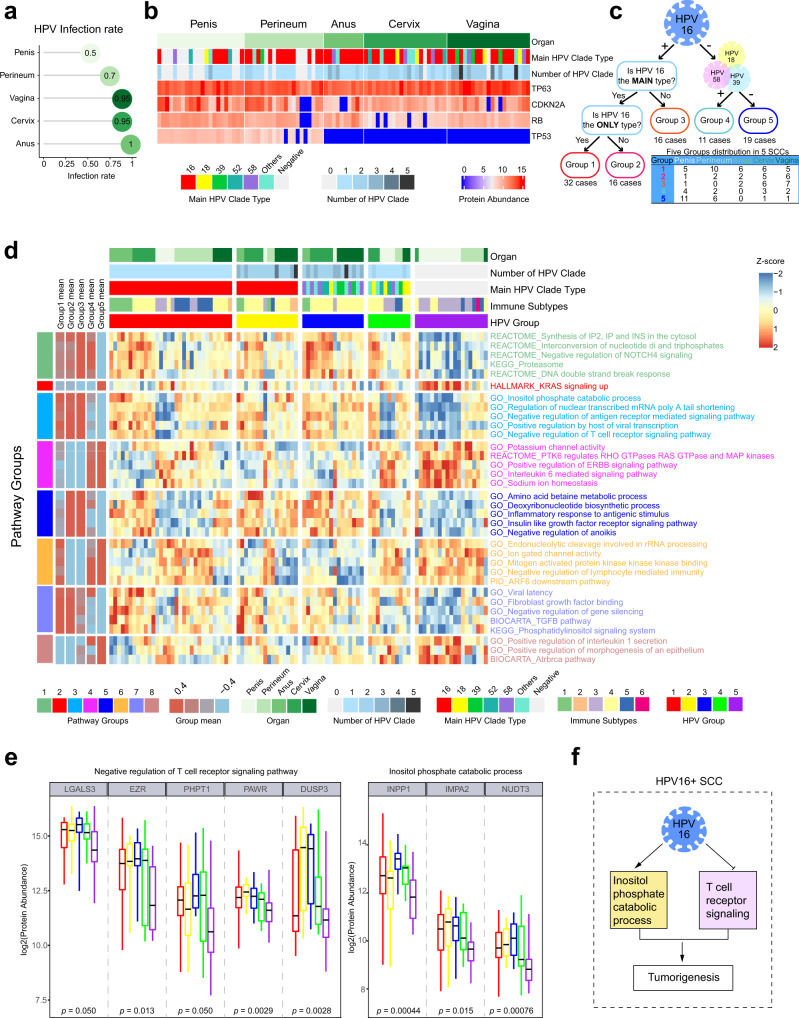
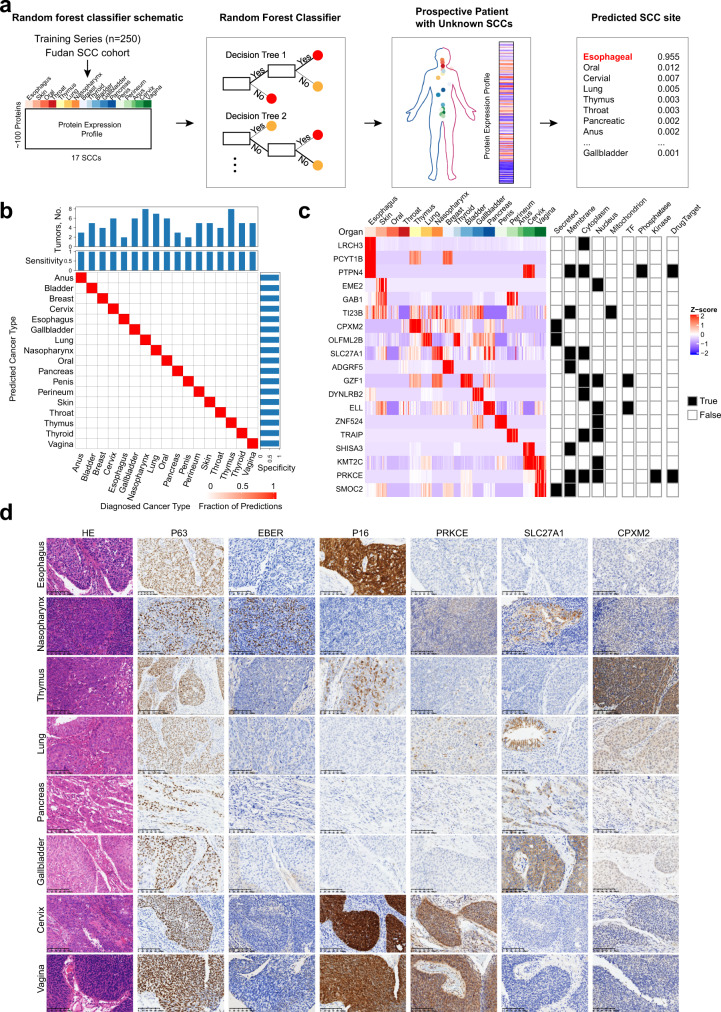
Squamous cell carcinoma (SCC) and adenocarcinoma (AC) are two main histological subtypes of solid cancer; however, SCCs are derived from different organs with similar morphologies, and it is challenging to distinguish the origin of metastatic SCCs. Here we report a deep proteomic analysis of 333 SCCs of 17 organs and 69 ACs of 7 organs. Proteomic comparison between SCCs and ACs identifies distinguishable pivotal pathways and molecules in those pathways play consistent adverse or opposite prognostic roles in ACs and SCCs. A comparison between common and rare SCCs highlights lipid metabolism may reinforce the malignancy of rare SCCs. Proteomic clusters reveal anatomical features, and kinase-transcription factor networks indicate differential SCC characteristics, while immune subtyping reveals diverse tumor microenvironments across and within diagnoses and identified potential druggable targets. Furthermore, tumor-specific proteins provide candidates with differentially diagnostic values. This proteomics architecture represents a public resource for researchers seeking a better understanding of SCCs and ACs.


Conflict of interest statement

The authors declare no completing interests.

Figures

Fig. 1
Fig. 1. Proteomics of pan-squamous cell carcinoma (SCC) cohort.
a Overview of the proteomics workflow involving pan-SCC cohort, preprocessing, and analyses. In the preprocessing step, Haematoxylin and eosin (H&E) stained slides were examined and evaluated, a mass spectrometry (MS)-based label-free quantification strategy was adopted in the proteomics study, and a tissue microarray (TMAs) was constructed. b The study cohort included 333 SCC patients of 17 organs. Clinicopathological parameters were included in the heatmap. See also Supplementary Fig. 1a–1s and Supplementary Data 1. c Number of proteins quantified in each SCC patients (Kruskal–Wallis test, p < 0.0001). nanus = 10, nbladder = 22, nbreast = 20, ncervix = 21, nesophagus = 20, ngallbladder = 20, nlung = 20, nnasopharynx = 20, noral = 22, npancreas = 21, npenis = 22, nperineum = 20, nskin = 20, nthroat = 20, nthymus = 21, nthyroid = 13, and nvagina = 21 biologically independent samples examined. Data are expressed as mean values ± SEM. The boxes indicate the interquartile ranges, and no outliers are shown. d The protein abundance of SCC diagnostic markers and highly variant genes, the corresponding coefficient of variation (CV) for each marker among 333 SCCs was labeled on the left side. Source data are provided as a Source Data file.
Fig. 2
Fig. 2. Proteomic differences of pan-SCCs and pan-ACs.
a The workflow for differential analysis between pan-SCCs and pan-ACs. A total of 5838 proteins commonly expressing in SCCs and/or ACs was obtained and differentially expressed proteins were calculated (Wilcoxon rank-sum test), and Gene set enrichment analysis (GSEA) was performed. b, c A volcano plot and a heatmap showed the results of a two-sided Wilcoxon rank-sum test (BH-adjusted p < 0.05, fold change > 2) comparing pan-ACs and pan-SCCs. Significantly differentially expressed proteins were labeled in the volcano plot. d GSEA revealed the pathways that were significantly enriched in pan-ACs and pan-SCCs. NES, normalized enrichment score. e The prognostic value of differentially expressed proteins in pan-AC-enriched pathways (extracellular matrix and glucose metabolism) and pan-SCC enriched pathway (keratinization) by exploring pan-SCC cohort (this study) and 9 TCGA datasets. P values of pan-SCC cohort were from multivariate Cox proportional hazard model (including age, gender, TNM stage, protein expression, organ, and histology), and p values for 9 TCGA datasets were from log-rank test. f The regulation network of kinases, TFs, and DEPs in pan-ACs and pan-SCCs. All kinases, TFs, and DEPs were colored by log2 (SCC/AC).
Fig. 3
Fig. 3. Proteomic differences of common SCCs and rare SCCs.
a Principal-component analysis (PCA) of common SCCs and rare SCCs. b The association of common and rare SCCs with 9 variables (two-sided Fisher’s exact test was used for categorical variables and two-sided Wilcoxon rank-sum test was used for continuous variables), and the heatmap of significantly DEPs (Wilcoxon rank-sum test, BH-adjusted p < 0.05, fold change > 2) in common SCCs and rare SCCs. c Enriched pathways of significantly DEPs (two-sided Wilcoxon rank-sum test, BH-adjusted p < 0.05, fold change > 2) in common SCCs and rare SCCs. d Proteins in pathways that were differentially expressed in common SCCs and rare SCCs, and representative DEPs. e The PLIN1 protein expression in 17 SCCs. f Representative PLIN1 fluorescence in situ hybridization signal patterns (red signals = PLIN1, green signals = CEP15), left, this case (Anus_3) was scored negative for PLIN1 amplification. PLIN1/nucleus ratio = 2.52; right, this case (Anus_10) was scored as positive for PLIN1 amplification. PLIN1/nucleus ratio = 6.2. The boxes indicate the interquartile ranges, and no outliers are shown. g Differential expressed TFs (two-sided Wilcoxon rank-sum test, BH-adjusted p < 0.05, fold change > 2) in common SCCs and rare SCCs. The two TFs, RUNX2 and FOXO1, were labeled in blue. h The expression heatmap of downstream transcriptional targeted genes (TGs) regulated by RUNX2 and FOXO1 (in bold). The expression level was scaled by row. i A scatterplot showed the association between the protein abundance of RUNX2 (x-axis) and FOXO1 (y-axis). Pairwise Spearman correlation. j Immunohistochemistry staining for RUNX2, FOXO1, and PLIN1 expression in rare SCCs (one case of thyroid SCC and one case of pancreatic SCC) was concordant with the mass spectrometry findings. Scale bar, 100 μm. k Diagram depicted our hypothesis of lipid metabolism upregulation contributing to rare SCC aggressiveness and metastasis. Source data are provided as a Source Data file.
Fig. 4
Fig. 4. Proteomic clusters of pan-SCCs and associations with SCC initiation.
a T-SNE plot of 17 SCC samples, color coded for SCC originating organs. b Hierarchical clustering analysis of proteomics for 333 SCC samples. Color differences in the dendrogram indicated 4 clusters that were resolved by multiscale bootstrapping. c GSEA revealed the pathways that were significantly enriched in the four proteomic clusters respectively. d Representative pathways and corresponding significant DEPs (Kruskal–Wallis test, BH-adjusted p < 0.05, fold change > 2) in the four proteomic clusters, cluster names were named by initials of each organ and ordered alphabetically. e Kaplan–Meier survival curves for ATM and MMP19 with p value from multivariate Cox proportional hazard model (including protein expression, age, gender, histology, organ, and stage) labeled. f Kinmap (http://www.kinhub.org/kinmap/index.html) of differentially expressed kinases with different colors for the four proteomic clusters. Illustration reproduced courtesy of Cell Signaling Technology, Inc. (www.cellsignal.com). g The regulation networks of kinases and TFs in the four proteomic clusters.
Fig. 5
Fig. 5. Immune-based subtyping of pan-SCCs.
a Coxcomb diagrams showing the distribution of 17 SCCs in 6 subtypes, including (1) Classical squamous (ClSq), (2) Fatty acid metabolic (FaSq), (3) Basophils inflamed (BaSq), (4) Neutrophils inflamed (NeSq), (5) Eosinophils inflamed (EoSq), and (6) Immune hot (IhSq). b Proteome-based microenvironmental cell signatures and over-represented pathways in 6 subtypes. c Represented morphologies of SCCs with specific tumor microenvironment cell infiltrating in 4 subtypes (subtype 1, 4–6). Arrows depict the specific cell types. Basophils were not shown because they cannot be recognized by HE staining. Scale bar, 100 μm. d Haematoxylin and eosin (H&E) stained and PLIN1 immunohistochemistry (IHC) images showing one example of subtype 2 samples with suspected lipid droplets. e Drug targets in 6 subtypes (drug targets discussed in the text were in bold).
Fig. 6
Fig. 6. Characterization of HPV-related SCCs.
a HPV infection rate of 5 anogenital SCCs. b Details of HPV infection and protein abundance of known molecules related to HPV infection of 5 anogenital SCCs. c Grouping of 5 anogenital SCCs according to HPV16 infection status and 5 groups were obtained. d Impact of HPV status on pathways in 5 anogenital SCCs. The heatmaps showed protein-expression derived, differentially regulated pathways associated with differential HPV infection. Pathway groups were defined according to the patterns of differential HPV infection. See also “Methods” and Table S6B. e Boxplots showing log2 protein abundance of differentially expressed molecules in two pathways that were over-represented in HPVT16 infected SCCs (Kruskal–Wallis test, BH-adjusted p < 0.05). n1 = 32, n2 = 16, n3 = 16, n4 = 11, and n5 = 19 biologically independent samples examined. Data are expressed as mean values ± SEM. The boxes indicate the interquartile ranges, and no outliers are shown. f Diagram depicted our hypothesis of inositol phosphate catabolic process upregulation and negative regulation of T cell receptor signaling contributing to HPV16-related SCC tumorigenesis. Source data are provided as a Source Data file.
Fig. 7
Fig. 7. Performance of tumor type classifier and validation for diagnostic markers.
a Schematic of random-forest classifier. Seventy five percent patients of pan-SCC cohort were used to train the classifier. b Performance of the classifier across 17 SCCs in validation set. True (established) cancer types are displayed horizontally and predicted cancer types are displayed vertically. The number of tumors of each cancer type in the cohort is shown at the top, and sensitivity and specificity of the predictions are indicated at the top and right. c The heatmap of 19 proteins used in the classifier and annotation of cellular component, TF, kinase, phosphatase, and drug target are provided. d Haematoxylin and eosin (H&E) staining, immunohistochemistry (IHC) staining of P63, P16, PRKCE, SLC27A1, and CPXM2, and in situ hybridization (ISH) of EBER in representative samples of partial SCC types (originating organ includes: esophagus, nasopharynx, thymus, lung, pancreas, gallbladder, cervix, and vagina). Scale bar, 100 μm.

References

    1. Bray F, et al. Global cancer statistics 2018: GLOBOCAN estimates of incidence and mortality worldwide for 36 cancers in 185 countries. CA Cancer J. Clin. 2018;68:394–424. doi: 10.3322/caac.21492. - DOI - PubMed
    1. He Y, et al. Incidence and mortality of laryngeal cancer in China, 2015. Chin. J. Cancer Res. 2020;32:10–17. doi: 10.21147/j.issn.1000-9604.2020.01.02. - DOI - PMC - PubMed
    1. Devarakonda S, Morgensztern D, Govindan R. Genomic alterations in lung adenocarcinoma. Lancet Oncol. 2015;16:e342–e351. doi: 10.1016/S1470-2045(15)00077-7. - DOI - PubMed
    1. Smyth EC, Nilsson M, Grabsch HI, van Grieken NC, Lordick F. Gastric cancer. Lancet. 2020;396:635–648. doi: 10.1016/S0140-6736(20)31288-5. - DOI - PubMed
    1. Harbeck N, Gnant M. Breast cancer. Lancet. 2017;389:1134–1150. doi: 10.1016/S0140-6736(16)31891-8. - DOI - PubMed

Publication types

Substances