. 2022 Jul 18;12(1):12239.
doi: 10.1038/s41598-022-16158-7.

A strategy to quantify myofibroblast activation on a continuous spectrum

Affiliations

A strategy to quantify myofibroblast activation on a continuous spectrum

Alexander Hillsley et al. Sci Rep. .

Abstract

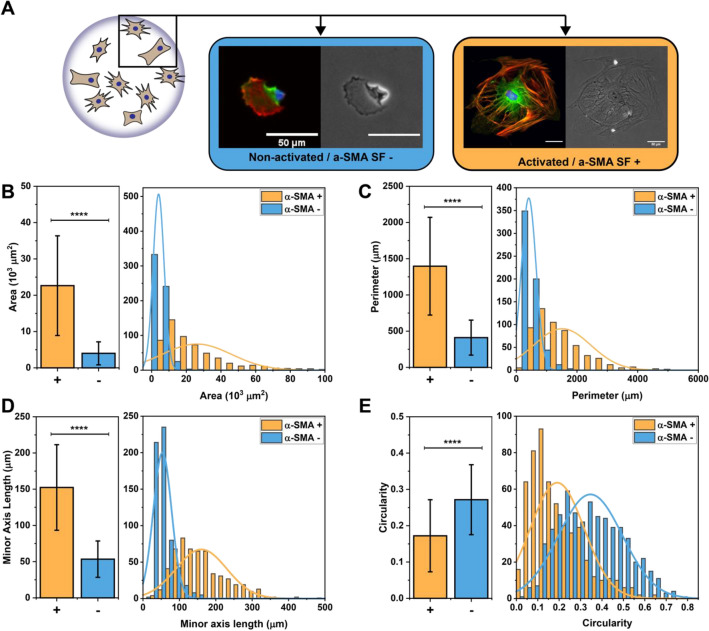
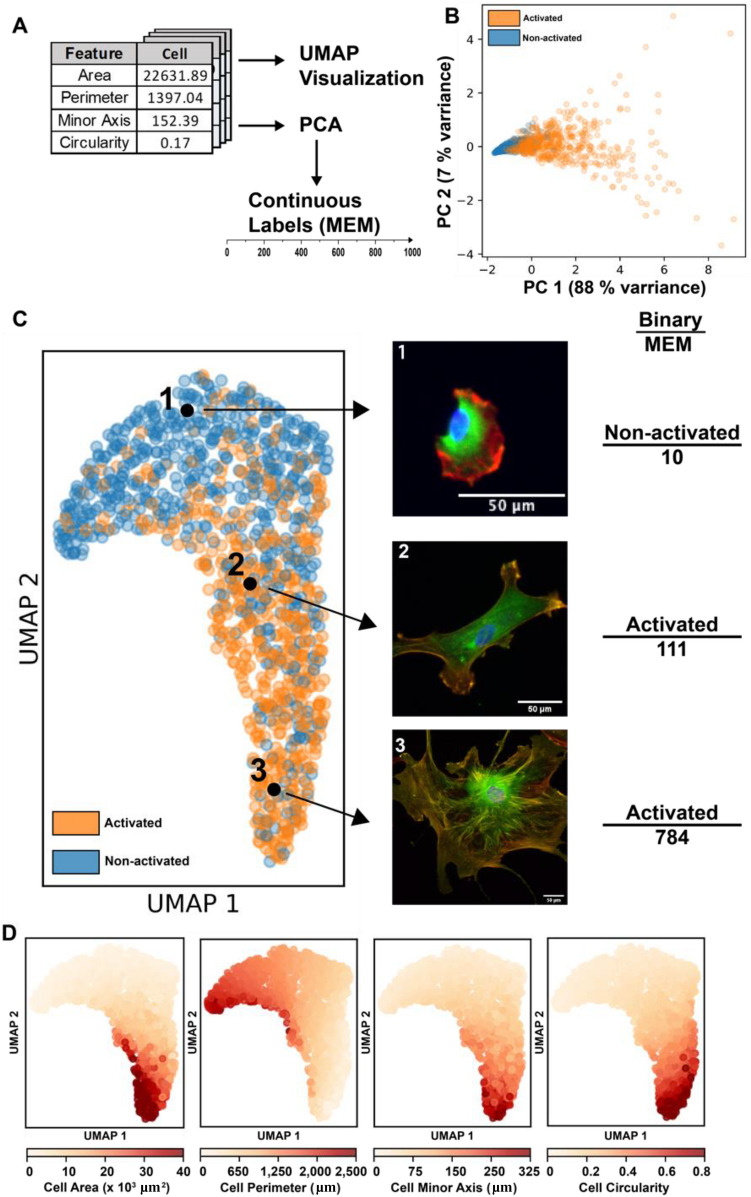
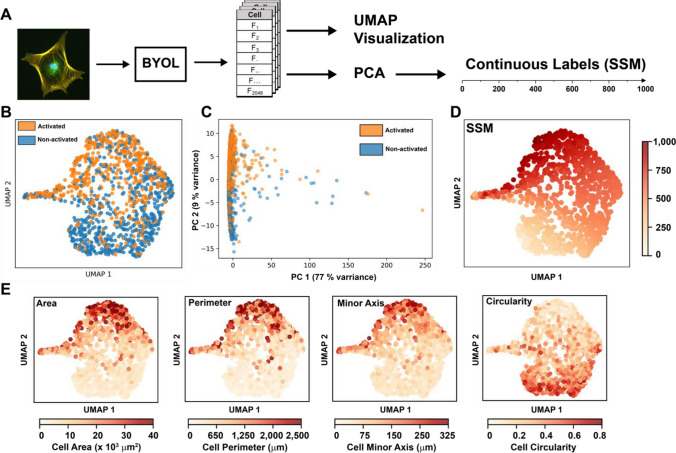
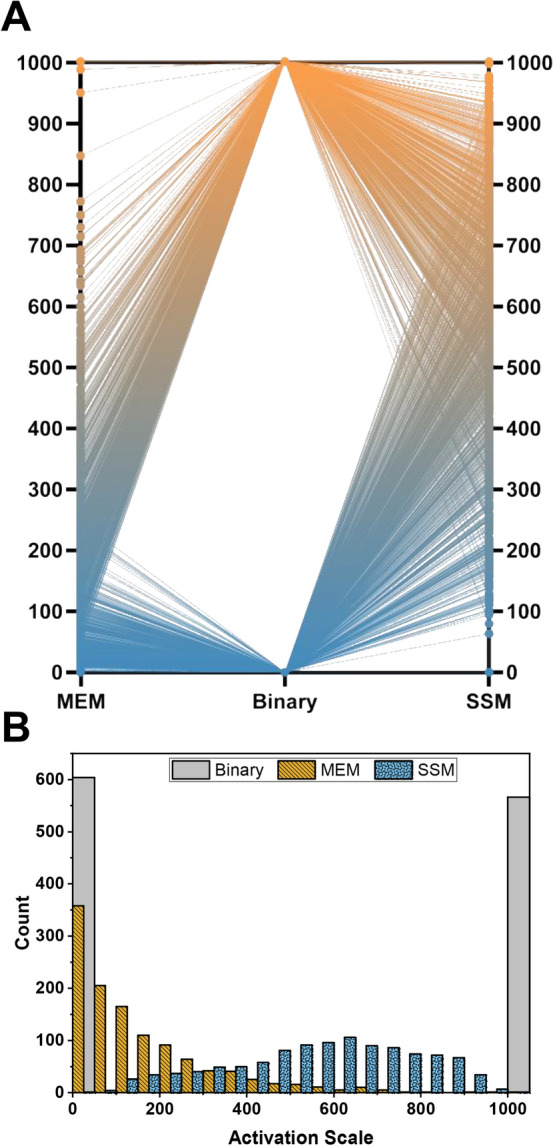
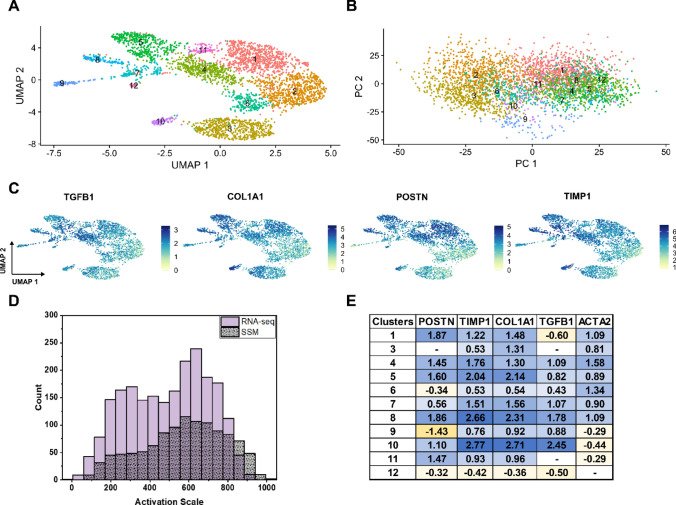
Myofibroblasts are a highly secretory and contractile cell phenotype that are predominant in wound healing and fibrotic disease. Traditionally, myofibroblasts are identified by the de novo expression and assembly of alpha-smooth muscle actin stress fibers, leading to a binary classification: "activated" or "quiescent (non-activated)". More recently, however, myofibroblast activation has been considered on a continuous spectrum, but there is no established method to quantify the position of a cell on this spectrum. To this end, we developed a strategy based on microscopy imaging and machine learning methods to quantify myofibroblast activation in vitro on a continuous scale. We first measured morphological features of over 1000 individual cardiac fibroblasts and found that these features provide sufficient information to predict activation state. We next used dimensionality reduction techniques and self-supervised machine learning to create a continuous scale of activation based on features extracted from microscopy images. Lastly, we compared our findings for mechanically activated cardiac fibroblasts to a distribution of cell phenotypes generated from transcriptomic data using single-cell RNA sequencing. Altogether, these results demonstrate a continuous spectrum of myofibroblast activation and provide an imaging-based strategy to quantify the position of a cell on that spectrum.


Conflict of interest statement

The authors declare no competing interests.

Figures

Figure 1
Figure 1
(A) Representative 3 channel fluorescent (Red:F-actin, Green:α-SMA, Blue:DAPI) and phase contrast images of myofibroblasts and fibroblasts (scale bar = 50 μm) (BE) Bar plots and histograms showing the averages and distribution of four cell size and shape features: area, perimeter, minor axis length, and circularity, respectively. All of these features were significantly different between the two cell phenotypes. N = 566 activated cells and 604 non-activated cells, error bars = standard deviation, ****p < 0.0001.
Figure 2
Figure 2
(A) Overview of the analytical pipeline. Cell feature vectors were first visualized using UMAP, then reduced using PCA and re-scaled to create a continuous label system. (B) 2D PCA reduction of the cell feature vector; PC 1 contained 88% of the variance and was used to create the MEM labels. (C) UMAP reduction of the manually engineered features of all 1104 cells, highlighting cells of different activation levels, with both their binary and MEM label. (D) Labeling the UMAP reduction by cell features (cell area, cell perimeter, cell minor axis, and cell circularity) helps to understand how cells are organized in the reduction.
Figure 3
Figure 3
(A) Overview of the analytical pipeline. Cell images were first normalized, then used as inputs to train a BYOL model. The new abstract cell features were then visualized with UMAP, and a continuous label system was created using PCA. (B) UMAP reduction of the 2048 abstract features learned in the self-supervised model. (C) PCA reduction of the abstract cell features. (D) Labeling UMAP reduction by SSM labels shows a spectrum of activation. (E) Labeling UMAP reduction by cell features shows that this model captures similar patterns to the model in “Classifying cardiac fibroblast activation on a continuous scale” section.
Figure 4
Figure 4
(A) A visualization of all the labeling systems shows the increase in resolution gained by the MEM or SSM system over the binary system. (B) Histograms showing the distribution of labels for each labeling system.
Figure 5
Figure 5
(A) UMAP reduction of the transcriptomic feature vector for each cell. Clusters were identified by the Suerat software. (B) PCA reduction of the transcriptomic features; individual cells are colored according to their cluster number from (A). (C) Labeling each cell by the expression level of four myofibroblast associated genes (TGFB1, COL1A1, POSTN, and TIMP1) shows a consistent spectrum of activation. (D) Using the PCA reduction, another continuous label system was created. The distribution of cells is similar to that seen from the SSM model. (E) Log2(FC) values of myofibroblast associated genes show that clusters 1, 4, 5, 7, 8, and 10 are highly activated compared to cluster 2.

References

    1. Dobaczewski M, Chen W, Frangogiannis NG. Transforming growth factor (TGF)-β signaling in cardiac remodeling. J. Mol. Cell. Cardiol. 2011;51(4):600–606. doi: 10.1016/j.yjmcc.2010.10.033. - DOI - PMC - PubMed
    1. Huang X, Yang N, Fiore VF, et al. Matrix stiffness-induced myofibroblast differentiation is mediated by intrinsic mechanotransduction. Am. J. Respir. Cell Mol. Biol. 2012;47(3):340–348. doi: 10.1165/rcmb.2012-0050OC. - DOI - PMC - PubMed
    1. Herum KM, Lunde IG, Mcculloch AD, Christensen G. The soft- and hard-heartedness of cardiac fibroblasts : Mechanotransduction signaling pathways in fibrosis of the heart. J. Clin. Med. 2017 doi: 10.3390/jcm6050053. - DOI - PMC - PubMed
    1. Schroer AK, Merryman WD. Mechanobiology of myofibroblast adhesion in fibrotic cardiac disease. J. Cell Sci. 2015 doi: 10.1242/jcs.162891. - DOI - PMC - PubMed
    1. Kanisicak O, Khalil H, Ivey MJ, et al. Genetic lineage tracing defines myofibroblast origin and function in the injured heart. Nat. Commun. 2016 doi: 10.1038/ncomms12260. - DOI - PMC - PubMed

Publication types