Review
. 2022 Sep;9(26):e2201740.
doi: 10.1002/advs.202201740. Epub 2022 Jul 18.

Delivering the Promise of Gene Therapy with Nanomedicines in Treating Central Nervous System Diseases

Affiliations
Review

Delivering the Promise of Gene Therapy with Nanomedicines in Treating Central Nervous System Diseases

Meihua Luo et al. Adv Sci (Weinh). 2022 Sep.

Abstract

Central Nervous System (CNS) diseases, such as Alzheimer's diseases (AD), Parkinson's Diseases (PD), brain tumors, Huntington's disease (HD), and stroke, still remain difficult to treat by the conventional molecular drugs. In recent years, various gene therapies have come into the spotlight as versatile therapeutics providing the potential to prevent and treat these diseases. Despite the significant progress that has undoubtedly been achieved in terms of the design and modification of genetic modulators with desired potency and minimized unwanted immune responses, the efficient and safe in vivo delivery of gene therapies still poses major translational challenges. Various non-viral nanomedicines have been recently explored to circumvent this limitation. In this review, an overview of gene therapies for CNS diseases is provided and describes recent advances in the development of nanomedicines, including their unique characteristics, chemical modifications, bioconjugations, and the specific applications that those nanomedicines are harnessed to deliver gene therapies.

Keywords: bio-nanotechnology; blood-brain barrier; central nervous system diseases; gene therapy; nanomedicine.


Conflict of interest statement

The authors declare no conflict of interest.

Figures

Figure 1
Figure 1
The trend in gene therapy for neurological diseases. A) Number of clinical trials of gene therapy for neurological diseases.1) B) Number of publications in gene therapy for neurological diseases.2) C) Status of clinical trials of gene therapy in neurological diseases.3) Note: 1) Results by February 2022 on ClinicalTrials.gov on the condition of “neurological disease”. The number of gene therapy clinical trials are searched on the condition of “neurological diseases and gene therapy”. 2) Results by February 2022 on Web of Sciences Core Collection by Advance searching: TS = (((gene therapy*) or (siRNA) or (AON*) or (RNA interference) or (CRISPR)) and ((brain disease*) or (neurological disease*) or (neurodegenerative disease*) or glioblastoma or (AD*) or (PD*) or (HD*) or (brain tumor*) or (CNS tumor*) or (CNS disease*) or (CNS cancer*) or (brain cancer*))). 3) Ongoing is defined as “not yet recruiting; recruiting; enrolling by invitation; active, not recruiting, available”.
Figure 2
Figure 2
Schematic representation of gene therapies involved in the main CNS diseases. Various gene therapies, including miRNA, siRNA, AON, mRNA, plasmid DNAs, and CRISPR‐Cas, are developed to target and modulate the expression of the CNS disease‐causing genes. Drawn by BioRender.
Figure 3
Figure 3
Backbone modifications. There are many different backbone modifications for the oligonucleotides that can be classified from the first generation to the third generation.[ 321 , 322 ] Examples of the modifications are listed above: DNA, deoxyribonucleases, PS, phosphorothioate; Tmg, internucleotide phosphate modified with a tetramethyl phosphoryl guanidine group; RNA, ribonucleases; 2′‐MOE, 2′‐O‐methoxyethyl (a methoxyethyl substitution in the 2′ position of the sugar moiety); 2′‐OMe, 2′‐O‐methyl (a methyl substitution in the 2′ position of the sugar moiety); 2′‐F, 2′‐fluoro substitution in the 2′ position of the sugar moiety; LNA, locked nucleic acid (an extra bridge between 2′ oxygen and 4′ carbon of the sugar moiety); cEt, constrained ethyl (an ethyl bridge between 2′ oxygen and 4′ carbon of the sugar moiety); PMO, phosphorodiamidate morpholino oligonucleotide, or morpholino (backbone composed of methylenemorpholine rings and phosphorodiamidate linkages); ENA, 2′‐O,4′‐C‐ethylene‐bridged nucleic acid (an ethylene bridged at the furanose sugar ring at 2′‐O and 4′‐C ends); tcDNA, tricyclo‐DNA (3 additional C‐atoms between C(5′) and C(3′) of the sugar moiety); PNA, peptide nucleic acid (entire sugar phosphate backbone is replaced with polyamide linkage).
Figure 4
Figure 4
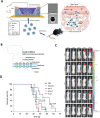
Inorganic NPs for gene therapy in CNS diseases. A–D) Gold‐iron oxide NPs (GION) for miRNA delivery for GBM treatment. (A) Schematic representation of GION structures and representative TEM image. GION are coated with β‐cyclodextrin‐chitosan (CD‐CS) hybrid polymer and loaded with miRNA (miR‐100 and antimir‐21), and modified with targeting ligand PEG‐T7. (B) The survival curve of GBM mice after intranasal administration of control (green), GION&miR (purple), TMZ (orange), and GION miR&TMZ (pink). (C) ex vivo fluorescence images and (D) RT‐PCR quantification of miRNA in various organs of mice treated with GION‐CD‐CS‐miRNA‐T7. (A–D) Reproduced with permission.[44] Copyright 2019, Elsevier Ltd. E,F) Superparamagnetic iron oxide microtubes for plasmid DNA delivery for PD. E) The GDNF expression measured by Western blot analysis. The animals were sacrificed after 5 days and 6 weeks of treatment. F) Motor ability of PD mice measured by the beam‐walking test. Times to cross 80 cm beam were recorded. (E,F) Reproduced under the terms of the Creative Commons CC BY NC ND license.[ 362 ] Copyright 2020, The Author(s), published by Elsevier Inc.
Figure 5
Figure 5
Magnetic NPs to combine gene delivery and cellular therapy for stroke. A) Schematic illustration of MSCs therapy for post‐ischemic stroke based on magnetosome‐like ferrimagnetic iron oxide nanochains (MFIONs). B) TEM image of ferrimagnetic iron oxide nanocubes (FIONs) used to assemble MFIONs (Top). Powder XRD patterns of the synthesized FIONs compared with the standard Fe3O4 (Bottom). C) Confocal images of the process of cellular internalization, the subsequent endolysosomal escape, and nuclear import in the delivery of FITC‐DNA by indicated vectors. Blue: nucleus. Green: FITC‐DNA; Red: endolysosomes. White arrows indicate the nuclear import of FITC‐DNA. D) CXCR4 expression in MSCs 24 h after given treatments. E) Survival curves of ischemic mice with the given treatments. F) Reduction of infarct volume examined by MRI (indicated by red dash lines and yellow arrows), and G) TTC staining (indicated by white arrows). It suggested a therapeutic effect of the engineered‐MSC by magnetic NPs in the recovery post‐ischemic stroke. Reproduced with permission.[ 379 ] Copyright 2019, WILEY‐VCH.
Figure 6
Figure 6
QD‐based gene therapy for CNS diseases. Ag2S QD‐based nanocomplexes for delivery of plasmid expressing neprilysin (NEP) for AD. The Ag2S fluorescence imaging is used to guide the real‐time transplantation of NSC. A) Synthesis of Ag2S QDs covered with polymer PBAE and PLGA (PPAR). Plasmid and RA were loaded into the nanocomplexes. B) TEM image of the PPAR nanocomplexes. C) In vivo NIR‐II imaging of the stereotactically transplanted NSCs using Ag2S QDs. D) The escape track assay during spatial learning and memory training of AD mice 1 month (D) and E) 6 month after treatment. G1: healthy mice; G2: PBS‐treated AD mice. G3: NSC‐treated AD mice; G4: nanocomplexes‐NSC‐treated AD mice; G5: NEP‐NSC‐treated AD mice; G6: nanocomplexes‐NEP‐NSC‐treated AD mice. Reproduced with permission.[ 398 ] Copyright 2021, Wiley‐VCH.
Figure 7
Figure 7
Engineered polymeric NPs for gene delivery for AD treatment. A) Schematic illustration of the formation of the glycosylated “triple‐interaction” stabilized siRNA NPs. B) Increased behavioral evaluation of siRNA‐carried polymeric NP‐treated APP/PS1 mice, by showing decreased number of crossing the platform location of each group on the probe test day. C) Decreased BACE1 protein expression in hippocampus and cortex from nanocarrier‐treated APP/PS1 mice. D) Reduced p‐tau expression in hippocampus and cortex from nanocarrier‐treated APP/PS1 mice. Reproduced with permission.[ 53 ] Copyright 2020, The Authors, some rights reserved, exclusive licensee AAAS. Distributed under a Creative Commons Attribution NonCommercial License 4.0 (CC BY‐NC).
Figure 8
Figure 8
PEGylated NPs for gene delivery to the brain. A) Synthesis of polymers used for NP fabrication. a) Synthesis scheme of acrylate‐terminated PBAE base polymer, b) conventionally end‐capped ePBAEs, c) PEG–PBAEs, and d) monomers used in the synthesis of a library of PBAE‐based polymers. B) Confocal microscopy images of representative frozen sections from the brain injected with a) PBAE, b) PEG–PBAE NPs (scale bar = 200 µm). Higher magnification images of (a1/b1) tumor core regions and (a2/b2) tumor penumbra regions indicated by boxes respectively in (a) and (b) (scale bar = 50 µm). Blue: nuclei, Red: Cy5‐labeled NPs, Green: GBM1A cells. D) Tumor penetration of PEGylated and non‐PEGylated NPs. C) Brain penetration of PEGylated and non‐PEGylated NPs, analyzed as mean percent Cy5 fluorescence intensity in subdivided rectangular ROI in confocal images at 500 µm intervals beginning at the site of catheter implantation (n = 2, *p < 0.05). E) Kaplan–Meier survival plot between mice treated with intratumoral injection of either PEG–PBAE/pHSV‐tk or PEG–PBAE/pDsRed NPs in conjunction with systemic ganciclovir (n ≥ 4 per group). Reproduced with permission.[ 418 ] Copyright 2020, American Chemical Society.
Figure 9
Figure 9
Gene delivery to the brain using dendrimers for ischemic stroke therapy. PAMAM generation 2 (PG2) conjugated with histidine and arginine (PG2HR) for delivery of plasmid DNA to the ischemic brain. A) Synthesis scheme of PG2 modified with only arginine (PG2R, top), and PG2 modified with both histidine and arginine (PG2HR, bottom). B) The transfection efficiency induced by the given treatments measured with a luciferase activity assay, in the absence of serum (left), and in the presence of serum (right). PEI25k was used as control. C) Confocal images of cellular uptake of plasmid DNA/polymer complexes(red). D) Infarct volume measured by TTC staining after delivery of plasmid DNA/polymer complexes in the ischemic brain. Plasmid DNA was designed to target HO‐1 gene (pHO‐1) encoding heme oxygenase‐1. MCAO‐reperfusion was performed as control. n = 7 in each group. Reproduced with permission.[ 424 ] Copyright 2021, Elsevier B.V.
Figure 10
Figure 10
Brain gene delivery using exosomes for AD. Exosomes derived from MSCs (MSCs) for delivery for AD. A) Size distribution of exosomes measured by DLS. B) TEM images of exosomes. scale bar = 100 nm. C) The brain distribution of exosomes in the AD brain after 1 h intranasal administration in APP/PS1 mice. They were mainly found in the neurons (NeuN) and much less in astrocytes (GFAP) and microglia (IBA‐1). (B) Exosomes increased Ki‐67 positive cells in the DG region of hippocampus in APP/PS1 mice, indicating their neuroprotection efficacy. Left: Immunohistochemical staining for Ki‐67. right: quantification of Ki67‐67 positive cells. (C) Exosomes rescued memory deficits in APP/PS1 mice by showing improved a) DR in the novel object recognition test; b) the ratio of DR in the second day (DR2) and the first day (DR1) in the novel object recognition test; c) the number of arm entries and d) alternation behavior in Y‐maze test. Data represent mean ± SD, n = 7–8 per group, *p<0.05, **p<0.01, ***p< 0.001, compared with the vehicle treated APP/PS1 group. Reproduced with permission.[ 462 ] Copyright 1969, Elsevier.
Figure 11
Figure 11
CNP for large‐scale production of exosomes for mRNA delivery in GBM. A) Schematic of CNP by using transient electrical pulses. The harvested exosomes contain transcribed mRNA and can cross the blood‐brain‐barrier (BBB) or blood‐brain‐tumor barrier (BBTB). B) Schematic of cloning GBM‐targeting peptides into the N terminus of CD47 on the surface of exosomes. C) Survival curve of mice with orthotopic GBM received treatments of exosomes (exosomes), Exo‐T containing PTEN mRNA (Exo‐T), empty Exo‐T (E‐Exo‐T), TurboFect NPs (Turbo), or PBS via tail‐vein injection. n = 8 mice per group. Reproduced with permission.[ 465 ] Copyright 2019, Springer Nature Limited.
Figure 12
Figure 12
Schematic of EXOtic devices for mRNA delivery. Exosomes containing the RNA packaging device (CD63‐L7Ae), targeting module (RVG‐Lamp2b), cytosolic delivery helper (Cx43 S368A), and mRNA (e.g., nluc‐C/Dbox), were produced from exosome producer cells by means of an exosome production booster. Reproduced under the terms of Creative Commons Attribution 4.0 International License.[ 293 ] Copyright 2018, The Author(s), published by Spring Nature Group.
Figure 13
Figure 13
Brain gene delivery using liposomes for GBM. A) Schematic of solid lipid NPs (SLN) with targeting peptide iRGD for delivery of siRNA against EGFR and PD‐L1 for GBM. A low dose of radiation was given to mice with an orthotopic GBM alongside the retro‐orbital administration of treatments. B) Florescence images of tumor growth in mice bearing GL261‐Fluc tumors. Mice were irradiated (or not as a control), and retro‐orbitally injected with either f(SLN)‐iRGD:siCTRL, f(SLN)‐iRGC:siEGFR/PLD1, or f(SLN)‐scriRGD:siEGFR/PDL1. The treatments were given at days 7, 14, and 21 after tumor cell inoculation. C) Kaplan–Meier survival curves of GBM mice received different treatments. n = 5–12 mice per group. D) H&E staining (top), immunohistochemical staining of PD‐L1 (middle), and CD8 (bottom) of brain sections in GBM mice receiving various treatments (DAPI, blue; PD‐L1, green; and CD8, red). The combination of radiation and nanocomplexes decreased PD‐L1 expression while increasing recruitment of CD8+ T‐cells. Reproduced with permission.[ 158 ] Copyright 2019, American Chemical Society.
Figure 14
Figure 14
Brain gene delivery using liposomes for GBM. A) Schematics of liposome‐templated hydrogel NPs (LHNPs) where the core is made from DOTAP liposomes and the shell is a PEI hydrogel (a). The surface is modified with targeting peptides mHph3 and internalizing RGD (iRGD) by conjugation (b). In this study, lipofectamine 2000 (Lip2k) was used as benchmark. B) Gene delivery efficiency of pGL4.13‐loaded, PEI hydrogel‐core DOTAP liposomes and Lipofectamine 2000 (Lip2k) on U87 cells as measured with Luciferase signal. The treatments were given for 72 h. C) Cytotoxicity of LHNPs and Lip2k on U87 cells when 60 ng of DNA was delivered. Reproduced with permission.[ 32 ] Copyright 2017, WILEY‐VCH.
Figure 15
Figure 15
Ionizable lipid for nucleic acid delivery to the brain. Chemical structures of the selected lipids, which typically contains a head group (hydrophilic), lipid chain (hydrophobic), and a linker. Reproduced with permission.[ 311 ] Copyright 2020, The Authors, some rights reserved, exclusive licensee AAAS. Distributed under a Creative Commons Attribution NonCoomercial License 4.0 (CC‐BY‐NC).

References

    1. Feigin V. L., Abajobir A. A., Abate K. H., Abd‐Allah F., Abdulle A. M., Abera S. F., Abyu G. Y., Ahmed M. B., Aichour A. N., Aichour I., Aichour M. T. E., Akinyemi R. O., Alabed S., AI‐Raddadi R., Alvis‐Guzman N., Zunt J. R., Murray C. J. L., Vos T., Lancet Neurol. 2017, 16, 877. - PubMed
    1. Feigin V. L., Nichols E., Alam T., Bannick M. S., Beghi E., Blake N., Culpepper W. J., Dorsey E. R., Elbaz A., Ellenbogen R. G., Fisher J. L., Fitzmaurice C., Giussani G., Glennie L., Murray C. J. L., Vos T., Lancet Neuro. 2019, 18, 459.
    1. World Health Organization , Neurological disorders: public health challenges, World Health Organization, Geneva 2006.
    1. Masters C. L., Bateman R., Blennow K., Rowe C. C., Sperling R. A., Cummings J. L., Nat. Rev. Dis. Primers 2015, 1, 15056. - PubMed
    1. Atri A., Semin. Neurol. 2019, 39, 227. - PubMed

LinkOut - more resources