. 2022 Aug 15;135(16):jcs260120.
doi: 10.1242/jcs.260120. Epub 2022 Aug 25.

A new mechanism of fibronectin fibril assembly revealed by live imaging and super-resolution microscopy

Affiliations

A new mechanism of fibronectin fibril assembly revealed by live imaging and super-resolution microscopy

Darshika Tomer et al. J Cell Sci. .

Abstract

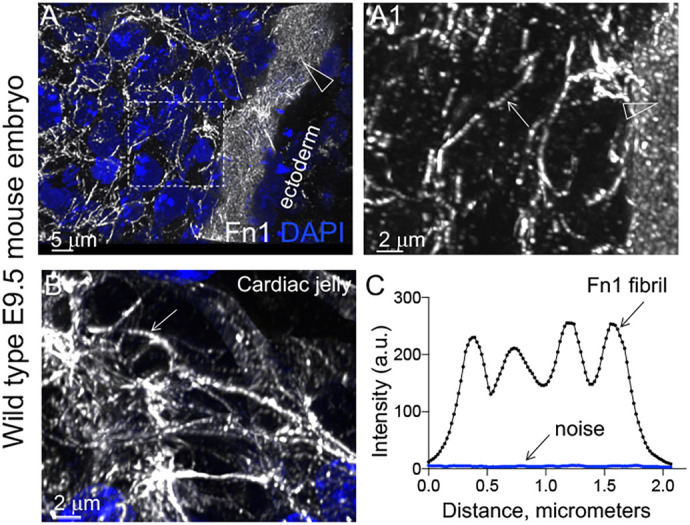
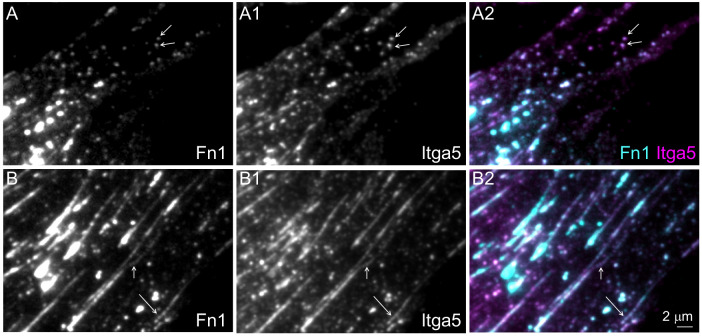
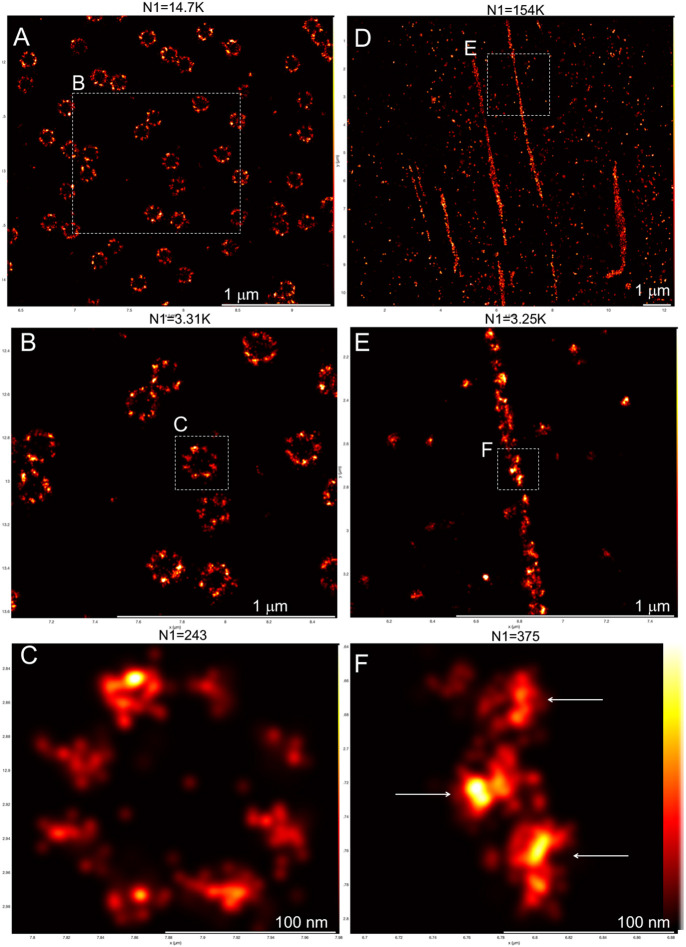
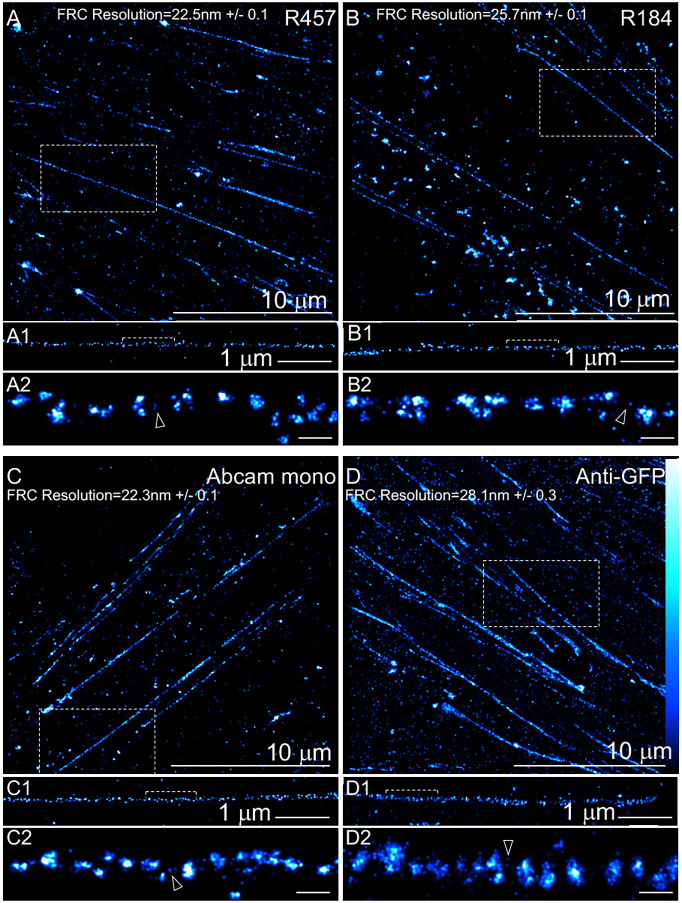
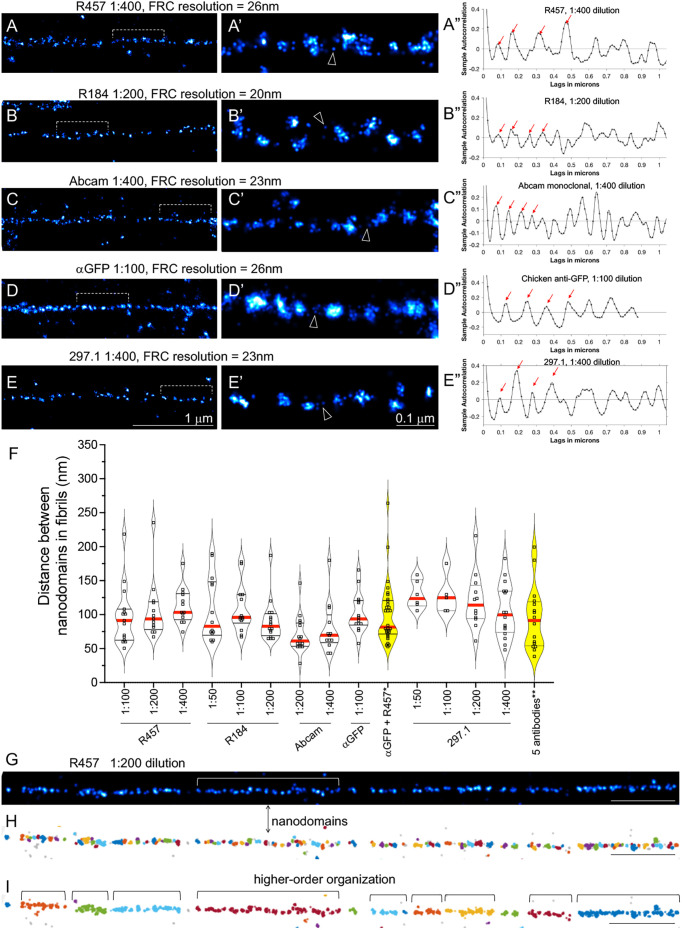
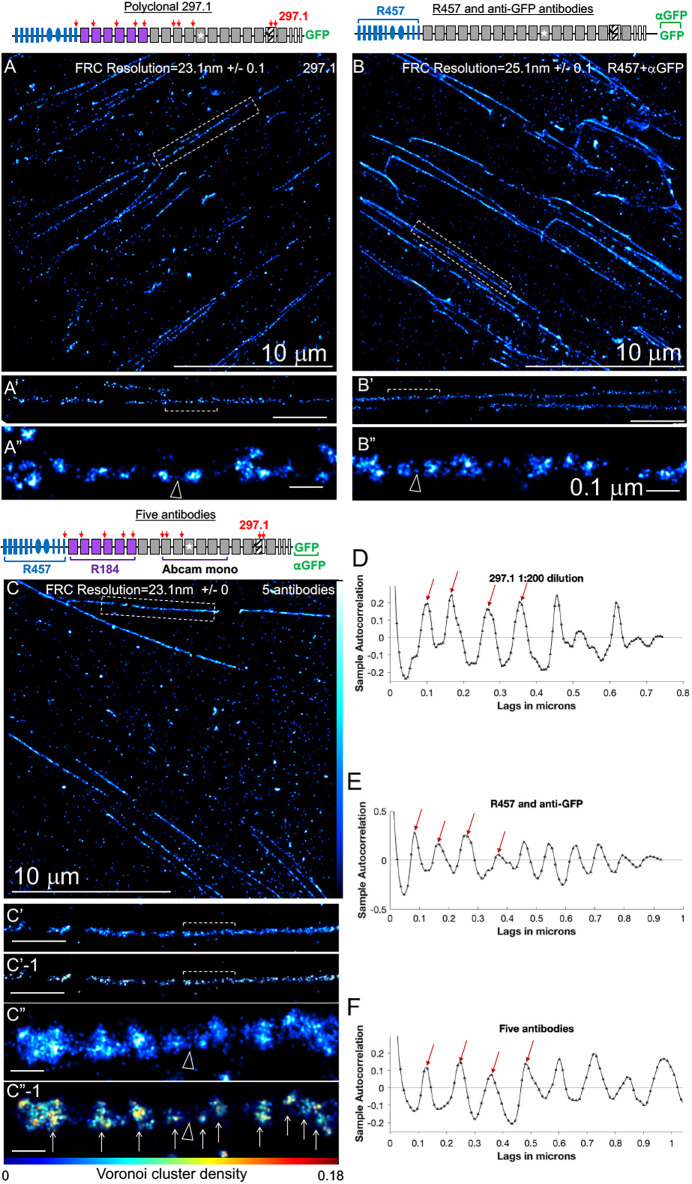
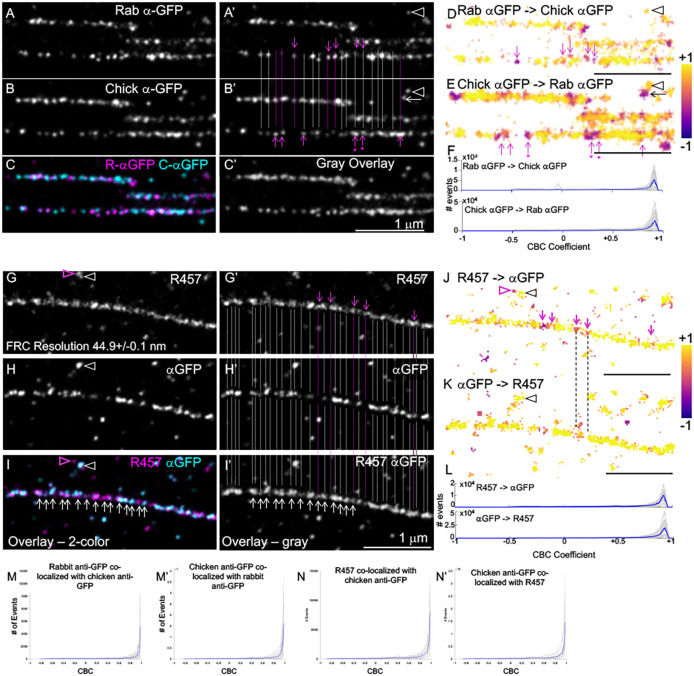
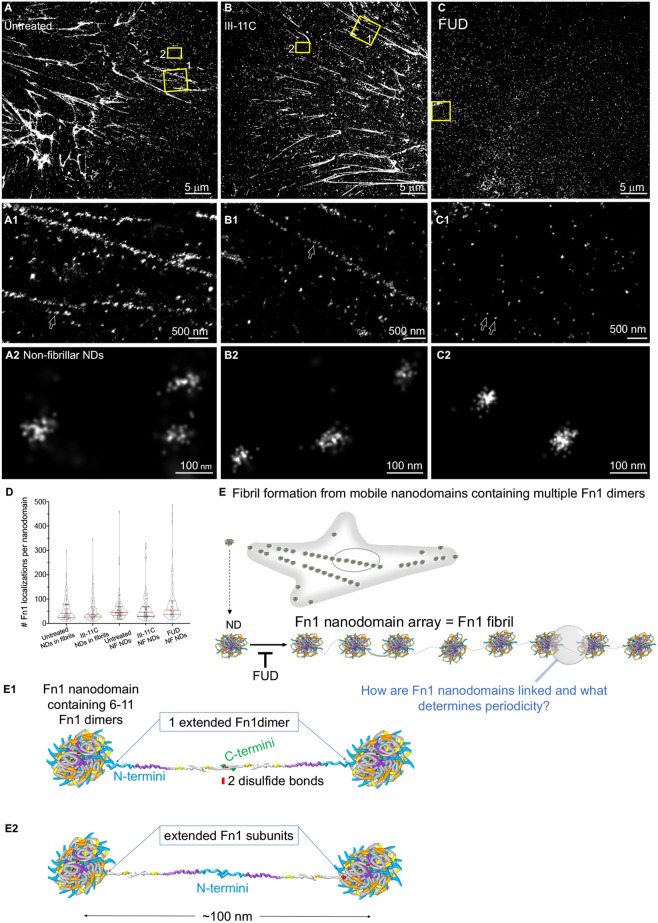
Fibronectin (Fn1) fibrils have long been viewed as continuous fibers composed of extended, periodically aligned Fn1 molecules. However, our live-imaging and single-molecule localization microscopy data are inconsistent with this traditional view and show that Fn1 fibrils are composed of roughly spherical nanodomains containing six to eleven Fn1 dimers. As they move toward the cell center, Fn1 nanodomains become organized into linear arrays, in which nanodomains are spaced with an average periodicity of 105±17 nm. Periodical Fn1 nanodomain arrays can be visualized between cells in culture and within tissues; they are resistant to deoxycholate treatment and retain nanodomain periodicity in the absence of cells. The nanodomain periodicity in fibrils remained constant when probed with antibodies recognizing distinct Fn1 epitopes or combinations of antibodies recognizing epitopes spanning the length of Fn1. Treatment with FUD, a peptide that binds the Fn1 N-terminus and disrupts Fn1 fibrillogenesis, blocked the organization of Fn1 nanodomains into periodical arrays. These studies establish a new paradigm of Fn1 fibrillogenesis. This article has an associated First Person interview with the first author of the paper.

Keywords: Fibril; Fibrillogenesis; Fibronectin; Live imaging; Super-resolution microscopy.


Conflict of interest statement

Competing interests The authors declare no competing or financial interests.

Figures

Fig. 1.
Fig. 1.
Beaded architecture of Fn1 fibrils in embryonic ECM. (A,A1,B) Wild-type E9.5 mouse embryos were fixed and stained with a 1:300 dilution of the Abcam monoclonal antibody to Fn1 (white) and DAPI (blue) and imaged using a 100× oil objective, with NA 1.49, pinhole 0.8 and a sampling rate of 40 nm/pixel. The sagittal optical section through the first pharyngeal arch (A,A1) and the cardiac jelly (B) are shown. Large arrowheads in A,A1 point to the ECM at the ectoderm-mesenchyme boundary of the first pharyngeal arch. The dotted box in A is magnified in A1 to show Fn1 microarchitecture. The arrow in A1 points to a beaded Fn1 fibril within the first arch mesenchyme. The arrow in B indicates the beaded architecture of Fn1 fibrils in cardiac jelly. (C) Intensity profile plot of an Fn1 fibril. a.u., arbitrary units. Note that at least 1:400 dilutions of this antibody are saturating (see below and Fig. 5F). Images are representative of three independent experiments. Scale bars: 5 μm (A); 2 μm (A1,B).
Fig. 2.
Fig. 2.
Integrin α5 and Fn1 co-localize in beaded adhesions. Wild-type MEFs were cultured for 16 h on glass coverslips without coating, fixed and stained with the Abcam monoclonal Fn1 antibody (cyan) and anti-integrin α5 (Itga5) antibody (magenta). Cells were imaged at the critical angle of incidence using a 100× oil objective, with NA 1.49. (A–A2) Representative images of the cell periphery. Arrows in A–A2 point to examples of non-fibrillar Fn1 adhesions. (B–B2) Representative images of the medial portion of a cell containing beaded fibrillar adhesions (arrows). Magnifications in all panels are the same. Images are representative of three experiments. Scale bar: 2 μm
Fig. 3.
Fig. 3.
Standardized SMLM imaging results in high resolution and high effective labeling efficiency. NUP96mEGFP/mEGFP homozygous knock-in U2OS cells (A–C) and Fn1mEGFP/mEGFP homozygous knock-in MEFs (D–F) were analyzed using SMLM imaging protocol I (see Materials and Methods). The boxed regions in A,D are shown in B,E, respectively, and the boxed regions in B,E are shown in C,F, respectively. The resolution in C and F measured by the Fourier ring curve method are 18.3±6.7 nm and 14.5±1.1 nm, respectively. The nanodomain architecture of Fn1–mEGFP fibrils is shown in subsequent magnifications of the fibril boxed in D. Arrows in F point to Fn1 nanodomains. N1 is the number of grouped localizations in each panel. The vertical bar in F shows color coding according to localization density for all panels. Images are representative of three independent experiments. Scale bars: 1 μm (A,B,D,E); 100 nm (C,F).
Fig. 4.
Fig. 4.
Nanodomain architecture of Fn1 fibrils detected with four different antibodies. Fn1mEGFP/mEGFP MEFs were plated on glass coverslips without coating, cultured overnight and stained with the following antibodies: (A) R457 (1:200 dilution); (B) R184 (1:100 dilution); (C) Abcam monoclonal antibody (1:200 dilution); and (D) anti-GFP antibody (1:100 dilution). Boxed regions in A–D are magnified to show fibrils in A1–D1, and bracketed regions in A1–D1 are magnified in A2-D2. Fourier ring correlation (FRC) was used to determine image resolution. The vertical bar in D shows color coding according to localization density for all panels in this figure. Cells were imaged using SMLM imaging protocol I. Arrowheads point to examples of sparse Fn1 localizations between nanodomains. Images are representative of three independent experiments. Scale bars: 10 μm (A–D); 1 μm (A1–D1); 100 nm (A2–D2).
Fig. 5.
Fig. 5.
Periodical labeling of Fn1 fibrils by multiple antibodies, their dilutions and combinations. (A–E) Fn1mEGFP/mEGFP MEFs were plated on glass coverslips without coating, cultured overnight and stained with the indicated antibodies. Cells were imaged using SMLM imaging protocol I. Bracketed regions in A–E are magnified in A′–E′. Arrowheads point to examples of sparse Fn1 localizations between nanodomains. Fourier ring correlation (FRC) was used to determine image resolution. (A″–E″) Autocorrelation traces for fibrils shown in A–E. Plots were truncated at 1 µm for clarity. Ljung–Box Q test for autocorrelation at the peak positions marked by the red arrows resulted in h=1 and p=0, where h is the null hypothesis that the first 4 autocorrelations are jointly zero. h=1 rejects this hypothesis and p is the probability that the null hypothesis is correct, indicating strong evidence of autocorrelation at least up to the fourth peak. (F) Summary of autocorrelation analyses, shown as violin plots of the distances between nanodomains in fibrils. Red lines indicate the median and black dotted lines indicate the quartiles. Plots of data from stainings with combinations of antibodies are highlighted in yellow. One-way ANOVA with Tukey's correction for multiple testing showed no significant differences among the means. *Anti-GFP and R457 antibodies were both used at 1:100 dilution. **The five antibodies used against Fn1–mEGFP and their dilutions were as follows: R457 (1:400), R184 (1:200), Abcam (1:400), anti-GFP (1:100) and 297.1 (1:400). (G–I) Clustering using DBSCAN. The fibril in G was analyzed by DBSCAN in H and I. The minimum number of points per neighborhood (k) was set to 4. (H) The radius of the neighborhood ε was set to 14 nm (Table S2). Adjacent clusters are labeled with different colors. (I) ε was estimated automatically by the DBSCAN algorithm. Images are representative of fibrils from at least three independent experiments. Scale bars: 1 μm (A–E, G–I); 0.1 μm (A′–E′).
Fig. 6.
Fig. 6.
Polyclonal antibody to full-length Fn1 and combinations of antibodies recognizing epitopes along the length of Fn1 reveal periodical nanodomain architecture of Fn1 fibrils. Fn1mEGFP/mEGFP MEFs were plated on glass coverslips without coating, cultured overnight and stained with the indicated antibodies. Cells were imaged using SMLM imaging protocol I. (A–C) Representative image of cells stained with the 297.1 antibody (1:200 dilution) (A); a combination of anti-GFP antibody (1:100) and R457 antibody (1:100) (B); and a combination of the five antibodies, R457 (1:400), R184 (1:200), Abcam (1:400), anti-GFP (1:100) and 297.1 (1:400) (C). These antibodies are depicted in the schematic above panel C, and red arrows mark their epitopes. Boxed fibrils in A–C are magnified in A′–C′, and bracketed regions in A′–C′ are magnified in A″–C″. The vertical bar in C shows color-coding according to localization density for A–C. C′-1 and C″-1 represent the same images in C′ and C″, respectively, but are color-coded according to Voronoi cluster density (horizontal bar below C″-1). Arrows in C″-1 indicate Voronoi tessellation clusters corresponding with nanodomains. Arrowheads in A″–C″ point to examples of sparse Fn1 localizations between nanodomains. (D–F) Autocorrelation analysis and Ljung–Box Q test for autocorrelation at the peak positions marked by the red arrows resulted in h=1 and P=0, indicating strong evidence for autocorrelation. h, the null hypothesis for this test, is that the first four autocorrelations are jointly zero. h=1 rejects this hypothesis. Images are representative of three independent experiments. Scale bars: 10 μm (A–C); 1 μm (A′–C′,C′-1); 0.1 μm (A″–C″,C″-1).
Fig. 7.
Fig. 7.
Double-color dSTORM shows that N- and C-termini of Fn1 overlap within Fn1 nanodomains. (A–C) Fn1 fibrils were detected in Fn1mEGFP/mEGFP cells plated on glass coverslips without coating using polyclonal rabbit and chicken anti-GFP antibodies. A′,B′ show the same images as in A,B with gray and pink lines marking overlapping and non-overlapping nanodomains, respectively. Pink dots under the pink arrows indicate nanodomains in which the signal in one channel is higher than in the other. C and C′ show the merged signals in color and grayscale, respectively. <100% overlap is expected as ELE<100%. (D,E) Co-distribution of localizations in one channel with those in another channel (e.g. Rab αGFP with chick αGFP in D) is color-coded according to the coordinate-based co-localization (CBC) coefficient; (Rmax=300, r=30). +1 indicates complete overlap; 0 indicates no overlap. Pink arrows in D,E correspond to those in A′,B′. Arrowheads in A′,B′,D,E indicate overlapping signals, and the arrow next to the arrowhead in B′ and E indicates adjacent non-overlapping signals. (F) CBC coefficients for 22 regions containing long fibrils (gray traces) and their average (blue trace). (G–I) Fn1 fibrils were detected in Fn1mEGFP/mEGFP cells plated on glass coverslips without coating using rabbit polyclonal R457 antibody and chicken anti-GFP antibody. G′–I′ show the same images as in G–I with overlapping (gray lines) and non-overlapping (pink lines and arrows) staining. I and I′ show the merged signals in color and grayscale, respectively. White arrows in I,I′ point to nanodomains. (J,K) Co-distribution of localizations in one channel with those in another channel (e.g. R457 with chick αGFP) is color-coded according to the CBC coefficient; (Rmax=300, r=30). Pink arrows shown in J correspond to those in G′. Pink arrowheads in G correspond to pink arrowheads in I and J, and point to non-overlapping nanodomains. White arrowheads in G, H correspond to black arrowheads in J, K and point to overlapping nanodomains. Note that settings for CBC analysis distinguish overlapping and non-overlapping localizations in adjacent nanodomains. (L) CBC coefficients for 20 long fibrils (gray traces) and their average (blue trace). (M,M′,N,N′) CBC using ThunderSTORM (Rmax=50 nm, r=5 nm) for 22 fibrils, four cells (M,M′) and 17 fibrils, four cells (N,N′). Images are representative of fibrils in six cells. Scale bars: 1 μm.
Fig. 8.
Fig. 8.
The N-terminal Fn1 assembly domain regulates the organization of Fn1 nanodomains into linear fibrillar arrays. Fn1mEGFP/+ MEFs were plated on glass and were either left untreated (A–A2) or incubated with the control III-11C peptide (B–B2) or the FUD peptide (C–C2). Cells were fixed, stained without permeabilization and imaged using SMLM protocol II. Boxes marked 1 and 2 in A,B are magnified in A1,B1 and in A2,B2, respectively. The box in C is magnified in C1 and C2. Arrows in A1,B1 point to Fn1 nanodomains (NDs) in fibrils. Arrows in C1 point to non-fibrillar (NF) nanodomains, which are magnified in C2. Images are representative of three independent experiments. Scale bars: 5 μm (A–C); 500 nm (A1–C1); 100 nm (A2–C2). (D) Quantification of grouped Fn1 localizations in nanodomains. Red lines mark medians, black lines indicate the quartiles. Differences are not statistically significant, determined by Kruskal–Wallis test with Dunn's correction for multiple testing. (E) Models of Fn1 fibril formation. (E1,E2) Nanodomain periodicity in fibrils might be due to an extended Fn1 dimer (E1) or Fn1 subunits (E2). Fn1 molecules are colored according to the scheme shown in Fig. S3D, mEGFP is marked in green, and C-terminal disulfide bonds in red.

Similar articles

Cited by

References

    1. Aguirre, K. M., McCormick, R. J. and Schwarzbauer, J. E. (1994). Fibronectin self-association is mediated by complementary sites within the amino-terminal one-third of the molecule. J. Biol. Chem. 269, 27863-27868. 10.1016/S0021-9258(18)46866-4 - DOI - PubMed
    1. Andronov, L., Lutz, Y., Vonesch, J.-L. and Klaholz, B. P. (2016a). SharpViSu: integrated analysis and segmentation of super-resolution microscopy data. Bioinformatics 32, 2239-2241. 10.1093/bioinformatics/btw123 - DOI - PMC - PubMed
    1. Andronov, L., Orlov, I., Lutz, Y., Vonesch, J.-L. and Klaholz, B. P. (2016b). ClusterViSu, a method for clustering of protein complexes by Voronoi tessellation in super-resolution microscopy. Sci. Rep. 6, 24084. 10.1038/srep24084 - DOI - PMC - PubMed
    1. Arai, Y., Yasuda, R., Akashi, K.-I., Harada, Y., Miyata, H., Kinosita, K., Jr and Itoh, H. (1999). Tying a molecular knot with optical tweezers. Nature 399, 446-448. 10.1038/20894 - DOI - PubMed
    1. Baumgart, F., Arnold, A. M., Leskovar, K., Staszek, K., Fölser, M., Weghuber, J., Stockinger, H. and Schütz, G. J. (2016). Varying label density allows artifact-free analysis of membrane-protein nanoclusters. Nat. Methods 13, 661-664. 10.1038/nmeth.3897 - DOI - PMC - PubMed

Publication types