. 2022 Nov;6(11):1545-1556.
doi: 10.1038/s41562-022-01410-x. Epub 2022 Jul 18.

Acoustic regularities in infant-directed speech and song across cultures

Affiliations

Acoustic regularities in infant-directed speech and song across cultures

Courtney B Hilton et al. Nat Hum Behav. 2022 Nov.

Abstract

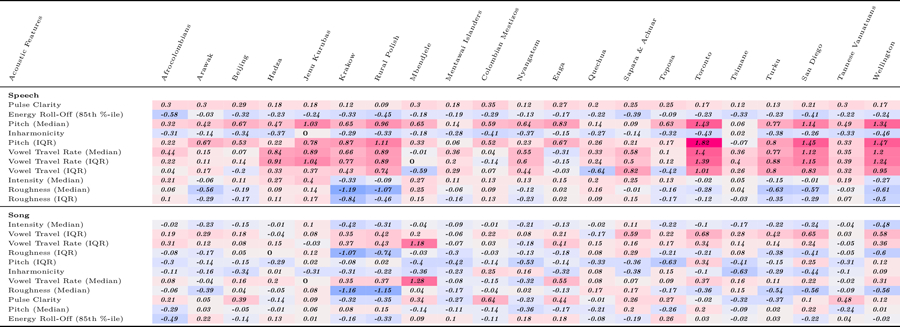
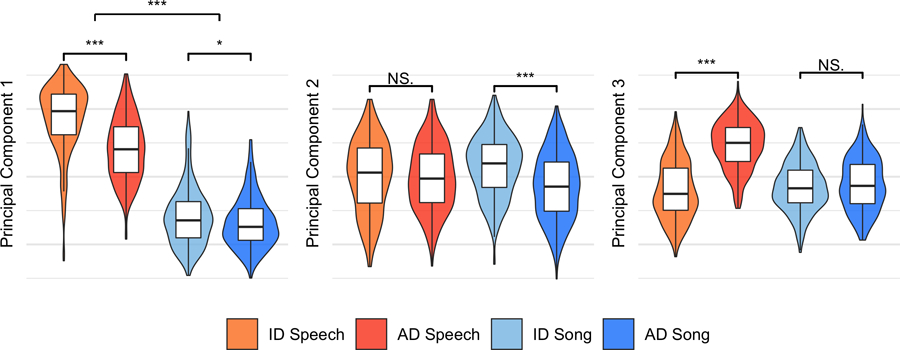
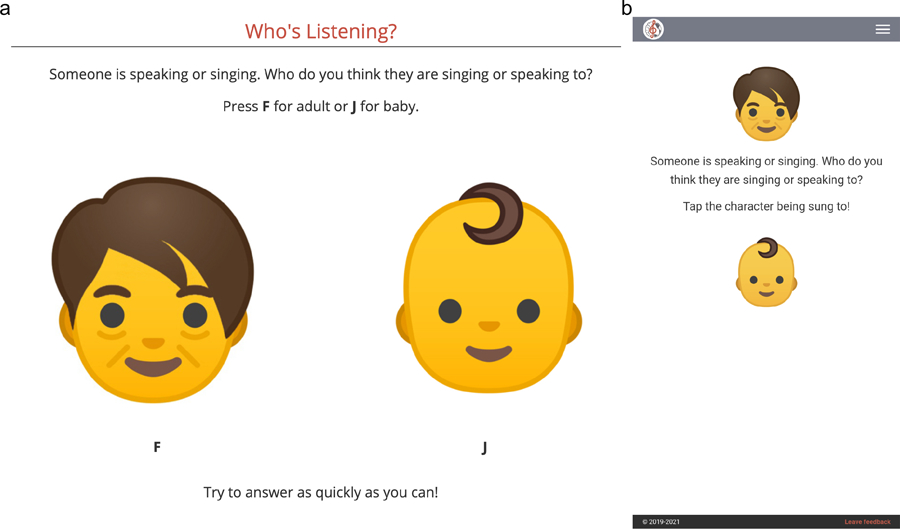
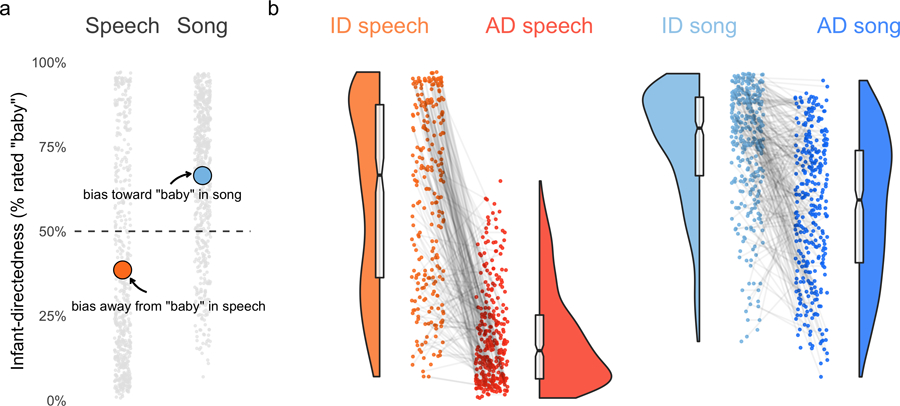
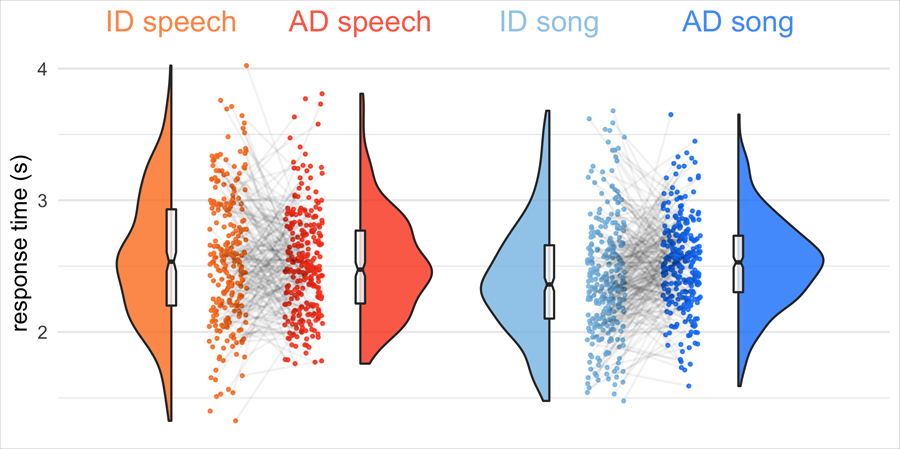
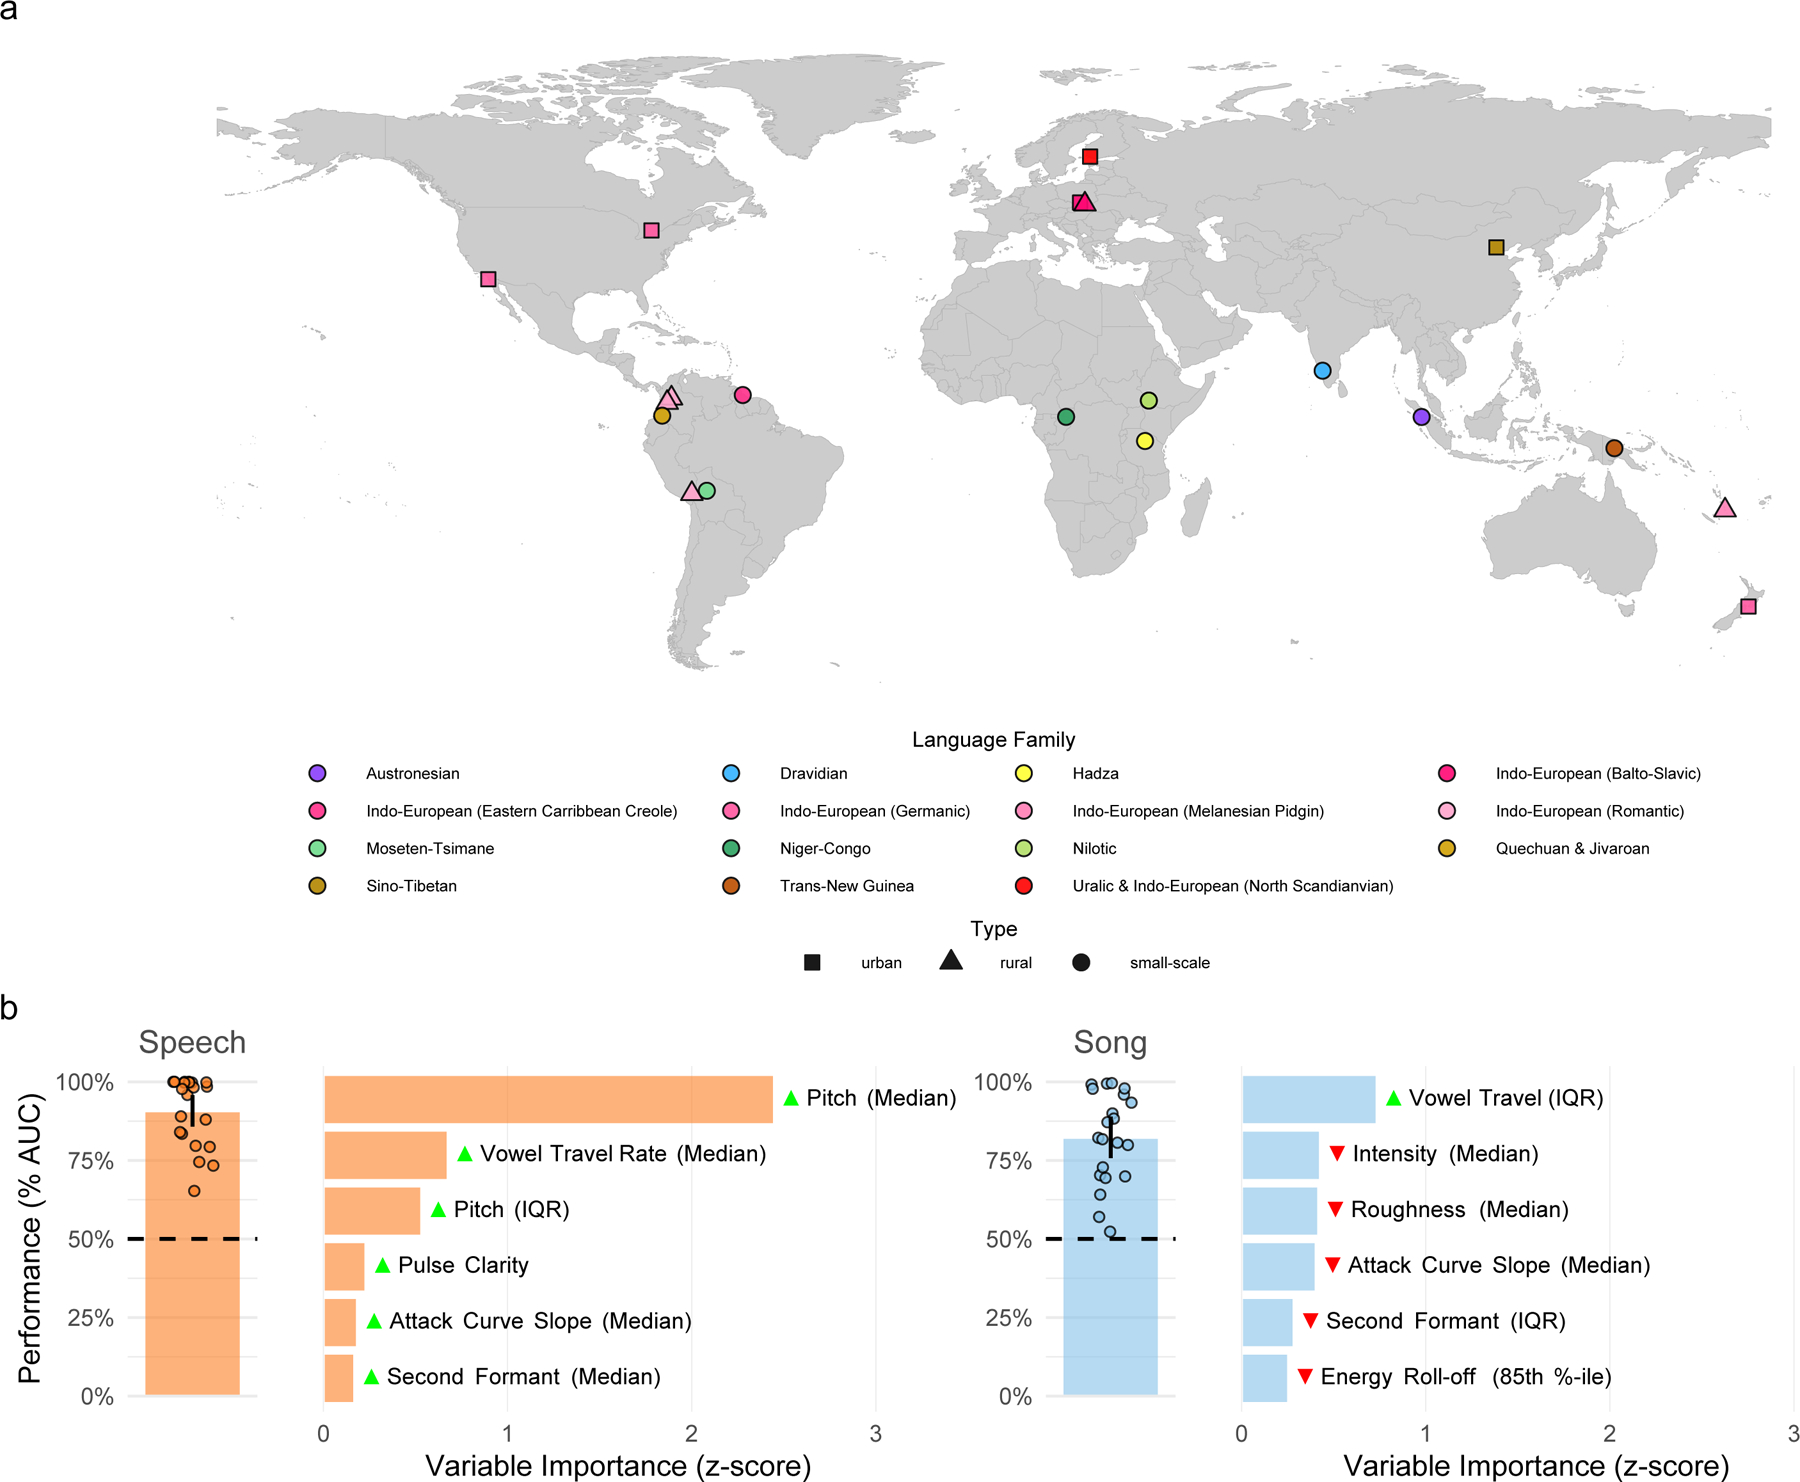
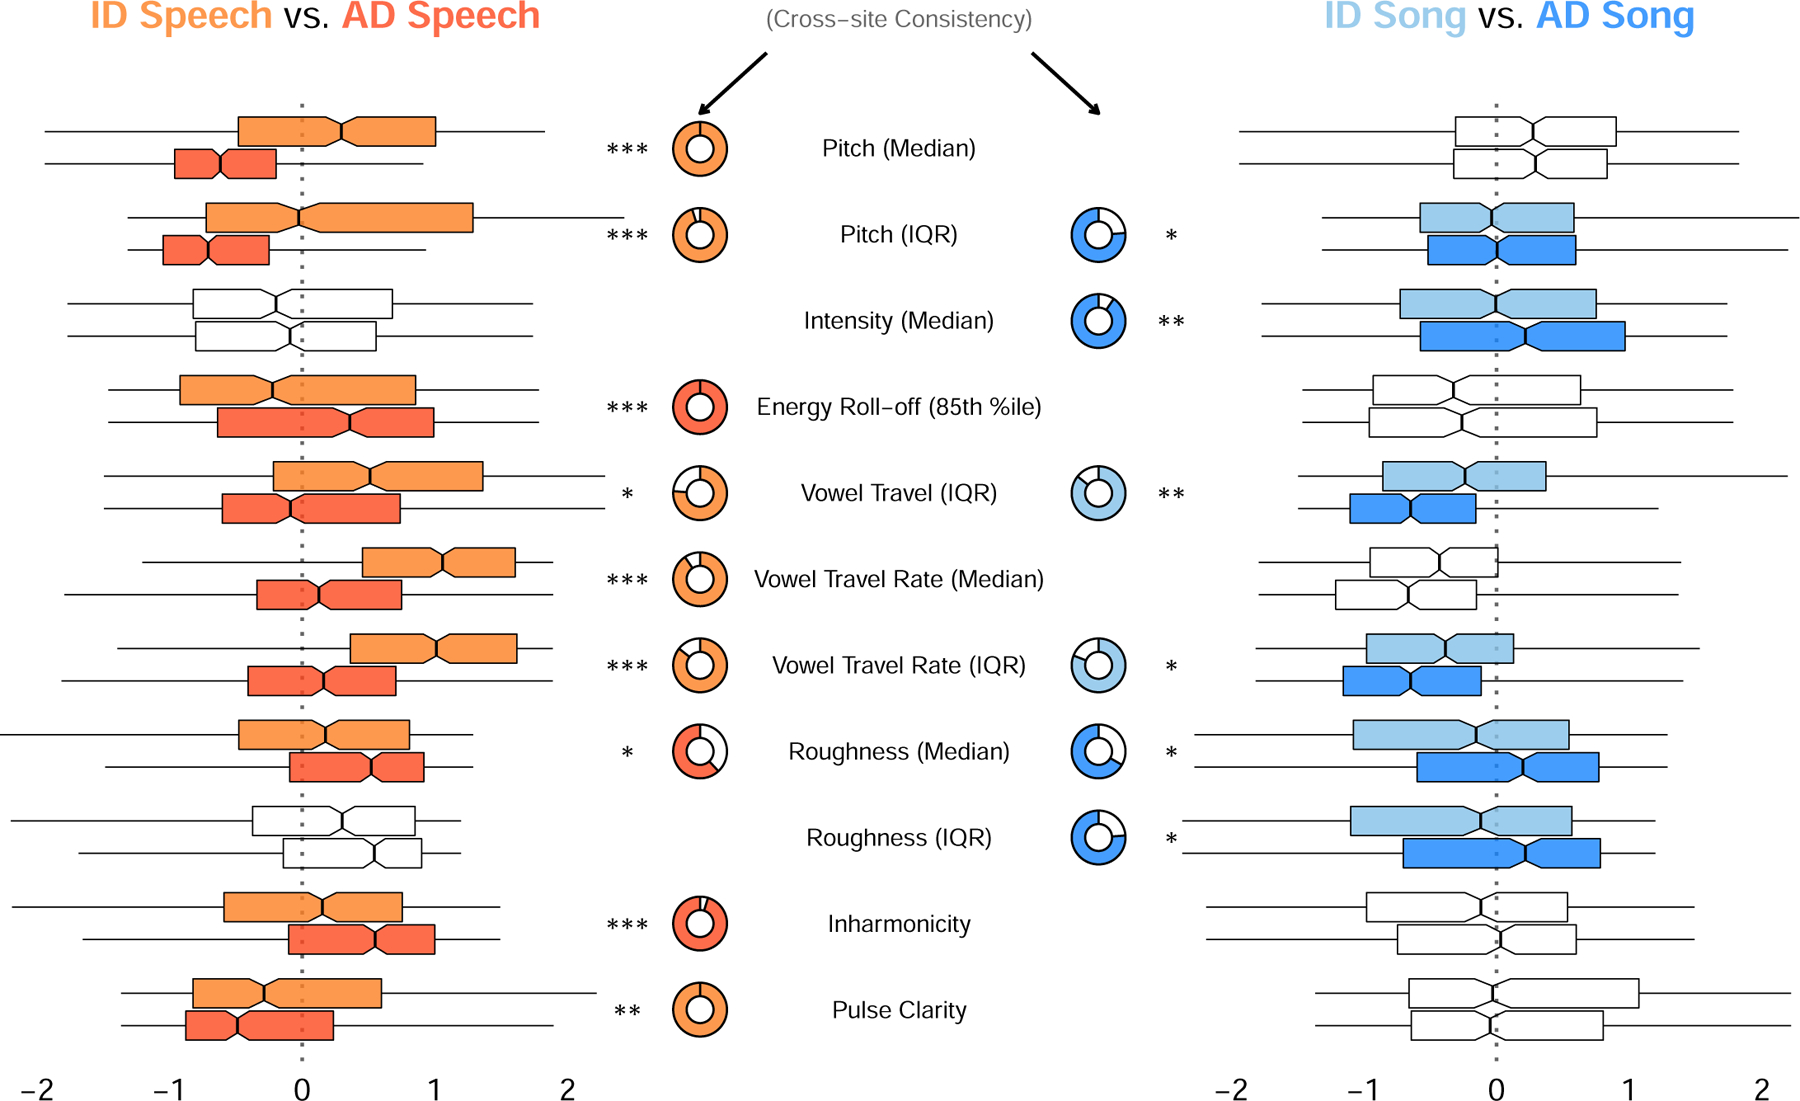
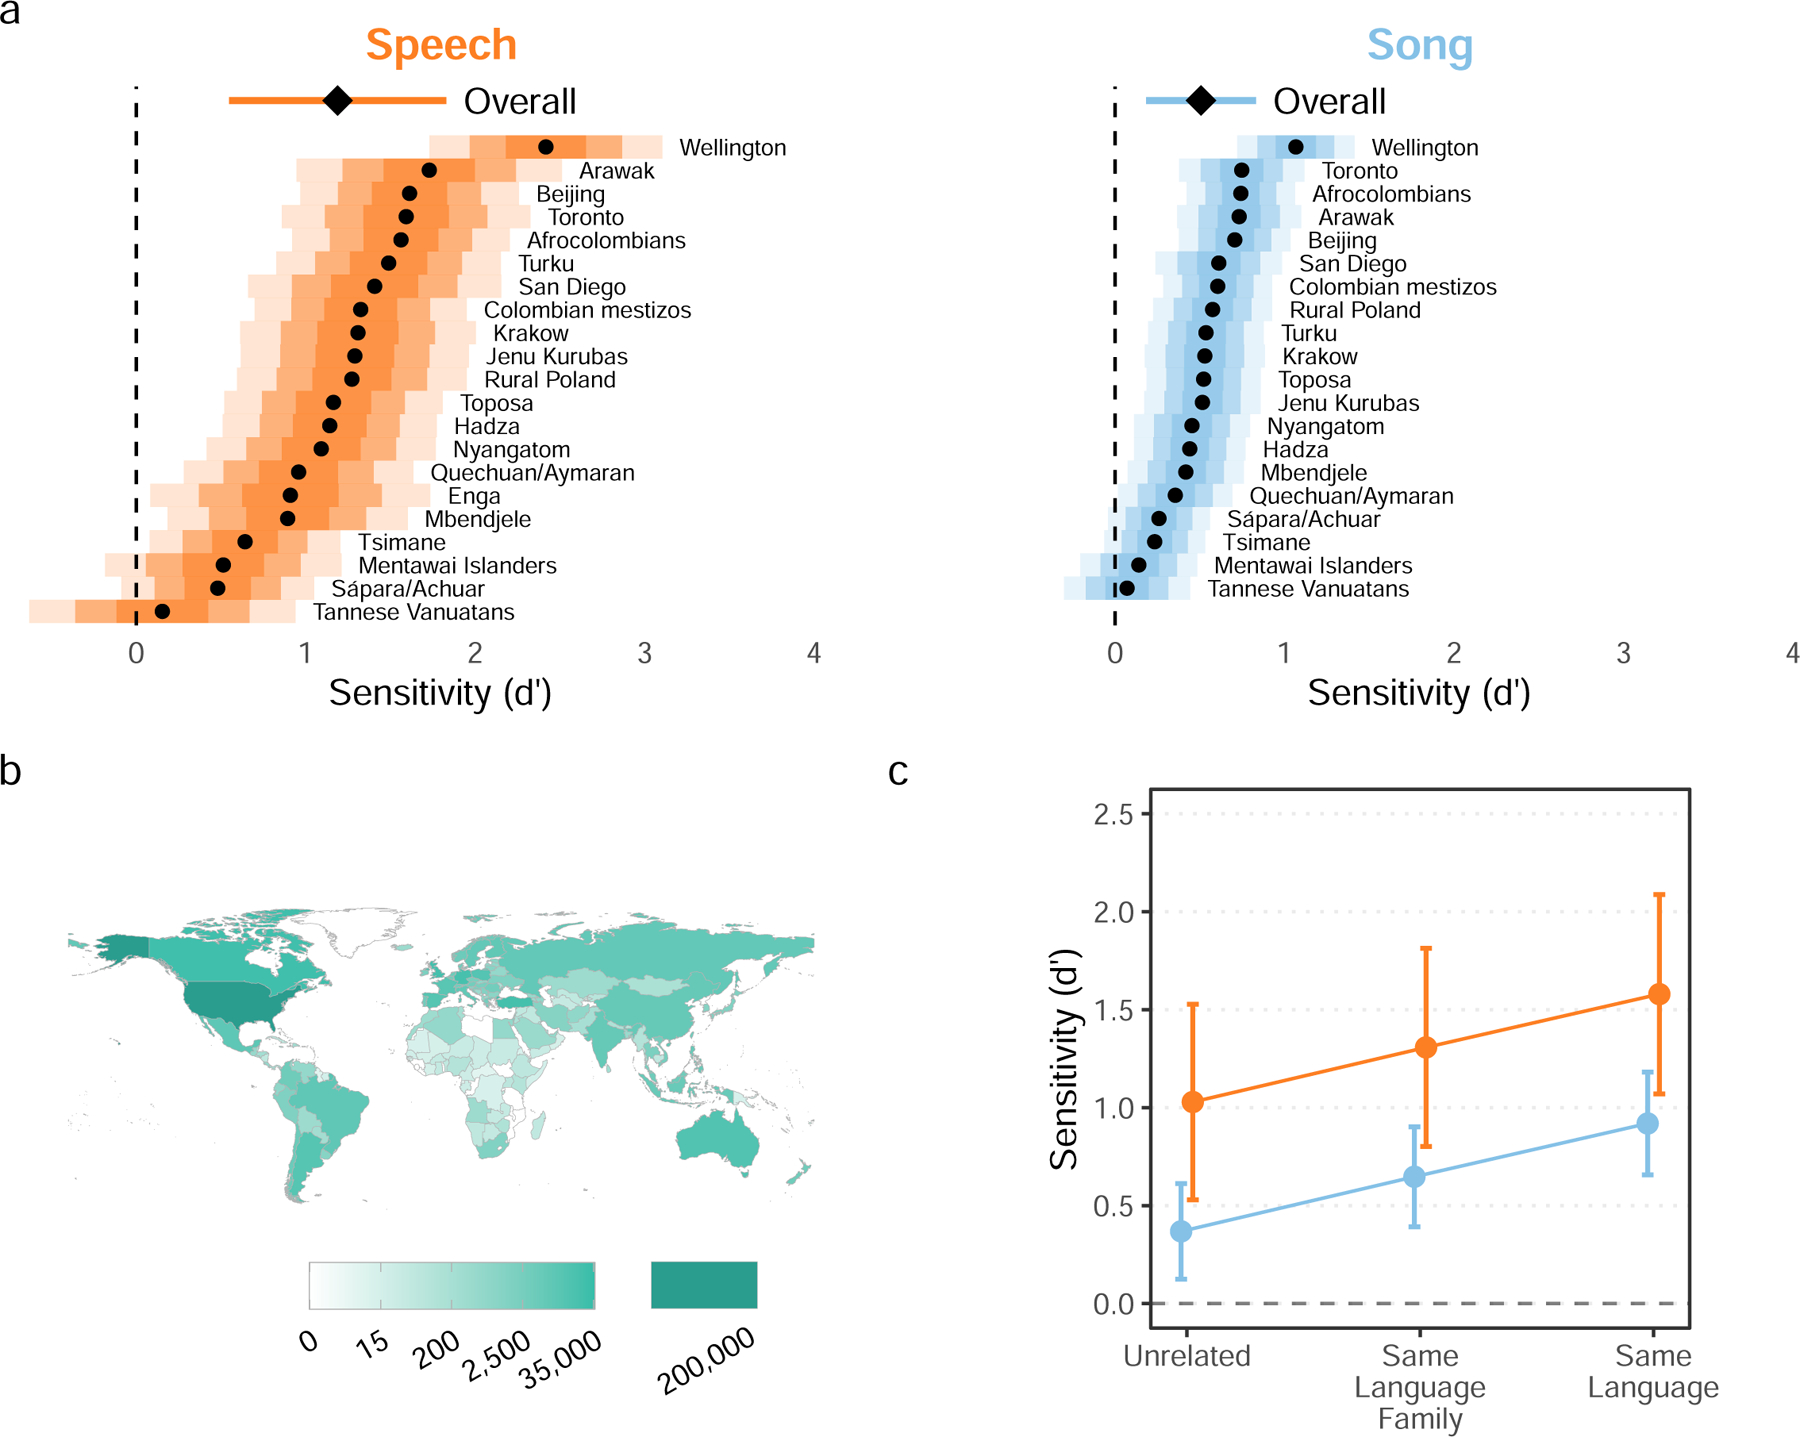
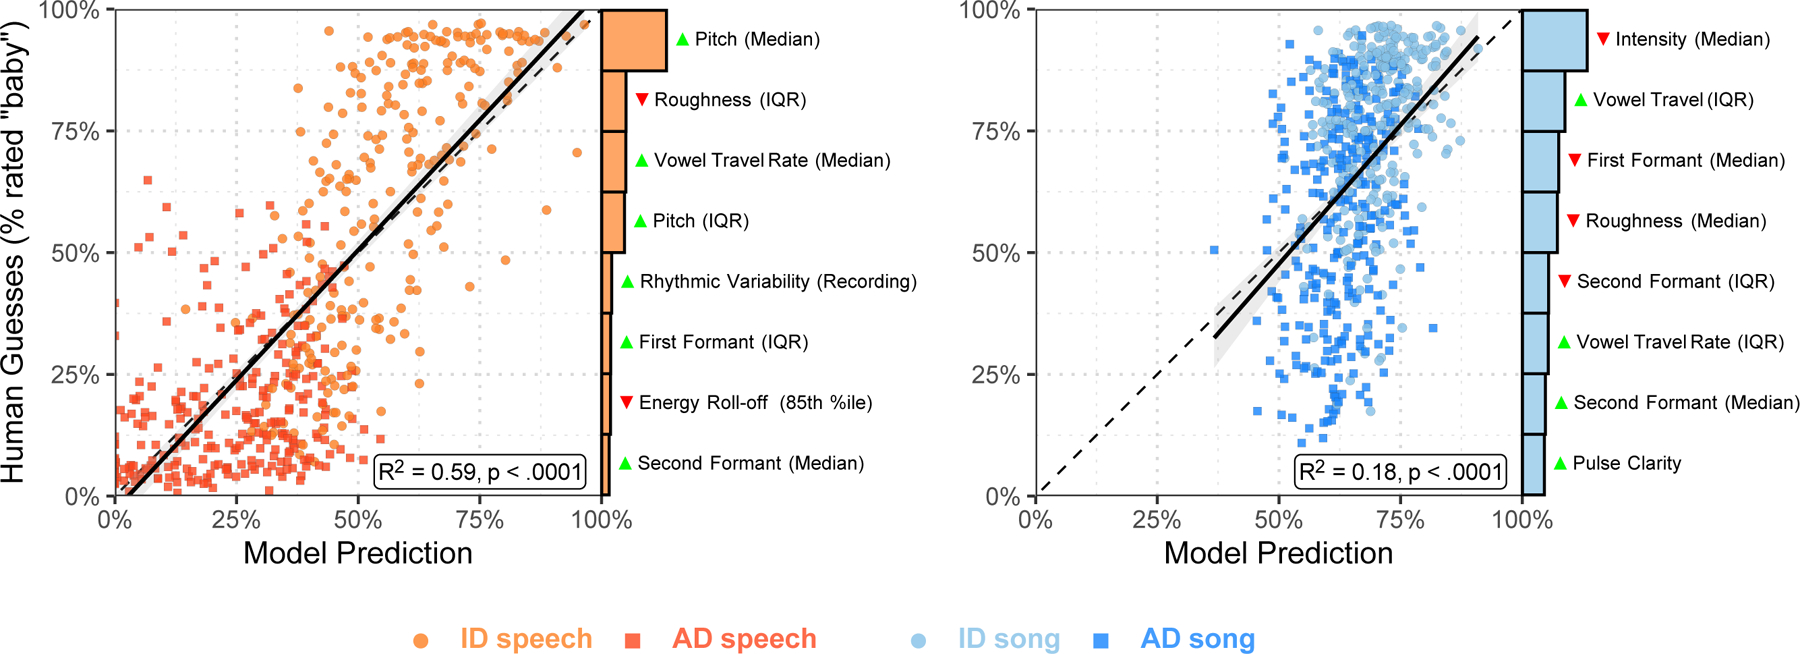
When interacting with infants, humans often alter their speech and song in ways thought to support communication. Theories of human child-rearing, informed by data on vocal signalling across species, predict that such alterations should appear globally. Here, we show acoustic differences between infant-directed and adult-directed vocalizations across cultures. We collected 1,615 recordings of infant- and adult-directed speech and song produced by 410 people in 21 urban, rural and small-scale societies. Infant-directedness was reliably classified from acoustic features only, with acoustic profiles of infant-directedness differing across language and music but in consistent fashions. We then studied listener sensitivity to these acoustic features. We played the recordings to 51,065 people from 187 countries, recruited via an English-language website, who guessed whether each vocalization was infant-directed. Their intuitions were more accurate than chance, predictable in part by common sets of acoustic features and robust to the effects of linguistic relatedness between vocalizer and listener. These findings inform hypotheses of the psychological functions and evolution of human communication.


Conflict of interest statement

Competing interests statement

The authors declare no competing interests.

Figures

Extended Data Fig. 1 |
Extended Data Fig. 1 |. Variation across societies of infant-directed alterations.
Estimated differences between infant-directed and adult-directed vocalizations, for acoustic feature, in each fieldsite (corresponding with the doughnut plots in Fig. 2). The estimates are derived from the random-effect components of the mixed-effects model reported in the main text. Cells of the table are shaded to facilitate the visibility of corpus-wide consistency (or inconsistency): redder cells represent features where infant-directed vocalizations have higher estimates than adult-directed vocalizations and bluer cells represent features with the reverse pattern. Within speech and song, acoustic features are ordered by their degree of cross-cultural regularity; some features showed the same direction of effect in all 21 societies (for example, for speech, median pitch and pitch variability), whereas others were more variable.
Extended Data Fig. 2 |
Extended Data Fig. 2 |. Principal-components analysis of acoustic features.
As an alternative approach to the acoustics data, we ran a principal-components analysis on the full 94 acoustic variables, to test whether an unsupervised method also yielded opposing trends in acoustic features across the different vocalization types. It did. The first three components explained 39% of total variability in the acoustic features. Moreover, the clearest differences between vocalization types accorded with the LASSO and mixed-effects modelling (Figs. 1b and 2). The first principal component most strongly differentiated speech and song, overall; the second most strongly differentiated infant-directed song from adult-directed song; and the third most strongly differentiated infant-directed speech from adult-directed speech. The violins indicate kernel density estimations and the boxplots represent the medians (centres), interquartile ranges (bounds of boxes) and 1.5xIQR (whiskers). Significance values are computed via two-sided Wilcoxon signed-rank tests (n = 1,570 recordings); *p < 0.05, **p < 0.01, ***p < 0.001. Feature loadings are in Supplementary Table 7.
Extended Data Fig. 3 |
Extended Data Fig. 3 |. Screenshots from the naive listener experiment.
On each trial, participants heard a randomly selected vocalization from the corpus and were asked to quickly guess to whom the vocalization was directed: an adult or a baby. The experiment used large emoji and was designed to display comparably on desktop computers (a) or tablets/smartphones (b).
Extended Data Fig. 4 |
Extended Data Fig. 4 |. Response biases in the naive listener experiment.
a, Listeners showed reliable biases: regardless of whether a vocalization was infant- or adult-directed, the listeners gave speech recordings substantially fewer “baby” responses than expected by chance, and gave song recordings substantially more “baby” responses. The grey points represent average ratings for each of the recordings in the corpus that were used in the experiment (after exclusions, n = 1,138 recordings from the corpus of 1,615), split by speech and song; the orange and blue points indicate the means of each vocalization type; and the horizontal dashed line represents hypothetical chance level of 50%. b, Despite the response biases, within speech and song, the raw data nevertheless showed clear differences between infant-directed and adult-directed vocalizations, that is, by comparing infant-directedness scores within the same voice, across infant-directed and adult-directed vocalizations (visible here in the steep negative slopes of the grey lines). The main text results report only d’ statistics for these data, for simplicity, but the main effects are nonetheless visible here in the raw data. The points indicate average ratings for each recording; the grey lines connecting the points indicate the pairs of vocalizations produced by the same voice; the half-violins are kernel density estimations; the boxplots represent the medians, interquartile ranges and 95% confidence intervals (indicated by the notches); and the horizontal dashed lines indicate the response bias levels (from a).
Extended Data Fig. 5 |
Extended Data Fig. 5 |. Response-time analysis of naive listener experiment.
We recorded the response times of participants in their mobile or desktop browsers, using jsPsych (see Methods), and asked whether, when responding correctly, participants more rapidly detected infant-directedness in speech or song. They did not: a mixed-effects regression predicting the difference in response time between infant-directed and adult-directed vocalizations (within speech or song), adjusting hierarchically for fieldsite and world region, yielded no significant differences (ps > .05 from two-sided linear combination tests; no adjustments made for multiple comparisons). The grey points represent average ratings for each of the recordings in the corpus that were used in the experiment (after exclusions, n = 1,138 recordings from the corpus of 1,615), split by speech and song; the grey lines connecting the points indicate the pairs of vocalizations produced by the same participant; the half-violins are kernel density estimations; and the boxplots represent the medians, interquartile ranges and 95% confidence intervals (indicated by the notches).
Fig. 1 |
Fig. 1 |. Cross-cultural regularities in infant-directed vocalizations.
a, We recorded examples of speech and song from 21 urban, rural, or small-scale societies, in many languages. The map indicates the approximate locations of each society and is color-coded by the language family or sub-group represented by the society. b, Machine-learning classification demonstrates the stereotyped acoustics of infant-directed speech and song. We trained two least absolute shrinkage and selection operator (LASSO) models, one for speech and one for song, to classify whether recordings were infant-directed or adult-directed on the basis of their acoustic features. These predictors were regularized using fieldsite-wise cross-validation, such that the model optimally classified infant-directedness across all 21 societies studied. The vertical bars represent the mean classification performance across societies (n = 21 societies for both speech and song; quantified via receiver operating characteristic/area under the curve; AUC); the error bars represent 95% confidence intervals of the mean; the points represent the performance estimate for each fieldsite; and the horizontal dashed lines indicate chance level of 50% AUC. The horizontal bars show the six acoustic features with the largest influence in each classifier; the green and red triangles indicate the direction of the effect, e.g., with median pitch having a large, positive effect on classification of infant-directed speech. The full results of the variable selection procedure are in Supplementary Table 2, with further details in Methods.
Fig. 2 |
Fig. 2 |. How people alter their voices when vocalizing to infants.
Eleven acoustic features had a statistically significant difference between infant-directed and adult-directed vocalizations, within-voices, in speech, song, or both. Consistent with the LASSO results (Fig. 1b and Supplementary Table 2), the acoustic features operated differently across speech and song. For example, median pitch was far higher in infant-directed speech than in adult-directed speech, whereas median pitch was comparable across both forms of song. Some features were highly consistent across fieldsites (e.g., lower inharmonicity in infant-directed speech than adult-directed speech), whereas others were more variable (e.g., lower roughness in infant-directed speech than adult-directed speech). The boxplots, which are ordered approximately from largest to smallest differences between effects across speech and song, represent each acoustic feature’s median (vertical black lines) and interquartile range (boxes); the whiskers indicate 1.5 × IQR; the notches represent the 95% confidence intervals of the medians; and the doughnut plots represent the proportion of fieldsites where the main effect repeated, based on estimates of fieldsite-wise random effects. Only comparisons that survived an exploratory-confirmatory analysis procedure are plotted; faded comparisons did not reach significance in confirmatory analyses. Significance values are computed via linear combinations with two-sided tests, following multi-level mixed-effects models (n = 1,570 recordings); *p < 0.05, **p < 0.01, ***p < 0.001; no adjustments made for multiple-comparisons due to the exploratory-confirmatory approach taken. Regression results are in Supplementary Table 3 and full reporting of fieldsite-level estimates is in Supplementary Table 5. Note: the model estimates are normalized jointly on speech and song data so as to enable comparisons across speech and song for each feature; as such, the absolute distance from 0 for a given feature is not directly interpretable, but estimates are directly comparable across speech and song.
Fig. 3 |
Fig. 3 |. Naïve listeners distinguish infant-directed vocalizations from adult-directed vocalizations across cultures.
Participants listened to vocalizations drawn at random from the corpus, viewing the prompt “Someone is speaking or singing. Who do you think they are singing or speaking to?” They could respond with either “adult” or “baby” (Extended Data Fig. 3). From these ratings (after exclusion n = 473 song recordings; n = 394 speech recordings), we computed listener sensitivity (d′). a, Listeners reliably detected infant-directedness in both speech and song, overall (indicated by the diamonds, with 95% confidence intervals indicated by the horizontal lines), and across many fieldsites (indicated by the black dots), although the strength of the fieldsite-wise effects varied substantially (see the distance between the vertical dashed line and the black dots; the shaded regions represent 50%, 80%, and 95% confidence intervals, in increasing order of lightness). Note that one fieldsite-wise d′ could not be estimated for song; complete statistical reporting is in Supplementary Table 5. b, The participants in the citizen-science experiment hailed from many countries; the gradients indicate the total number of vocalization ratings gathered from each country. c, The main effects held across different combinations of the linguistic backgrounds of vocalizer and listener. We split all trials from the main experiment into three groups: those where a language the listener spoke fluently was the same as the language of the vocalization (n = 82,094; those where a language the listener spoke fluently was in the same major language family as the language of the vocalization (n = 110,664), and those with neither type of relation (n = 285,378). The plot shows the estimated marginal effects of a mixed-effects model predicting d′ values across language and music examples, after adjusting for fieldsite-level effects. The error bars represent 95% confidence-intervals of the mean. In all three cases, the main effects replicated; increases in linguistic relatedness corresponded with increases in sensitivity.
Fig. 4 |
Fig. 4 |. Human inferences about infant-directedness are predictable from acoustic features of vocalizations.
To examine the degree to which human inferences were linked to the acoustic forms of the vocalizations, we trained two LASSO models to predict the proportion of “baby” responses for each non-confounded recording from the human listeners. While both models explained substantial variability in human responses, the model for speech was more accurate than the model for song, in part because the human listeners erroneously relied on acoustic features for their predictions in song that less reliably characterized infant-directed song across cultures (see Figs. 1b and 2). Each point represents a recorded vocalization (after exclusions n = 528 speech recordings; n = 587 song recordings), plotted in terms of the model’s estimated infant-directedness of the model and the average “infant-directed” rating from the naïve listeners; the barplots depict the relative explanatory power of the top 8 acoustical features in each LASSO model, showing which features were most strongly associated with human inferences (the green or red triangles indicate the directions of effects, with green higher in infant-directed vocalizations and red lower); the dotted diagonal lines represent a hypothetical perfect match between model predictions and human guesses; the solid black lines depict linear regressions (speech: F(1,526) = 773, R2 = 0.59; song: F(1, 585) = 126, R2 = 0.18; ps < .0001; p-values computed using robust standard errors); and the grey ribbons represent the standard errors of the mean, from the regressions.

References

    1. Morton ES On the occurrence and significance of motivation-structural rules in some bird and mammal sounds. The American Naturalist 111, 855–869 (1977).
    1. Endler JA Some general comments on the evolution and design of animal communication systems. Philosophical Transactions of the Royal Society B: Biological Sciences 340, 215–225 (1993). - PubMed
    1. Owren MJ & Rendall D Sound on the rebound: Bringing form and function back to the forefront in understanding nonhuman primate vocal signaling. Evolutionary Anthropology 10, 58–71 (2001).
    1. Fitch WT, Neubauer J & Herzel H Calls out of chaos: The adaptive significance of nonlinear phenomena in mammalian vocal production. Animal Behaviour 63, 407–418 (2002).
    1. Wiley RH The evolution of communication: Information and manipulation. Animal Behaviour 2, 156–189 (1983).

Publication types