. 2022 Aug;7(8):1151-1160.
doi: 10.1038/s41564-022-01185-x. Epub 2022 Jul 18.

Early detection and surveillance of SARS-CoV-2 genomic variants in wastewater using COJAC

Affiliations

Early detection and surveillance of SARS-CoV-2 genomic variants in wastewater using COJAC

Katharina Jahn et al. Nat Microbiol. 2022 Aug.

Abstract

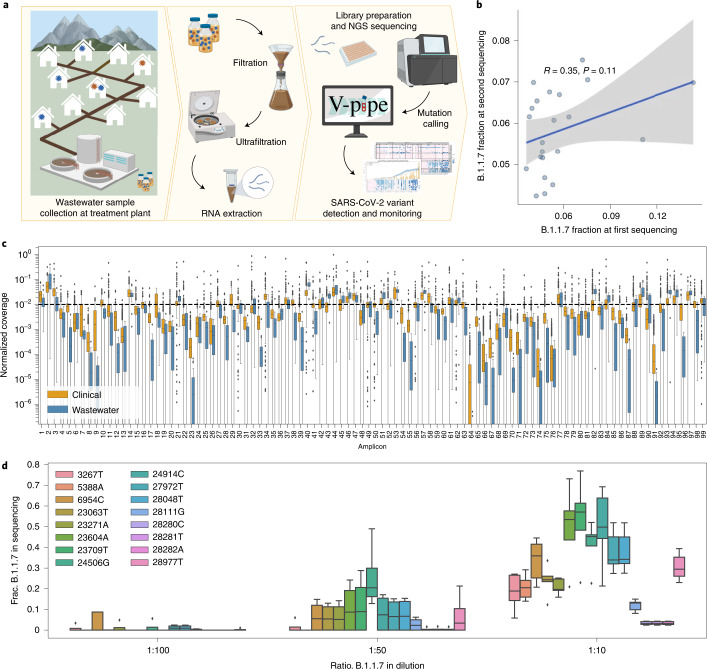
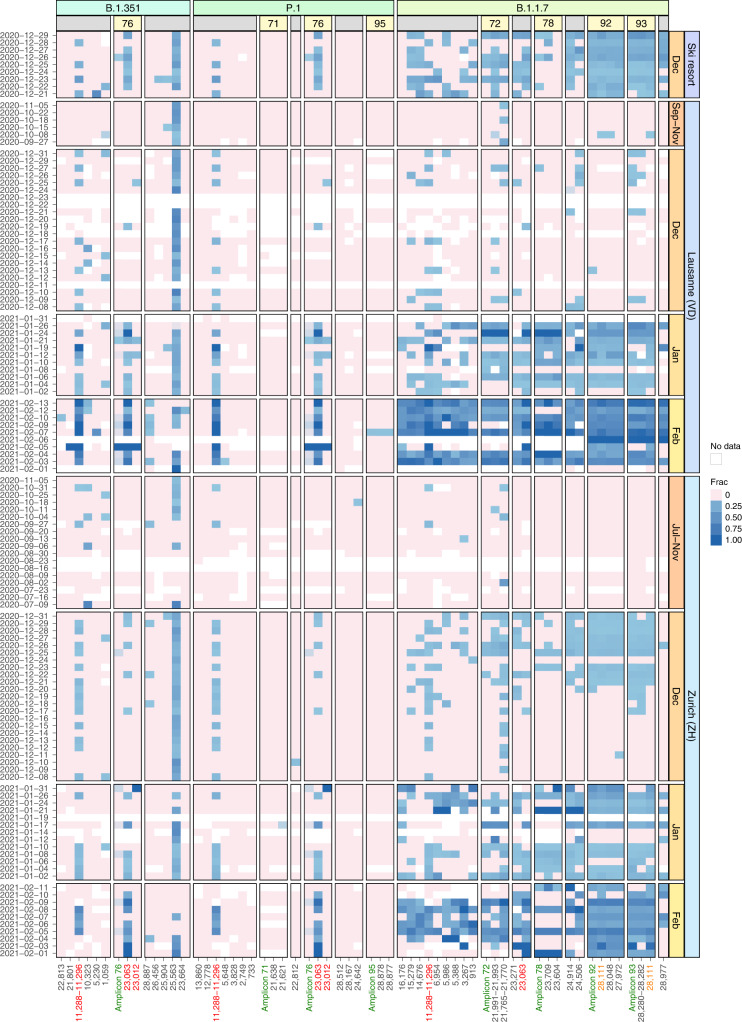
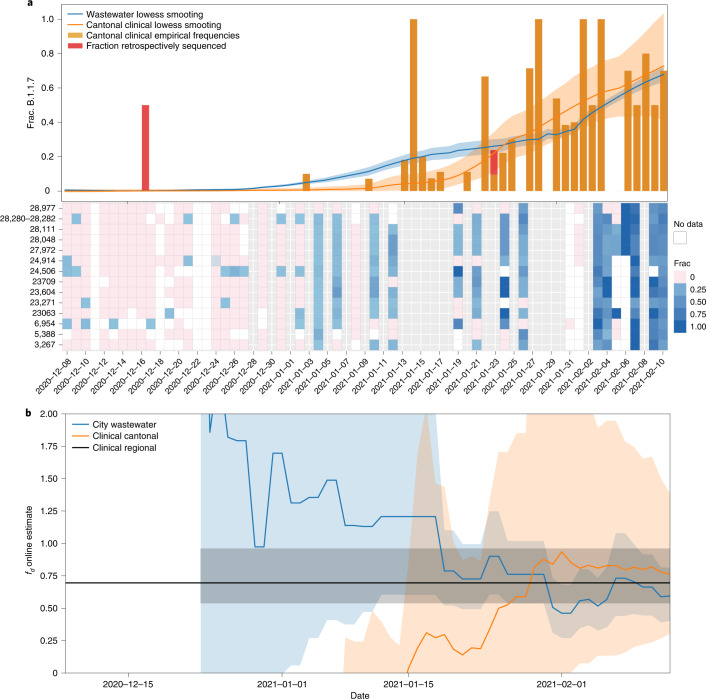
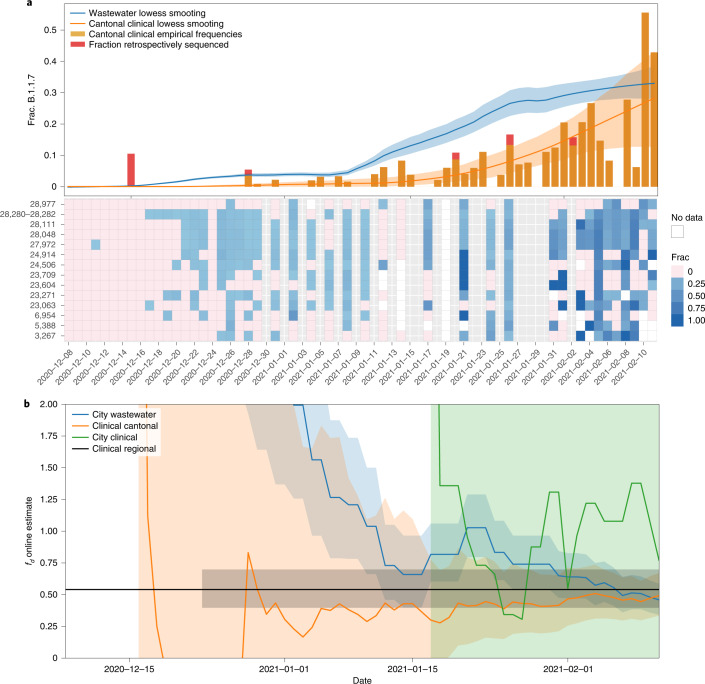
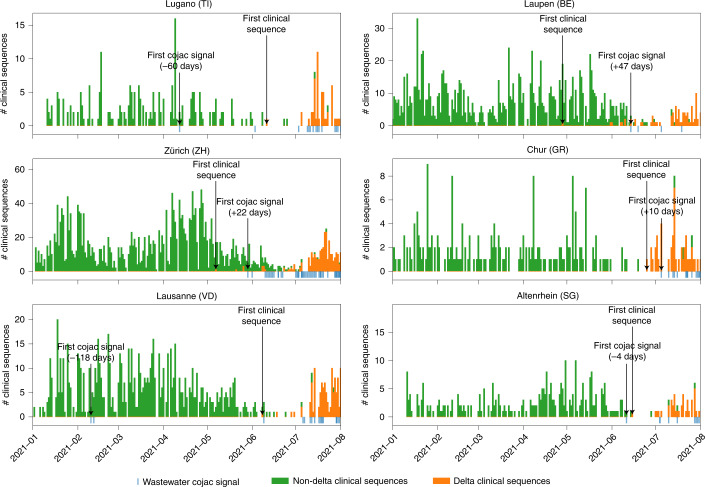
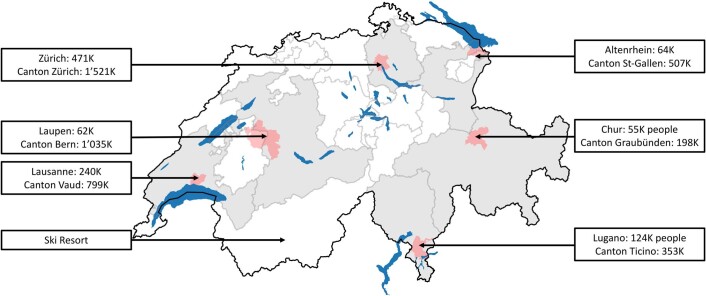
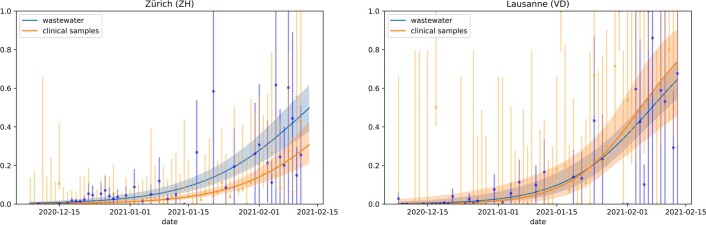
The continuing emergence of SARS-CoV-2 variants of concern and variants of interest emphasizes the need for early detection and epidemiological surveillance of novel variants. We used genomic sequencing of 122 wastewater samples from three locations in Switzerland to monitor the local spread of B.1.1.7 (Alpha), B.1.351 (Beta) and P.1 (Gamma) variants of SARS-CoV-2 at a population level. We devised a bioinformatics method named COJAC (Co-Occurrence adJusted Analysis and Calling) that uses read pairs carrying multiple variant-specific signature mutations as a robust indicator of low-frequency variants. Application of COJAC revealed that a local outbreak of the Alpha variant in two Swiss cities was observable in wastewater up to 13 d before being first reported in clinical samples. We further confirmed the ability of COJAC to detect emerging variants early for the Delta variant by analysing an additional 1,339 wastewater samples. While sequencing data of single wastewater samples provide limited precision for the quantification of relative prevalence of a variant, we show that replicate and close-meshed longitudinal sequencing allow for robust estimation not only of the local prevalence but also of the transmission fitness advantage of any variant. We conclude that genomic sequencing and our computational analysis can provide population-level estimates of prevalence and fitness of emerging variants from wastewater samples earlier and on the basis of substantially fewer samples than from clinical samples. Our framework is being routinely used in large national projects in Switzerland and the UK.


Conflict of interest statement

The authors declare no competing interests.

Figures

Fig. 1
Fig. 1. Method overview and quality control.
a, Overview of the wastewater sampling campaign. Left: collection of raw wastewater samples containing a mixture of wild-type and variant SARS-CoV-2 viral RNA. Middle: viral concentration and nucleic acid extraction. Right: amplification using ARTIC v3 primers, library preparation, NGS and mutation calling using V-pipe, followed by statistical analysis to detect and quantify the presence of SARS-CoV-2 variants and estimate epidemiological parameters. Created with BioRender.com. b, Reproducibility of Alpha (B.1.1.7) prevalence based on resequencing of 25 samples. Each dot shows the average fraction of Alpha-compatible reads across all signature mutations. Pearson correlation coefficient, R, and P value (two-sided test) indicate a high degree of variability in Alpha prevalence estimates at low frequencies. The solid line denotes the estimate from the linear model and the shaded area denotes the 95% confidence interval. c, Per-amplicon normalized coverage distributions after quality filtering and alignment in the same NGS batch containing both 589 clinical (orange) and 22 wastewater (blue) samples. Per-amplicon absolute coverages can be found in Supplementary Fig. 1. d, Reproducibility of Alpha (B.1.1.7) prevalence in a dilution series experiment. Boxplots represent fractions of substitutions called in 5 technical replicates of wastewater spiked with SARS-CoV-2 RNA at 3 different Alpha-to-wild-type ratios. In both c and d, boxes show quartiles and the whiskers extend to a maximum of 1.5× the interquartile range, after which points are considered outliers. Source data
Fig. 2
Fig. 2. Longitudinal surveillance of Alpha (B.1.1.7), Beta (B.1.351) and Gamma (P.1) signature mutations in wastewater samples collected at three Swiss WWTPs.
Blue color shading encodes the observed fraction of each signature mutation in each sample, pink indicates absence of the mutation and white indicates missing values (due to insufficient coverage). Mutations are grouped by variant and further by amplicon number (yellow boxes) in case multiple mutations co-occur on the same amplicon. Columns labelled ‘Amplicon’ followed by a number (green) show the observed frequency of co-occurrence on the same read pair for all mutations located on the respective amplicon. Mutations occur multiple times on the y axis if they either occur in more than one variant (red) or are located on two overlapping amplicons (orange). Source data
Fig. 3
Fig. 3. Prevalence and fitness advantage estimation for Lausanne based on wastewater and clinical sequencing data.
a, Top: Alpha (B.1.1.7) prevalence estimates based on wastewater sequencing data and on cantonal clinical sequencing data for Lausanne. Bottom: frequencies of Alpha-characteristic substitutions found in wastewater sequencing samples, which are aggregated and smoothed in the top panel. Grey columns show dates without wastewater samples. White columns show dates of failed experiments (insufficient coverage/no SARS-CoV-2 RNA detected in the sample). Orange and red bars indicate the frequency of Alpha-positive cantonal clinical samples, which are also smoothed. The red parts indicate the fraction of Alpha-positive samples that were sequenced retrospectively in March/April 2021 (cut-off date for the GISAID submission date, 21 March 2021). Solid lines represent the smoothed estimates and shaded areas represent 95% confidence bands. b, Estimates of the transmission fitness advantage fd, computed online (Methods) using the wastewater (blue) and cantonal clinical (orange) sequencing data only until the respective timepoints. Solid lines represent the maximum likelihood estimates, shaded areas represent 95% confidence intervals and the horizontal black line indicates offline estimate of fd based on clinical samples of the Lake Geneva Region dated 14 December 2020 to 11 February 2021 from Chen et al.. Source data
Fig. 4
Fig. 4. Prevalence and fitness advantage estimation for Zurich based on wastewater and clinical sequencing data.
a, Top: Alpha (B.1.1.7) prevalence estimates based on wastewater sequencing data and on cantonal clinical sequencing data for Zurich. Bottom: frequencies of Alpha-characteristic substitutions found in wastewater sequencing samples, which are aggregated and smoothed in the top panel. Grey columns show dates without wastewater samples. White columns show dates of failed experiments (insufficient coverage/no SARS-CoV-2 RNA detected in the sample). Orange and red bars indicate the frequency of Alpha-positive cantonal clinical samples, which are also smoothed. The red parts indicate the fraction of Alpha-positive samples that were sequenced retrospectively in March/April 2021 (cut-off date for the GISAID submission date, 21 March 2021). Solid lines represent the smoothed estimates and shaded areas represent 95% confidence bands. b, Estimates of the transmission fitness advantage fd, computed online (Methods) using the wastewater (blue), cantonal clinical (orange) and city clinical (green) sequencing data only until the respective timepoints for Zurich. Solid lines represent the maximum likelihood estimates, shaded areas represent 95% confidence intervals and the horizontal black line indicates offline estimate of fd based on clinical samples of the Greater Zurich Area dated 14 December 2020 to 11 February 2021 from Chen et al.. Source data
Fig. 5
Fig. 5. Detection of the Delta variant in six Swiss WWTPs.
Detection of the Delta variant in wastewater between January and September 2021 for the WWTPs of Lugano (top left), Laupen (top right), Zürich (middle left), Chur (middle right) and Altenrhein (bottom right), and between January and August 2021 for the WWTP of Lausanne (bottom left). Detection was performed through co-occurrences of signature mutations using COJAC, and compared to clinical sequencing in the cantons where the treatment plants are located. Green and orange bars represent the number of non-Delta and Delta clinical sequences, respectively, from the canton (stacked) for each day in the surveyed period. Blue bars indicate COJAC signals of variant-specific mutation co-occurrences in the wastewater. First detections are indicated by black arrows. Source data
Extended Data Fig. 1
Extended Data Fig. 1. Geographical locations of wastewater treatment plants (WWTPs) surveyed for this study.
Geographical locations of wastewater treatment plants (WWTPs) surveyed for this study. WWTP catchment areas are highlighted in light red. Cantons in which the WWTPs are located are highlighted in grey. Population numbers are for the WWTP catchment areas and surrounding cantons, respectively. Location of the ski resort is illustrative. Source: Federal Office of Topography. Wastewater treatment plant catchments of Switzerland: Eawag (2014) updated from https://www.dora.lib4ri.ch/eawag/islandora/object/eawag%3A5599.
Extended Data Fig. 2
Extended Data Fig. 2. Logistic growth model fitted to variant proportions derived from wastewater and clinical samples.
Dots with error bars represent daily empirical proportions of Alpha-positive clinical samples (orange), or average empirical proportions of Alpha-characteristic substitutions in wastewater (blue). Error bars are 95% Wilson confidence intervals. Solid lines represent maximum likelihood fitted values of the logistic model used to infer transmission advantage. Shaded areas represent 95% confidence bands. Source data

Similar articles

Cited by

References

    1. Davies NG, et al. Estimated transmissibility and impact of SARS-CoV-2 lineage B.1.1.7 in England. Science. 2021;372:eabg3055. doi: 10.1126/science.abg3055. - DOI - PMC - PubMed
    1. Faria NR, et al. Genomics and epidemiology of the P.1 SARS-CoV-2 lineage in Manaus, Brazil. Science. 2021;372:815–821. doi: 10.1126/science.abh2644. - DOI - PMC - PubMed
    1. Tegally, H. et al. Emergence and rapid spread of a new severe acute respiratory syndrome-related coronavirus 2 (SARS-CoV-2) lineage with multiple spike mutations in South Africa. Preprint at medRxiv10.1101/2020.12.21.20248640 (2020).
    1. Davies NG, et al. Increased mortality in community-tested cases of SARS-CoV-2 lineage B.1.1.7. Nature. 2021;593:270–274. doi: 10.1038/s41586-021-03426-1. - DOI - PMC - PubMed
    1. Wibmer CK, et al. SARS-CoV-2 501Y.V2 escapes neutralization by South African COVID-19 donor plasma. Nat. Med. 2021;27:622–625. doi: 10.1038/s41591-021-01285-x. - DOI - PubMed

Publication types

Supplementary concepts