. 2022 Aug 9;22(16):3067-3079.
doi: 10.1039/d2lc00356b.

Drop-of-sample rheometry of biological fluids by noncontact acoustic tweezing spectroscopy

Affiliations

Drop-of-sample rheometry of biological fluids by noncontact acoustic tweezing spectroscopy

Nithya Kasireddy et al. Lab Chip. .

Abstract

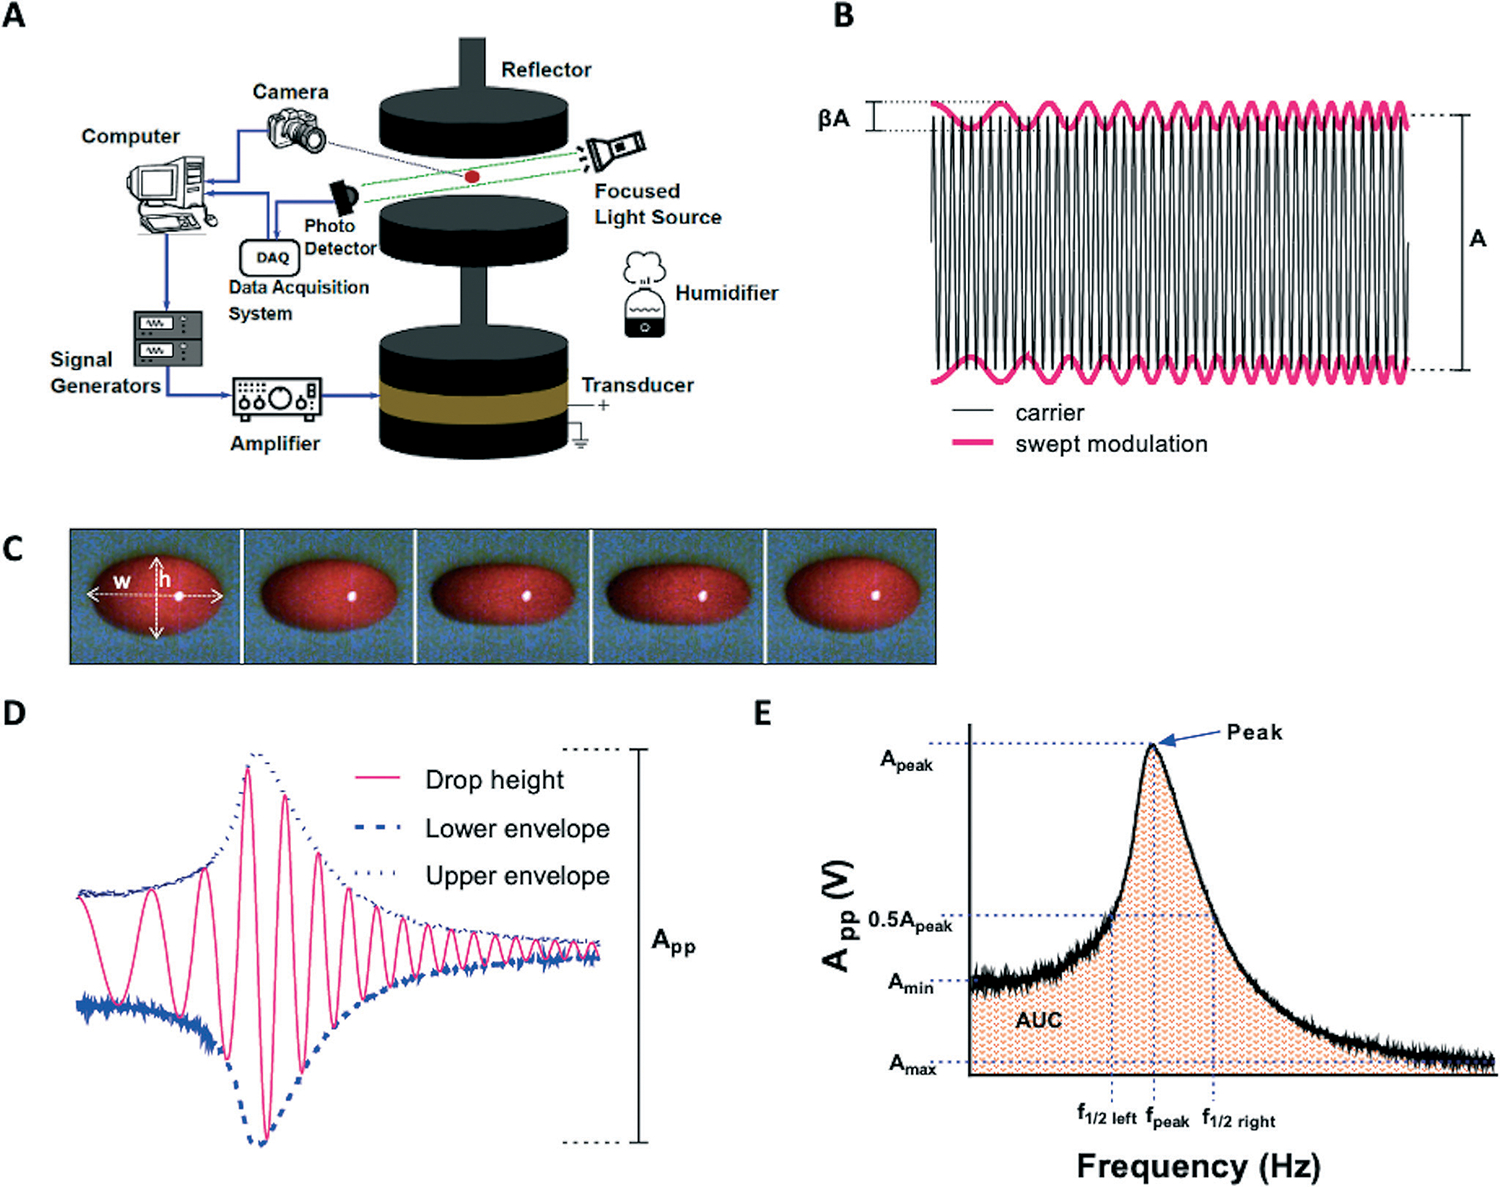
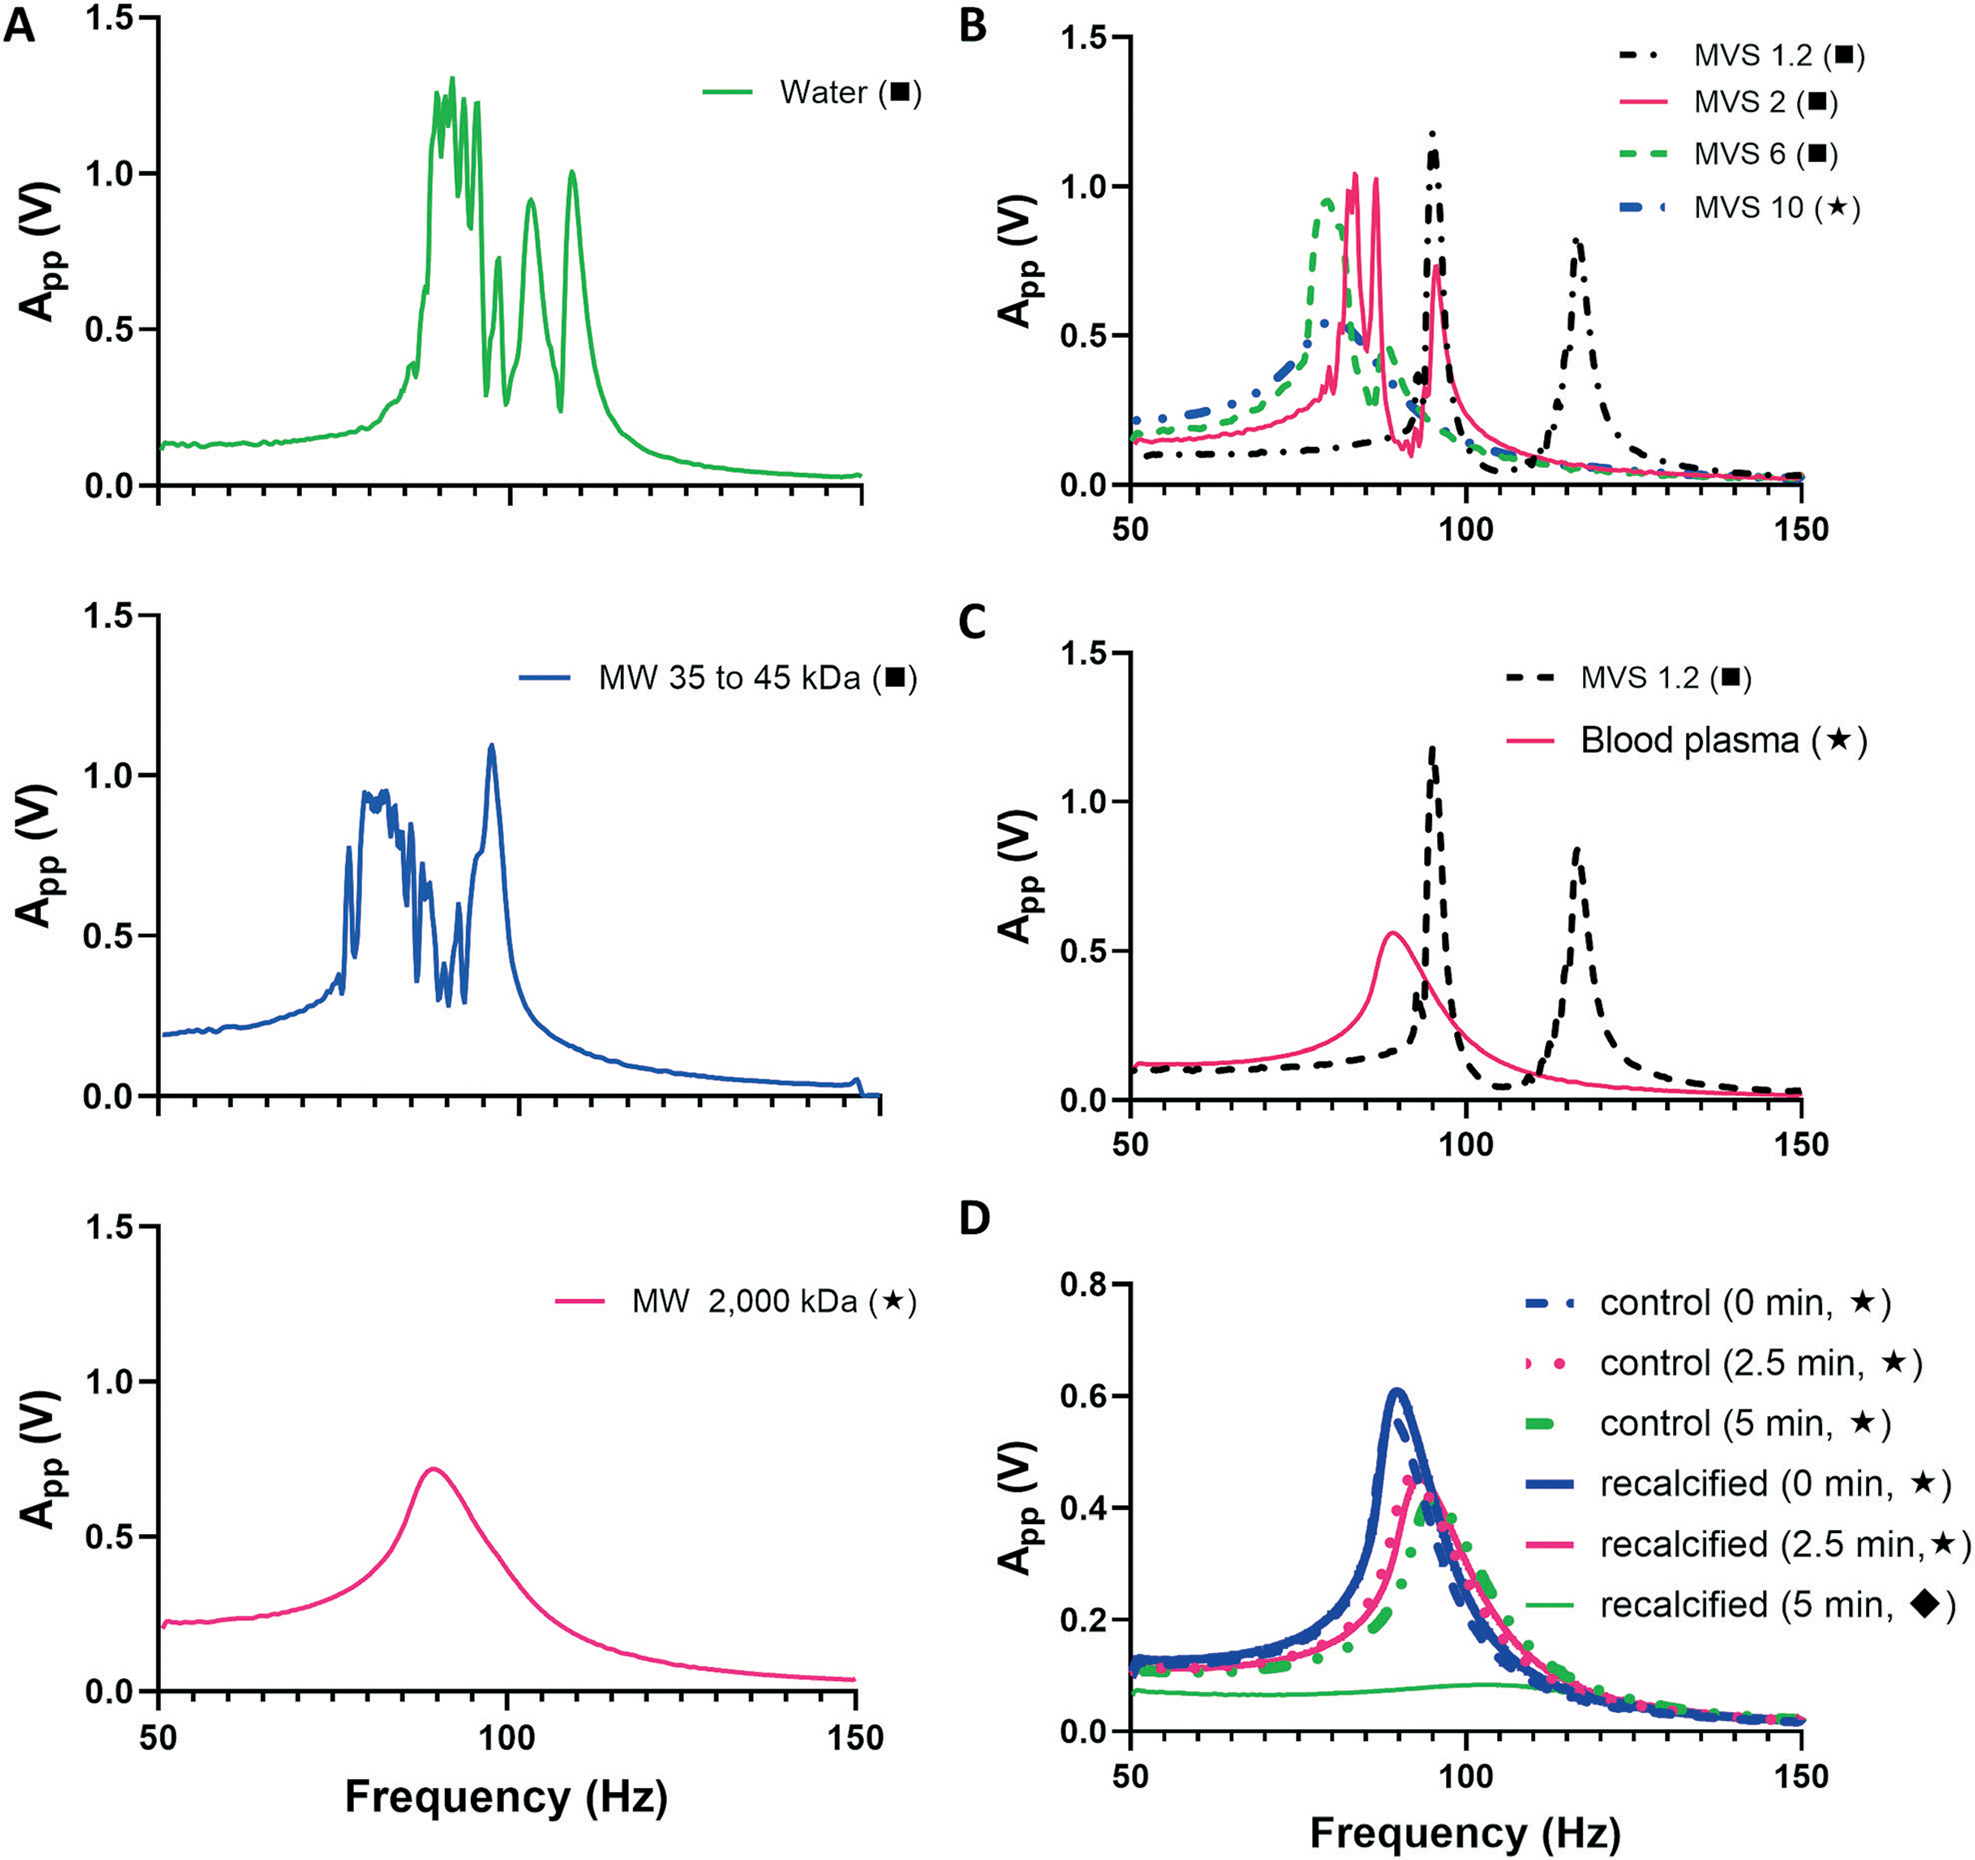
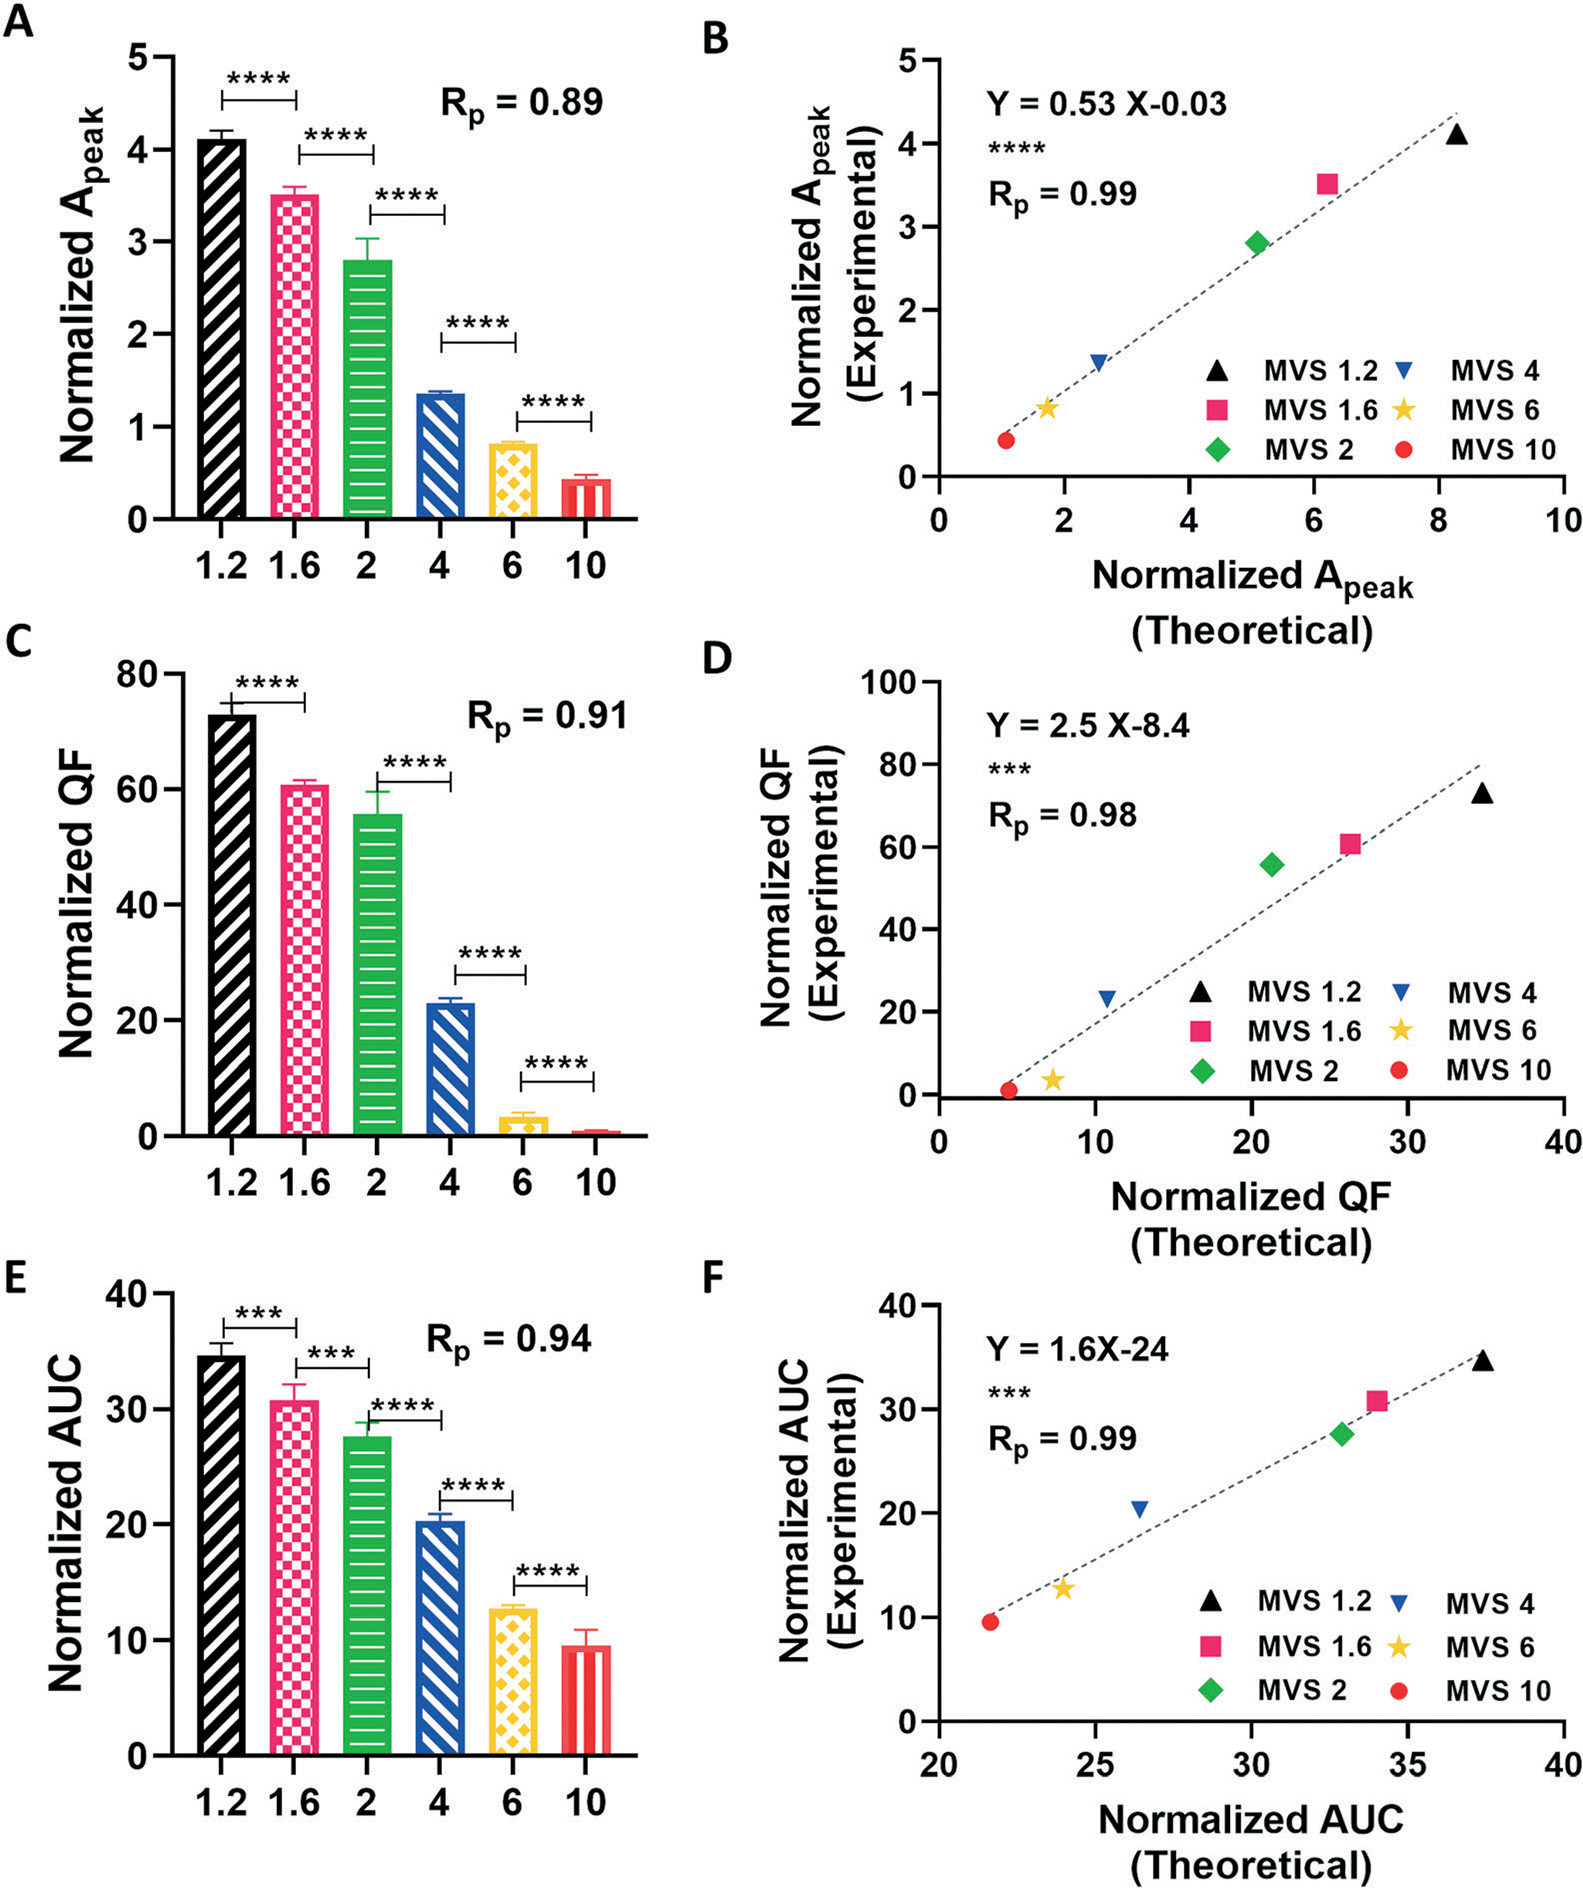
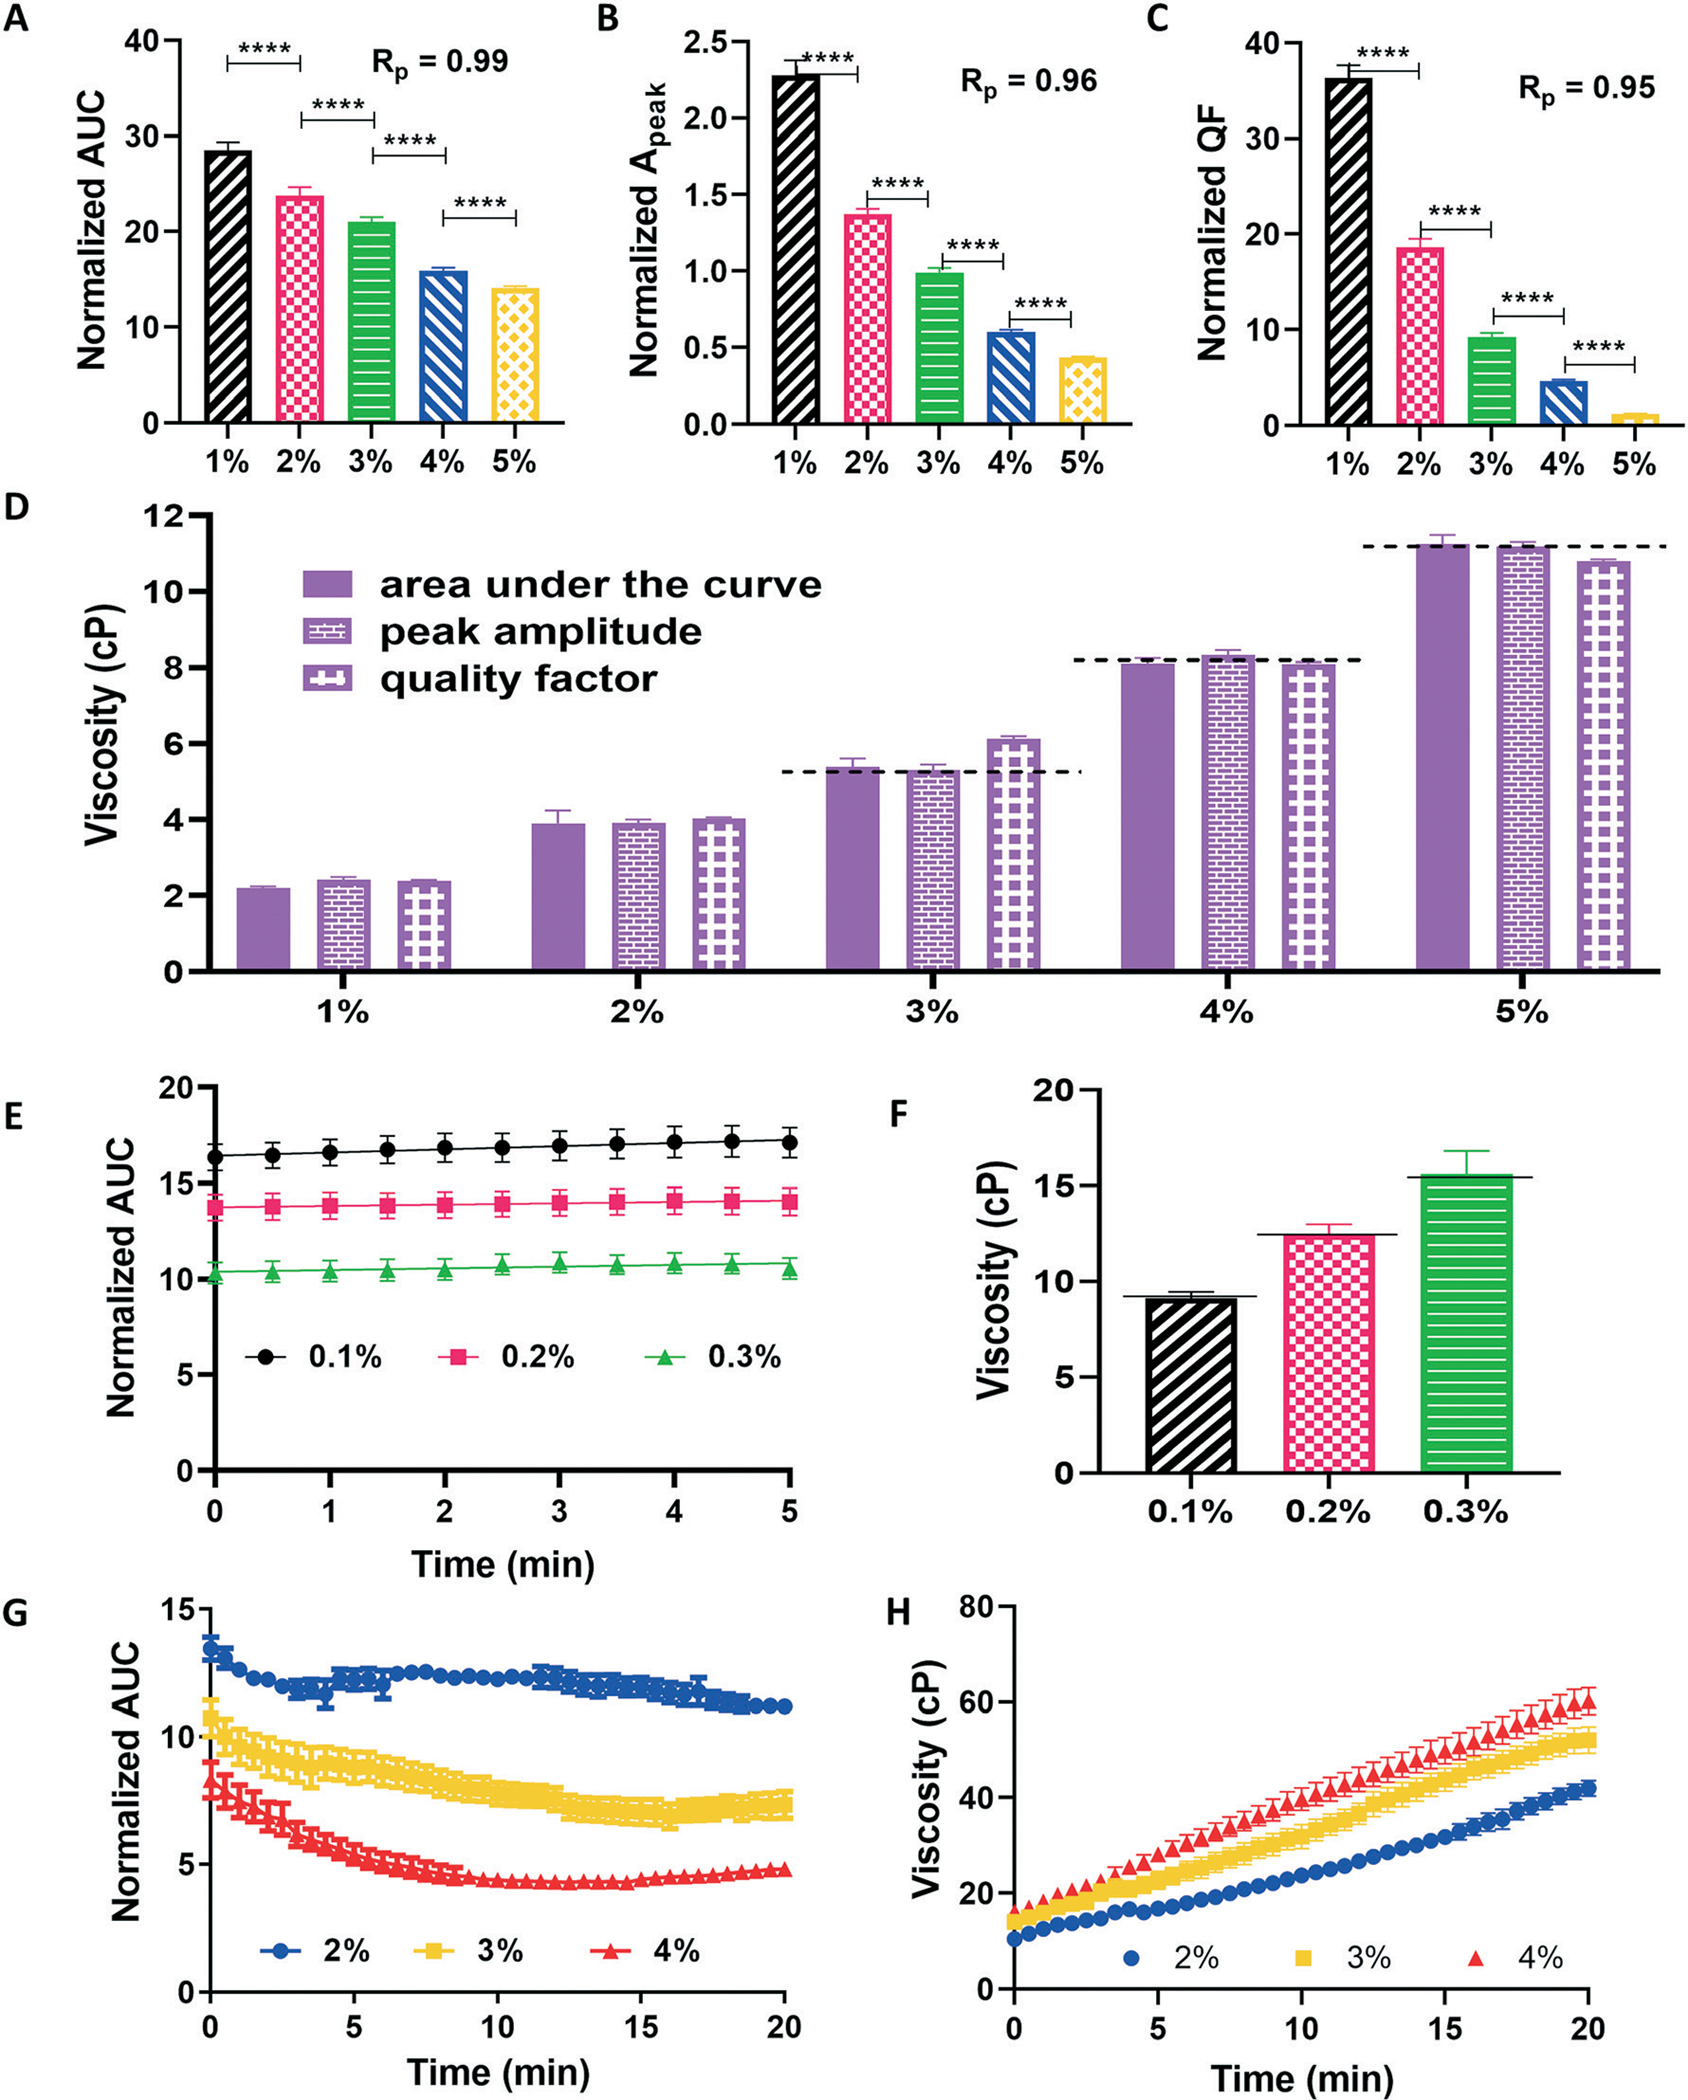
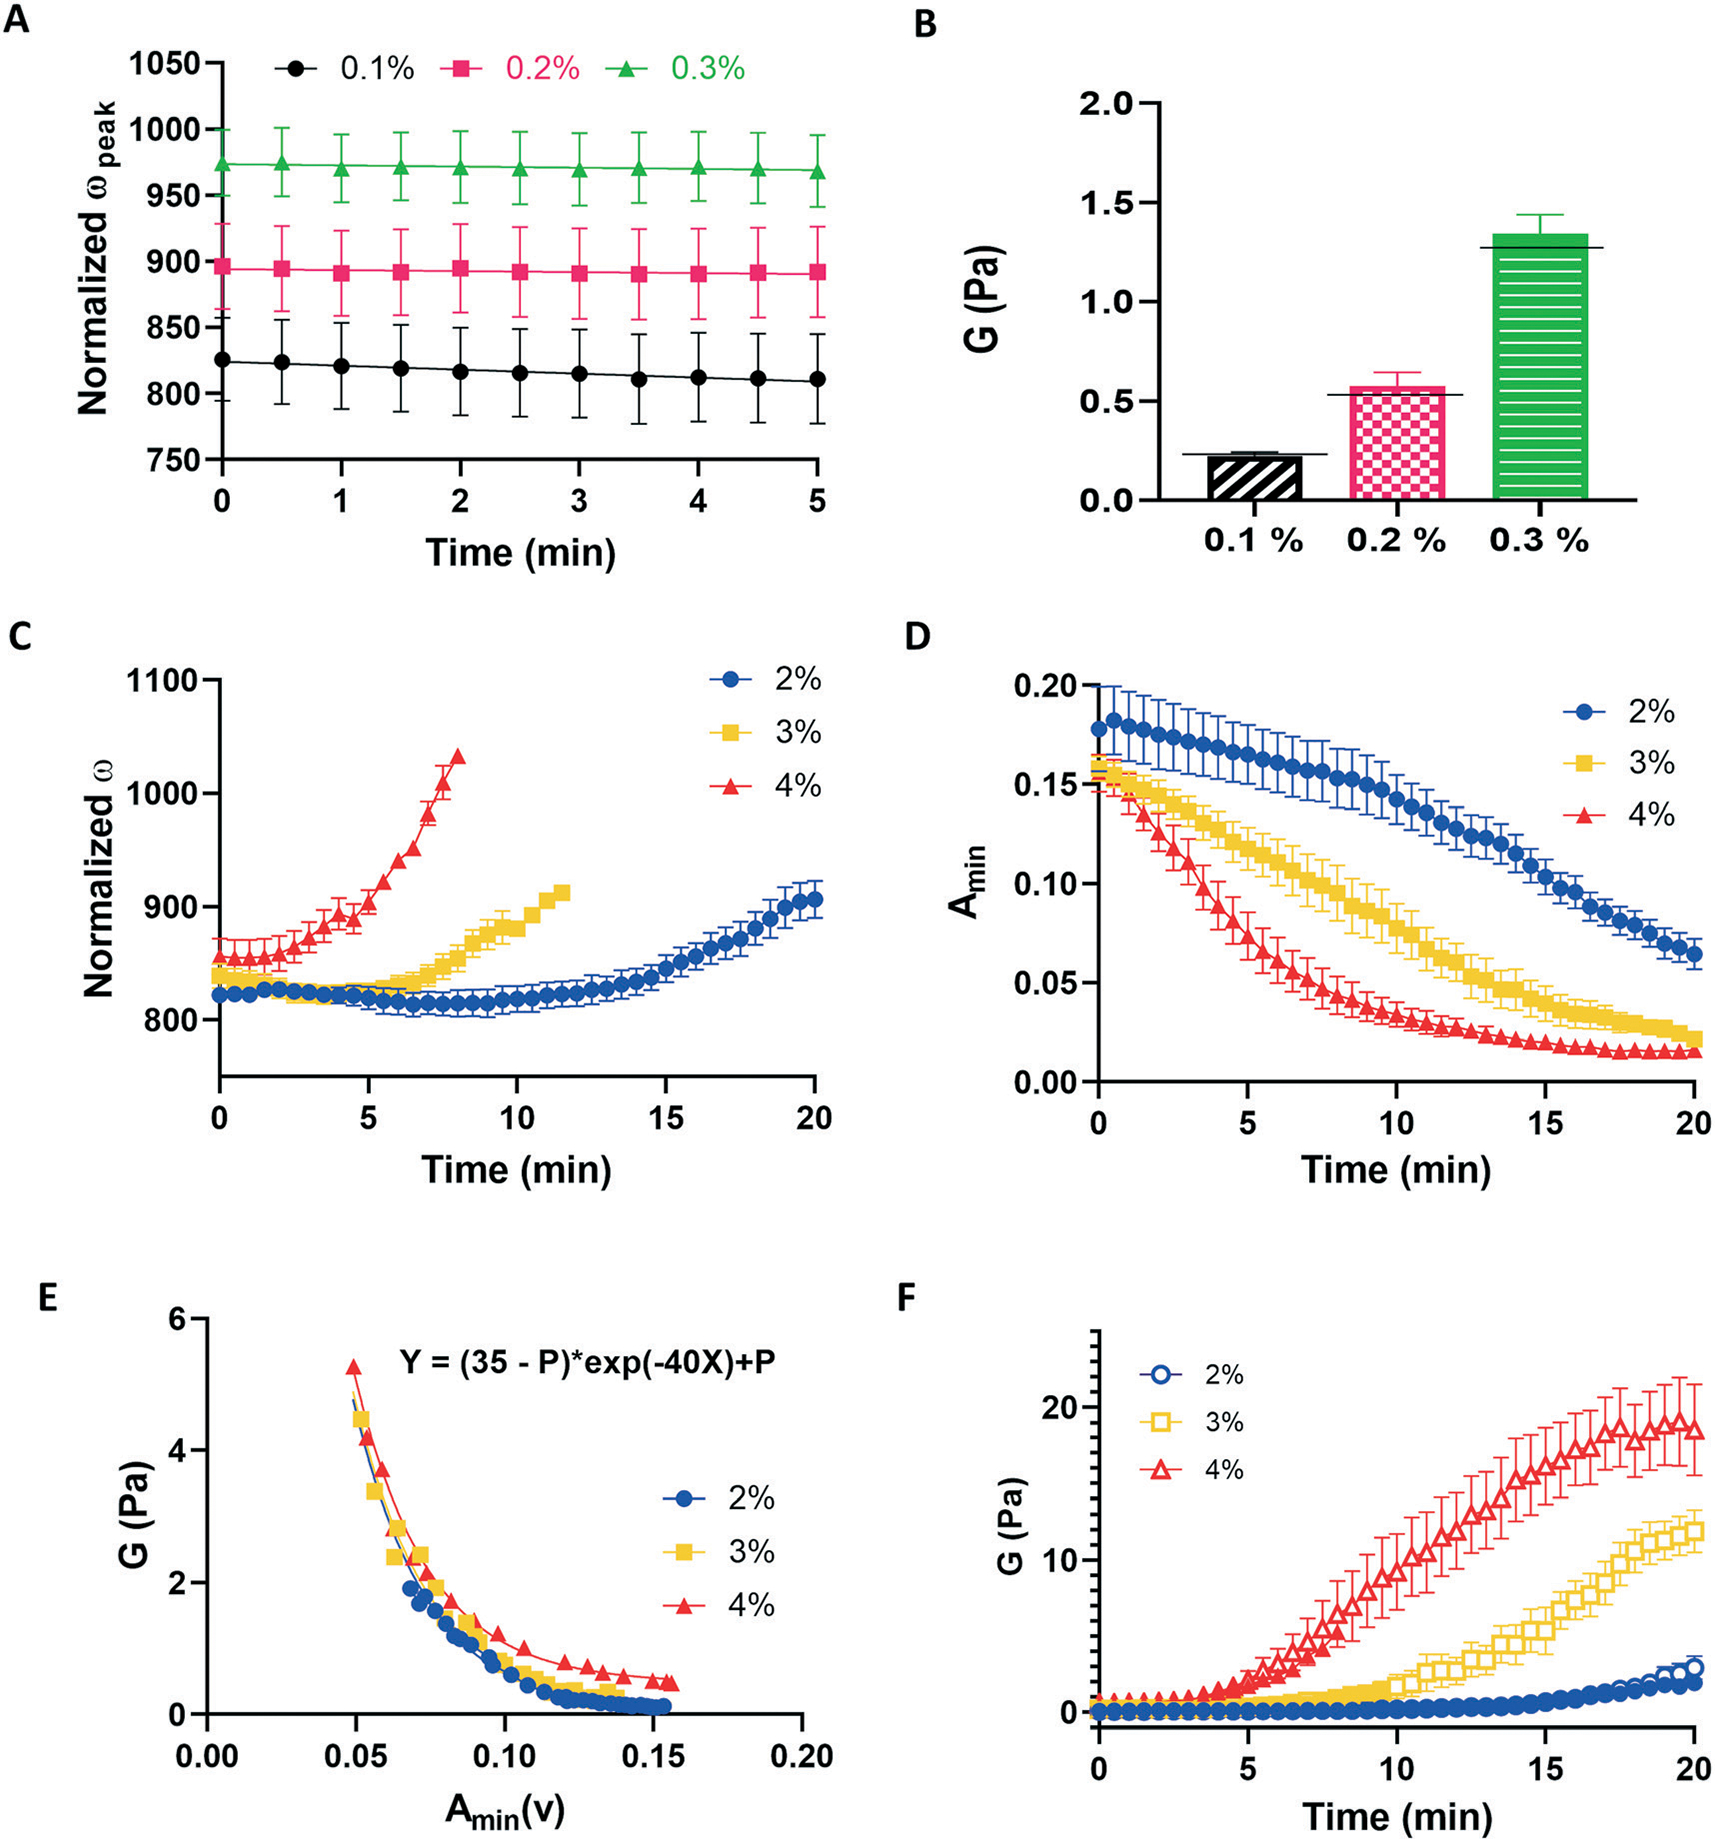
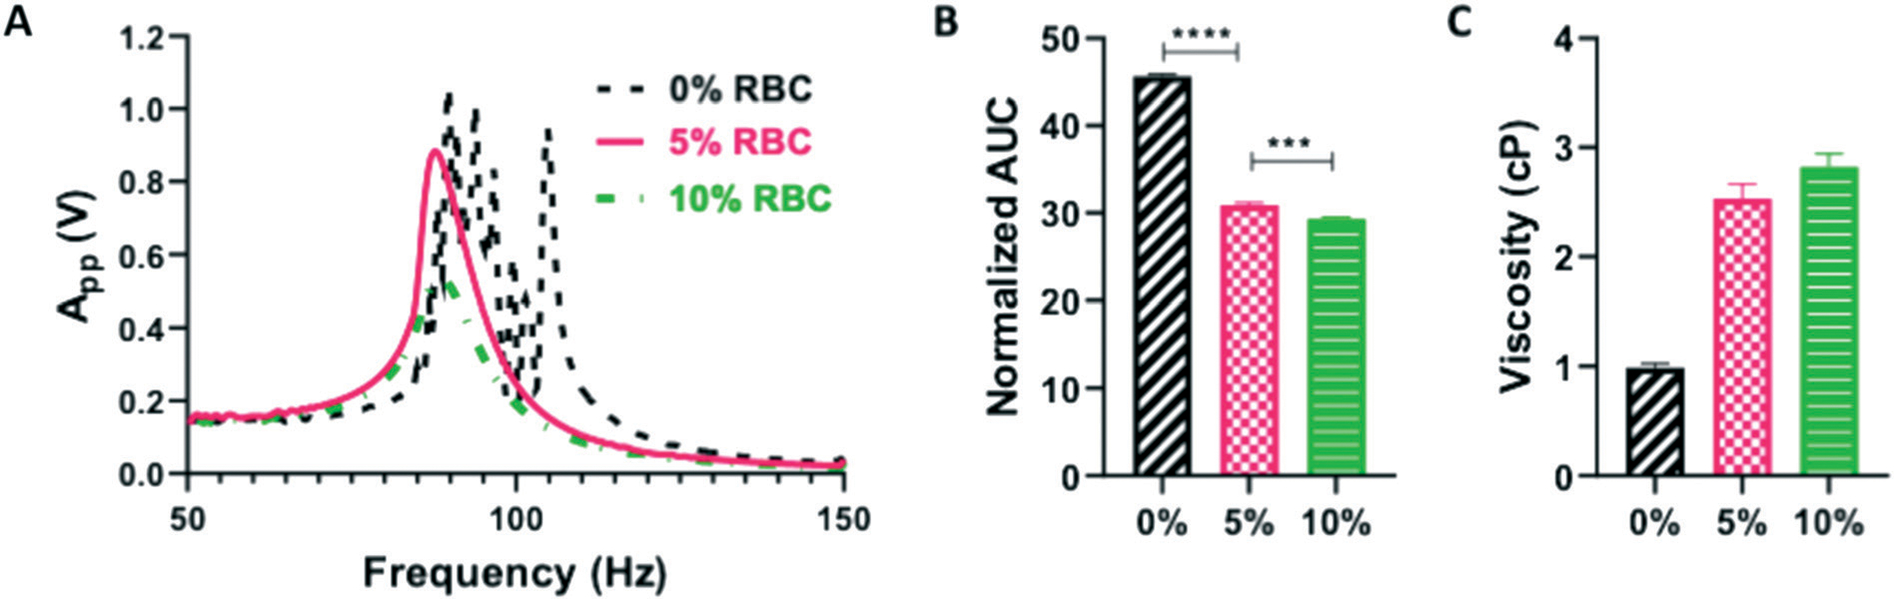
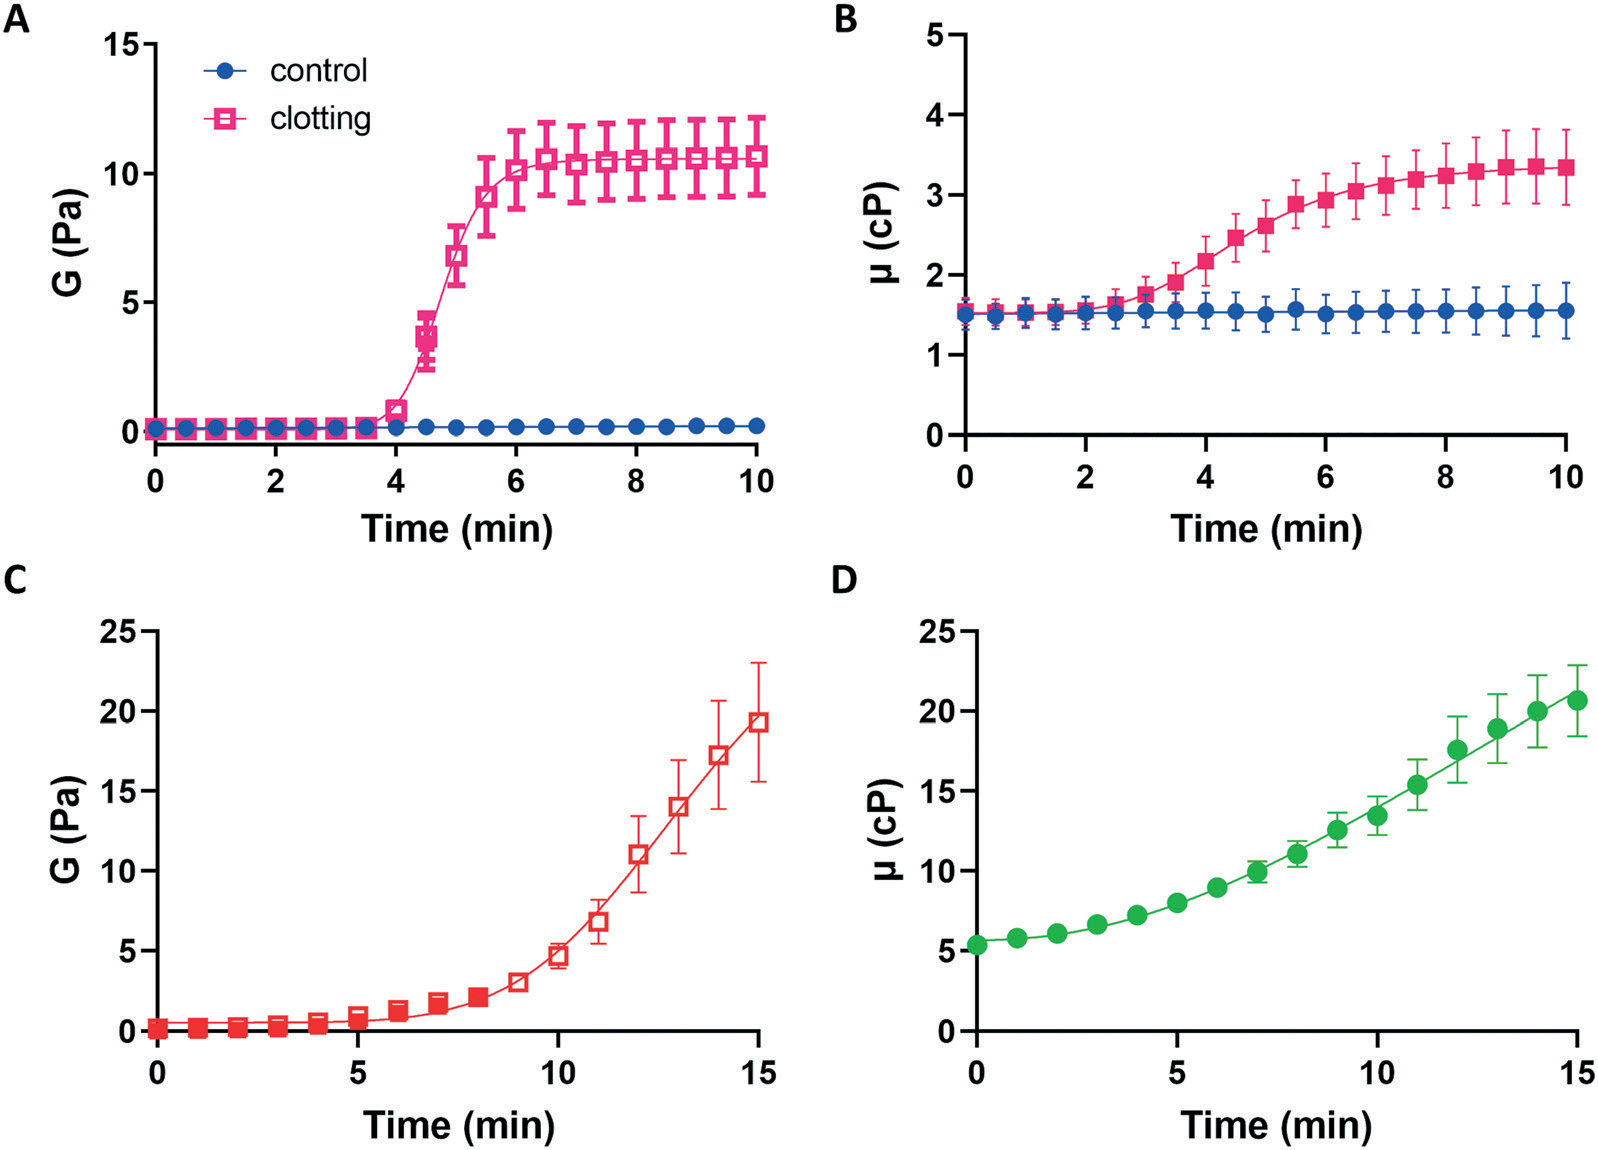
Knowledge of rheological properties, such as viscosity and elasticity, is necessary for efficient material processing and transportation as well as biological analysis. Existing rheometers operate with large sample volume and induce sample contact with container or device walls, which are inadequate for rheological analysis of sensitive fluids limited in availability. In this work, we introduce acoustic tweezing spectroscopy (ATS), a novel noncontact rheological technique that operates with a single 4-6 μl drop of fluid sample. In ATS, a sample drop is acoustically levitated and then exposed to a modulated acoustic signal to induce its forced oscillation. The time-dependent sample viscosity and elasticity are measured from the resulting drop response. The ATS measurements of polymeric solutions (dextran, xanthan gum, gelatin) agree well with previously reported data. The ATS predicts that the shear viscosity of blood plasma increases from 1.5 cP at 1.5 min of coagulation onset to 3.35 cP at 9 min, while its shear elastic modulus grows from a negligible value to 10.7 Pa between 3.5 min and 6.5 min. Coagulation increases whole blood viscosity from 5.4 cP to 20.7 cP and elasticity from 0.1 Pa to 19.2 Pa at 15 min. In summary, ATS provides the opportunity for sensitive small-volume rheological analysis in biomedical research and medical, pharmaceutical, and chemical industries.


Conflict of interest statement

Conflicts of interest

N. K. and D. B. K. have the following conflicts of interest to disclose: N. K. owns equity and has an employment at Levisonics Inc. She is also an inventor listed on the patent PCT/US21/15336 (pending). D. B. K. owns equity in Levisonics Inc. He is also an inventor on patents PCT/US14/55559 (issued), PCT/US2018/014879 (issued), and PCT/US21/15336 (pending). J. C. O. declares no conflict of interest.

Figures

Fig. 1
Fig. 1
(A) Schematic of the acoustic tweezing apparatus. (B) The drop was driven into shape oscillation by the sinusoidal carrier wave (black) with swept amplitude modulation (pink). (C) Images of an oscillating blood drop during acoustic tweezing. (D) Driving signal induced change in drop height (pink), as measured from the photo-detector output. Dark and light blue curves are the upper and the lower envelopes of the drop response. (E) Amplitude–frequency response of the drop obtained from the envelope data in (D) with the following parameters extracted: area under the curve (AUC), fpeak,Apeak,Amin,Amax,f1/2,right, and f1/2,left
Fig. 2
Fig. 2
Amplitude frequency response (AFR) of (A) water (green) and 5% (w/v) dextran of molecular weights of 35 to 45 kDa (blue) and 2000 kDa (pink); (B) MVS fluids with viscosity 1.2 cP (black), 2.0 cP (pink), 6.0 cP (green), and 10 cP (blue); (C) MVS with viscosity 1.2 cP (green) and commercial blood plasma (pink); (D) untreated blood plasma (dashed lines) and blood plasma treated with aPTT-XL and CaCl2 (solid lines) at time 0 min (blue), 2.5 min (pink) and 5 min (green). ■ represents an AFR curve with multiple peaks, ★ represents a smooth AFR curve with a single peak, and ◆ represents a nonresonant AFR curve (no peak).
Fig. 3
Fig. 3
Normalized peak amplitude (A), quality factor (C), AUC (E) for MVS fluids with viscosity 1.2 cP (black), 1.6 cP (pink), 2.0 cP (green), 4.0 cP (blue), 6.0 cP (yellow) and 10 cP (red). Also shown are theoretical versus experimental correlation curves for peak amplitude (B), quality factor (D) and area under the curve (F). Sample size n = 9. ***p < 0.001, ****p < 0.0001.
Fig. 4
Fig. 4
Normalized AUC (A), peak amplitude (B), quality factor (C), and (D) viscosity measured by the nonresonant (solid bar) and resonant (horizontal stripes, checkerboard) ATS for 1% (black, n = 10), 2% (pink, n = 10), 3% (green, n = 25), 4% (blue, n = 25), and 5% (red, n = 26) high molecular weight (2000 kDa) dextran solutions. Also shown are (E) normalized AUC vs. time and (F) viscosity for 0.1% (black, n = 17), 0.2% (pink, n = 17), and 0.3% (green, n = 16) xanthan gum solutions. (G and H) are the normalized AUC and viscosity vs. time for 2% (blue, n = 4), 3% (yellow, n = 5), and 4% (red, n = 4) gelatin solutions. The viscosity of xanthan gum and gelatin solutions was measured by the nonresonant method. Black dashed lines in (D) and black solid lines in (F) are reported reference values of viscosity for dextran and xanthan gum solutions. ****p < 0.0001.
Fig. 5
Fig. 5
Normalized ωpeak (A) and elastic modulus G (B) for 0.1% (black, n = 17), 0.2% (pink, n = 17), and 0.3% (green, n = 16) xanthan gum solutions. (C and D) show normalized ωpeak and Amin vs. time for 2% (blue, n = 4); 3% (yellow, n = 5); and 4% (red, n = 4) gelatin solutions. In (E and F), elastic modulus G of gelatin solutions is plotted as a function of Amin and time, based on measurements by the resonant (solid symbols) and nonresonant (hollow symbols) methods. Black solid lines in (B) are reported reference values of xanthan gum solution elasticity.
Fig. 6
Fig. 6
(A) AFR, (B) normalized AUC, and (C) viscosity of PBS with 0% (black), 5% (pink) and 10% (green) sheep RBCs, measured by ATS. Sample size n = 10 to 13. ***p < 0.001, ****p < 0.0001.
Fig. 7
Fig. 7
Elastic modulus G (A) and viscosity μ (B) vs. time for control anticoagulated plasma (blue, n = 5) and plasma treated with aPTT-XL and CaCl2 (pink, n = 10). (C and D) show G (red, n = 16) and μ (green, n =18) vs. time for whole blood treated with aPTT-XL and CaCl2. In (A and C), hollow and solid symbols are the data produced by the nonresonant and resonant methods, respectively.

Similar articles

Cited by

References

    1. Borzacchiello A, Ambrosio L, Netti P and Nicolais L, in Tissue Engineering and Novel Delivery Systems, CRC Press, 2003, pp. 341–361.
    1. Dealy JM and Wissbrun KF, in Melt Rheology and Its Role in Plastics Processing, Springer, 1999, pp. 567–600.
    1. Tabilo-Munizaga G and Barbosa-Cánovas GV, J. Food Eng, 2005, 67, 147–156.
    1. Gómez-Díaz D and Navaza JM, J. Food Eng, 2003, 56, 387–392.
    1. Ilyin SO and Strelets LA, Energy Fuels, 2018, 32, 268–278.

Publication types