Meta-Analysis
. 2023 Jan;118(1):30-47.
doi: 10.1111/add.16001. Epub 2022 Aug 11.

Emotion regulation in substance use disorders: a systematic review and meta-analysis

Affiliations
Meta-Analysis

Emotion regulation in substance use disorders: a systematic review and meta-analysis

Jordan Stellern et al. Addiction. 2023 Jan.

Abstract

Background and aims: The ability to regulate emotions effectively has been associated with resilience to psychopathology. Individuals with substance use disorders (SUDs) have been shown to have higher levels of negative emotionality, with some evidence suggesting impairment in emotion regulation compared with individuals without SUDs. However, no previous attempt has been made to systematically review the literature to assess the magnitude of this difference. We aimed to assess the association between SUD diagnosis and emotion regulation as measured by the Difficulties in Emotion Regulation Scale (DERS) and Emotion Regulation Questionnaire (ERQ) through a systematic review and meta-analysis of existing findings.

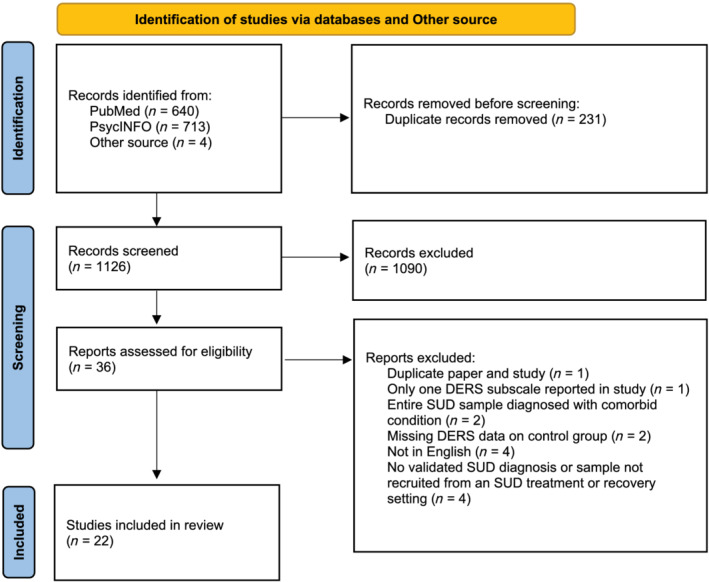
Methods: The systematic review was conducted using PubMed, PsycINFO and Embase. We examined cross-sectional studies that compared a SUD group with a control group and measured emotion regulation using the DERS or the ERQ. The primary analysis focused on papers using the DERS, as this was the predominant instrument in the literature.

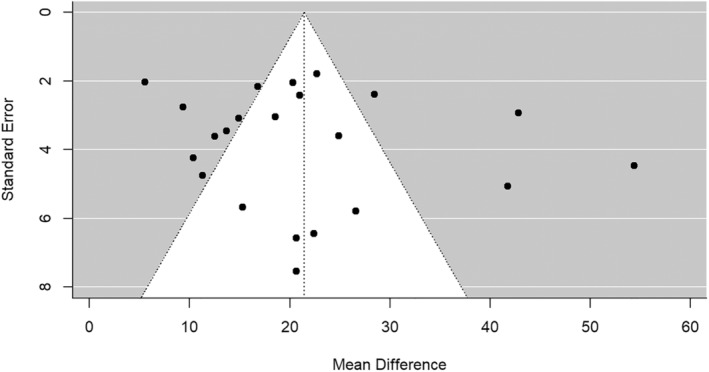
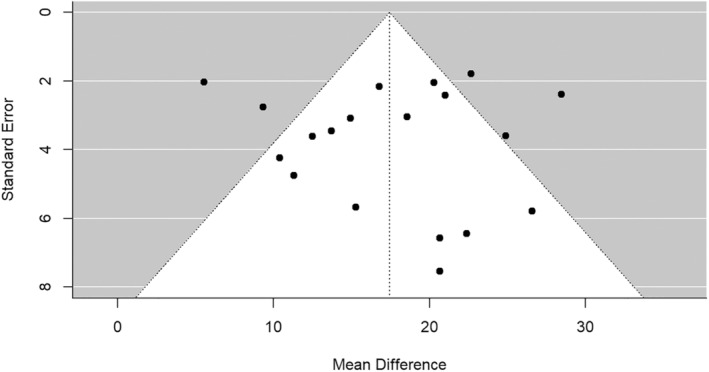
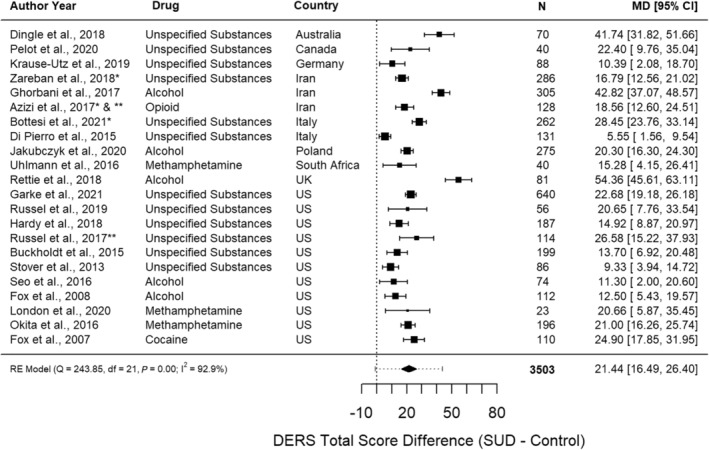
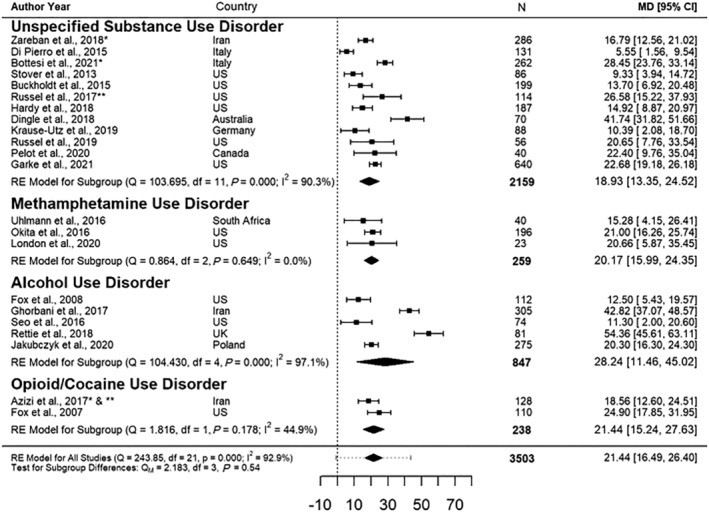
Results: Twenty-two studies met our primary analysis criteria, representing 1936 individuals with a SUD and 1567 controls. Individuals with SUDs relative to controls had significantly greater DERS scores, with a mean difference of 21.44 [95% confidence interval (CI) = 16.49-26.40, P < 0.001] and Hedges' g = 1.05 (95% CI = 0.86-1.24, P < 0.001). The difference was robust, remaining significant after removing outliers and studies with high risk of bias. Individuals with SUDs demonstrated poorer emotion regulation on each subscale of the DERS, with the largest deficits in the Strategies and Impulse subscales. The ERQ analysis revealed greater use of expressive suppression in those with SUDs relative to controls (Hedges' g = 0.76, 95% CI = 0.25-1.28, P = 0.004).

Conclusions: People with substance use disorders appear to have greater difficulties in emotion regulation than people without substance use disorders.

Keywords: Alcohol use disorder; cocaine addiction; emotion regulation; methamphetamine; opioid use disorder; substance use disorders.


Conflict of interest statement

None.

Figures

FIGURE 1
FIGURE 1
Difficulties in Emotion Regulation Scale (DERS) study selection flow diagram; systematic review search process. N = sample size; SUD = substance use disorder; other source = articles from preliminary search.
FIGURE 2
FIGURE 2
Funnel plot of all studies using the full Difficulties in Emotion Regulation Scale (DERS) in the meta‐analysis to assess for publication bias. Each dot represents an individual study, with the y‐axis representing the standard error of each study (lower studies have higher standard error) and the x‐axis representing the effect size of each study. The vertical line in the middle of the funnel represents the summary effect size. The diagonal funnel lines represent the area where we would expect effect sizes of each study to be. Studies outside this area can be interpreted as outliers or studies with high heterogeneity.
FIGURE 3
FIGURE 3
Funnel plot of the studies included in the meta‐analysis, with three outlier studies containing effect sizes over 40 removed. Each dot represents an individual study, with the y‐axis representing the standard error of each study (lower studies have higher standard error) and the x‐axis representing the effect size of each study. The vertical line in the middle of the funnel represents the summary effect size. The diagonal funnel lines represent the area where we would expect effect sizes of each study to be. Studies outside this area can be interpreted as outliers or studies with high heterogeneity.
FIGURE 4
FIGURE 4
Forest plot of total Difficulties in Emotion Regulation Scale (DERS) scores, depicting the mean differences between the SUD group and control group for each study as well as the summary effect. Error bars for the individual studies represent the 95% CI. The 95% CI for the summary effect is represented by the diamond width. Dashed error bars for the summary effect represent the prediction interval. The prediction interval represents a prediction of the range of possible effect sizes that could be found were a new study to be conducted. N = sample size; MD = mean difference; CI = confidence interval. *Studies with total DERS score calculated from DERS subscales. **Studies with multiple SUD arms and one control arm: multiple SUD means and SDs were pooled into one.
FIGURE 5
FIGURE 5
Forest plot of total Difficulties in Emotion Regulation Scale (DERS) scores by substance use disorder (SUD), depicting the mean differences between the SUD group and control group for each study as well as the summary effect broken down by the specific substance use disorder investigated within the study. Error bars for the individual studies represent the 95% CI. The 95% CI for the summary effect is represented by the diamond width. Dashed error bars for the summary effect represent the prediction interval. The prediction interval represents a prediction of the range of possible effect sizes that could be found were a new study to be conducted. N = sample size; MD = mean difference; CI = confidence interval. *Studies with total DERS score calculated from DERS subscales. **Studies with multiple SUD arms and one control arm: multiple SUD means and SDs were pooled into one.
FIGURE 6
FIGURE 6
Forest plot of Emotion Regulation Questionnaire (ERQ) expressive suppression factor (a) and cognitive reappraisal factor (b) scores, depicting the mean differences between the substance use disorder (SUD) group and control group for each study as well as the summary effect. Error bars for the individual studies represent the 95% CI. The 95% CI for the summary effect is represented by the diamond width. Dashed error bars for the summary effect represent the prediction interval. The prediction interval represents a prediction of the range of possible effect sizes that could be found were a new study to be conducted. N = sample size; MD = mean difference; CI = confidence interval.

References

    1. Carvalho AF, Heilig M, Perez A, Probst C, Rehm J. Alcohol use disorders. Lancet. 2019;394:781–92. - PubMed
    1. United Nations Office on Drugs and Crime (UNODC) . World Drug Report Executive Summary. Vienna, Austria: UNODC; 2019.
    1. Wellman RJ, Chaiton M, Morgenstern M, O’Loughlin J. Untangling influences in the longitudinal relationship between depressive symptoms and drinking frequency in high school. J Adolesc Health. 2020;66:308–14. - PubMed
    1. Wellman RJ, Contreras GA, Dugas EN, O’Loughlin EK, O’Loughlin JL. Determinants of sustained binge drinking in young adults. Alcohol Clin Exp Res. 2014;38:1409–15. - PubMed
    1. Kenneson A, Funderburk JS, Maisto SA. Substance use disorders increase the odds of subsequent mood disorders. Drug Alcohol Depend. 2013;133:338–43. - PubMed

Publication types