. 2022 Aug;21(8):e13503.
doi: 10.1111/acel.13503. Epub 2022 Jul 18.

Effects of cerebral amyloid angiopathy on the brain vasculome

Affiliations

Effects of cerebral amyloid angiopathy on the brain vasculome

Wenjun Deng et al. Aging Cell. 2022 Aug.

Abstract

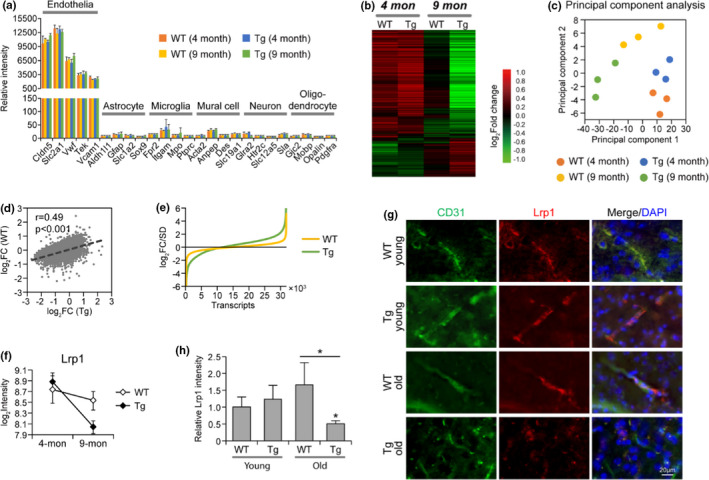
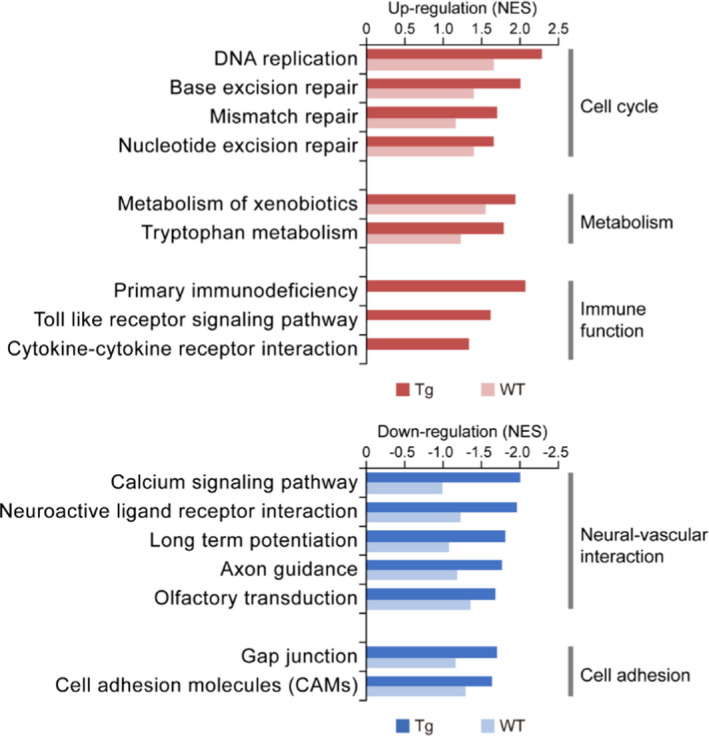
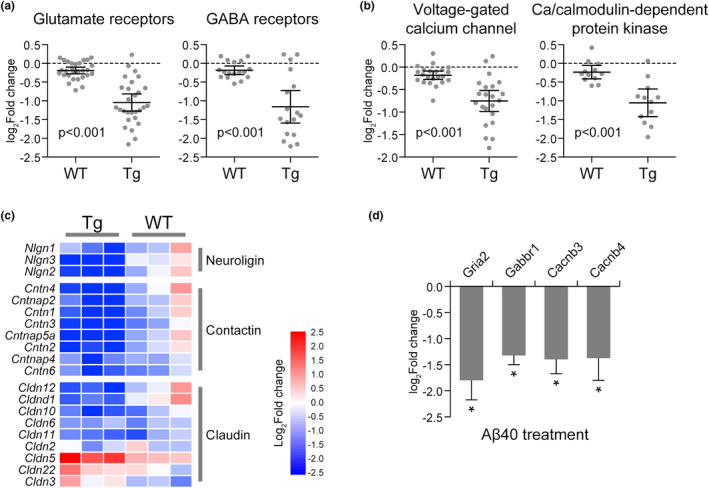
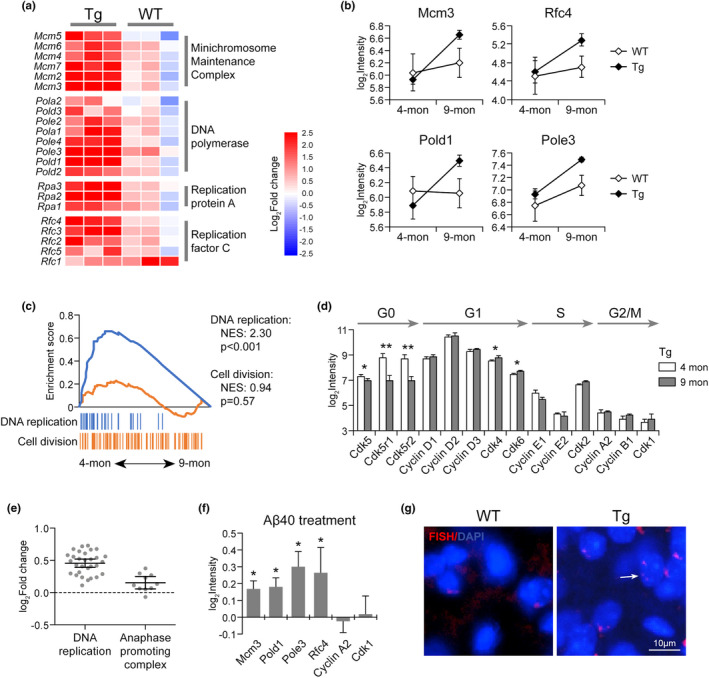
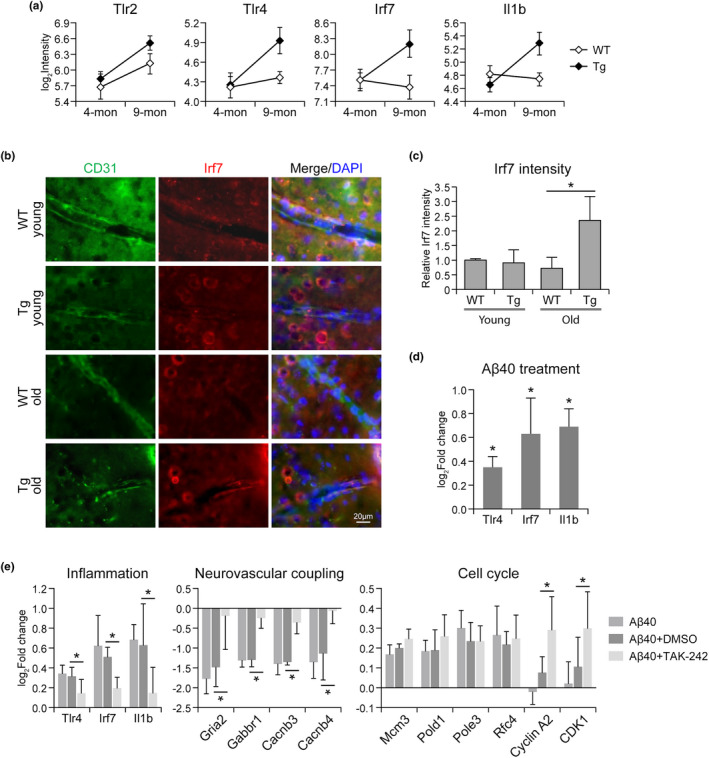
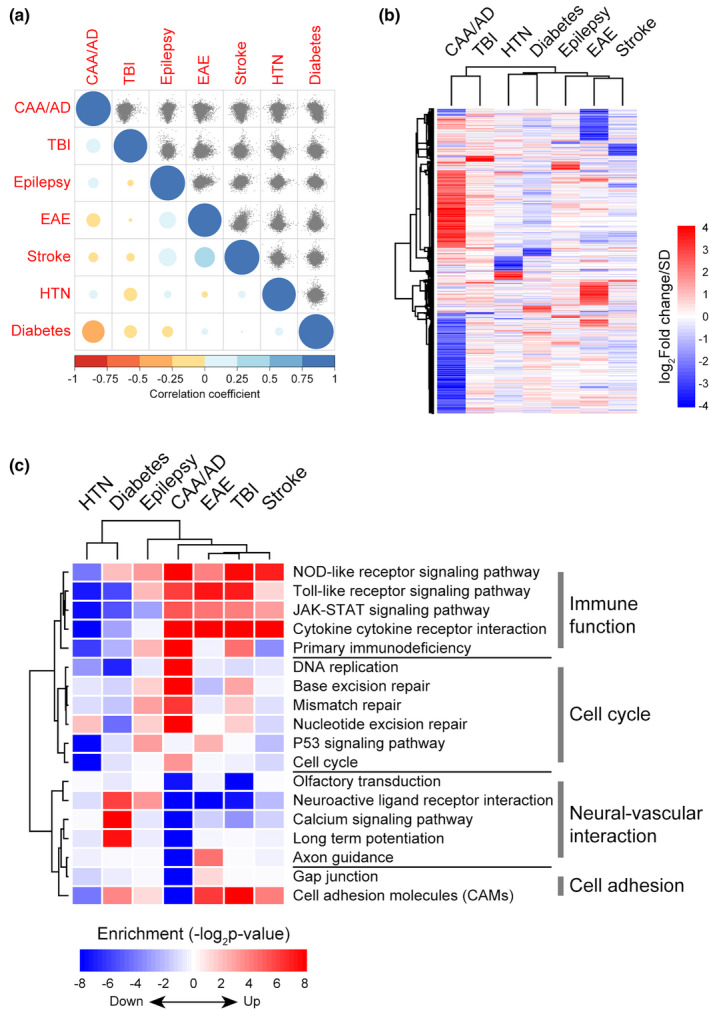
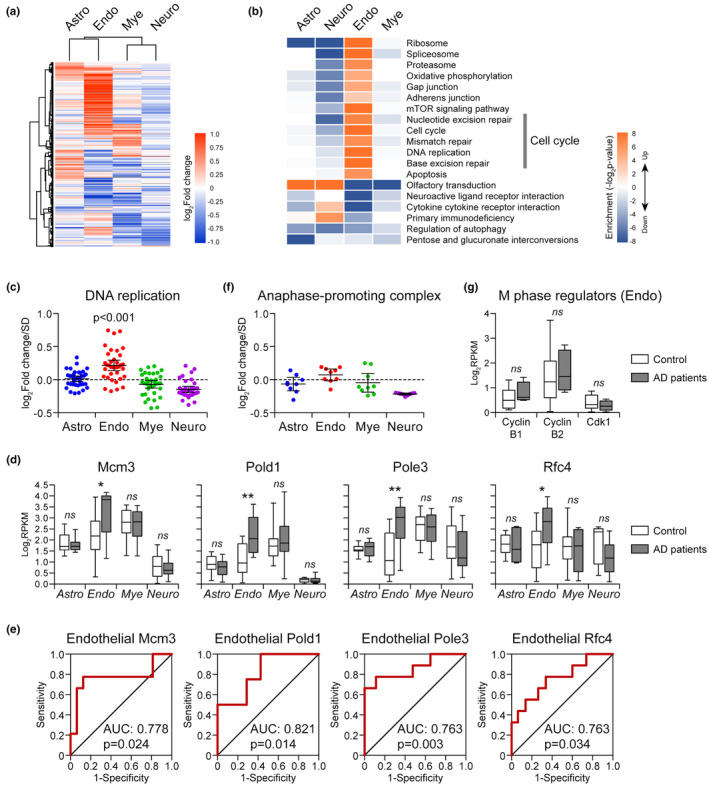
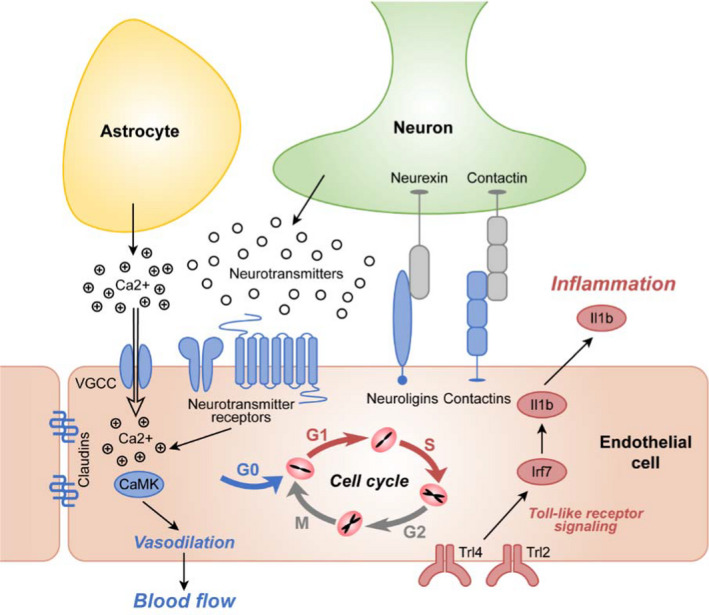
β-amyloid (Aβ) deposits in brain blood vessel walls underlie the vascular pathology of Alzheimer's disease (AD) and cerebral amyloid angiopathy (CAA). Growing evidence has suggested the involvement of cerebrovascular dysfunction in the initiation and progression of cognitive impairment in AD and CAA patients. Therefore, in this study, we assessed the brain vasculome in a mouse model in order to identify cerebrovascular pathways that may be involved in AD and CAA vascular pathogenesis in the context of aging. Brain endothelial cells were isolated from young and old wild-type mice, and young and old transgenic mice expressing Swedish mutation in amyloid precursor protein and exon 9 deletion in presenilin 1 (APPswe/PSEN1dE9). Microarray profiling of these endothelial transcriptomes demonstrated that accumulation of vascular Aβ in the aging APPswe/PSEN1dE9 mouse is associated with impaired endothelial expression of neurotransmitter receptors and calcium signaling transductors, while the genes involved in cell cycle and inflammation were upregulated. These results suggest that the vascular pathology of AD and CAA may involve the disruption of neurovascular coupling, reactivation of cell cycle in quiescent endothelial cells, and enhanced inflammation. Further dissection of these endothelial mechanisms may offer opportunities to pursue therapies to ameliorate vascular dysfunction in the aging brain of AD and CAA patients.

Keywords: aging; brain vasculome; cerebral amyloid angiopathy; cerebral endothelial transcriptome.


Conflict of interest statement

None.

Figures

FIGURE 1
FIGURE 1
Cerebral endothelial transcriptome in CAA/AD mouse model and age‐matched WT mouse. (a) The expression of markers specific to different brain cells. Data were from three microarray samples in each group, same in the following Figures 1–5 unless otherwise specified. (b) Heatmap of differentially expressed genes in Tg and WT mouse brain endothelium. The average gene expression was determined for each group and was subjected to hierarchical clustering analysis. (c) Principal component analysis of the endothelial transcriptome in Tg and WT mice. (d) The correlation of gene expression change and (e) the extent of gene expression change between Tg and WT mouse brain endothelium. Fold change of gene expression in 9‐month‐old brain versus 4‐month‐old brain was determined respectively for Tg and WT mice. (f) Endothelial expression of Lrp1 in Tg and WT mice. (g) Immunohistochemistry staining of Lrp1 in Tg and WT mouse brain cortex, the same as used for transcriptome analysis. (h) Relative intensity of Lrp1 staining (n = 3 per group). Data are presented as mean ± SD. *p < 0.05
FIGURE 2
FIGURE 2
Functional alterations induced by vascular Aβ accumulation in cerebral endothelium. Genes were ranked based on differential expression in 9‐month‐old brain compared to 4‐month‐old brain for Tg and WT mice respectively. The enrichment of pathways with differentially expressed genes were analyzed by GSEA. The normalized enrichment score (NES) is shown for the most affected gene sets enriched with upregulated (red) and downregulated (blue) genes
FIGURE 3
FIGURE 3
Impaired neurovascular coupling with vascular Aβ accumulation. The expression change of (a) neurotransmitter receptors and (b) voltage‐gated calcium channel and Ca/calmodulin‐dependent protein kinases in Tg and WT mouse brain endothelium. Each dot represents a specific gene. The fold change of each gene in 9‐month‐old brain versus 4‐month‐old brain was determined respectively for Tg and WT mice. (c) Heatmap of cell adhesion molecules and cell junction molecules in Tg and WT mouse brain endothelium. (d) RT‐PCR analysis of Gria2, Gabbr1, Cacnb3, and Cacnb4 expression in HBMEC treated by Aβ40 versus vehicle (n = 5). Data are presented as mean ± SD. *p < 0.05
FIGURE 4
FIGURE 4
Aberrant cell cycle reentry in CAA/AD mouse brain endothelium. (a) Heatmap of DNA replication‐related genes in Tg and WT endothelium. (b) The expression of DNA replication regulators (Mcm3, Pold1, Pole3, and Rfc4) in Tg and WT mouse brain endothelium. (c) The differential activation status of DNA replication and cell division, (d) the expression change of markers at each cell cycle phase, and (e) the expression change of the genes involved in DNA replication and APC in Tg mouse brain endothelium during vascular Aβ accumulation. (f) RT‐PCR analysis of cell cycle‐related genes in HBMEC treated by Aβ40 versus vehicle (n = 5). (g) FISH assay of polyploidy in Tg and WT brain sections at 9‐month‐old. Data are presented as mean ± SD. *p < 0.05; **p < 0.01
FIGURE 5
FIGURE 5
Enhanced vascular inflammation in CAA/AD mouse brain endothelium. (a) The expression of genes involved in toll‐like receptor signaling pathway in Tg and WT mouse brain endothelium. (b) Immunohistochemistry staining of Irf7 in Tg and WT mouse brain cortex, the same area used for endothelium transcriptome analysis. (c) Relative intensity of Irf7 staining (n = 3 per group). (d) RT‐PCR analysis of inflammation genes in HBMEC treated by Aβ40 versus vehicle (n = 5). (e) TLR4 inhibitor TAK‐242 reversed the gene expression changes induced by Aβ40 in HBMEC. Data are presented as mean ± SD. *p < 0.05
FIGURE 6
FIGURE 6
Comparison of cerebral endothelial alterations in various brain disorders. (a) The brain endothelial gene expression correlation across various disease conditions. The correlation of endothelial gene expression change between pairs of conditions was presented as scatter plots in the upper triangle matrix. The Pearson correlation coefficients were presented by the color and size of each dot in the lower triangle matrix. (b) Hierarchical clustering of significantly changed endothelial genes (fold change >1.2; FDR <0.05) in each disease condition. (c) Functional alterations in brain endothelium of each disease condition. GSEA was performed on genes preranked according to their expression changes in each disease condition compared with corresponding control. HTN: hypertension; TBI: traumatic brain injury; EAE: experimental autoimmune encephalomyelitis. HTN and diabetes data were obtained from (Guo et al., 2019); TBI, epilepsy, stroke, and EAE data were obtained from GSE95401 (Munji et al., 2019). For CAA/AD, HTN, diabetes, epilepsy, stroke, and EAE data, n = 3 per group; for TBI data, n = 3 for TBI group, n = 2 for control group
FIGURE 7
FIGURE 7
Cell cycle activation status in different brain cells of AD patients. (a) Heatmap of differentially expressed genes in different brain cells of AD patients. (b) Functional alterations in different brain cells with AD development. (c) The expression changes of genes involved in DNA replication in different brain cells of AD patients. (d) The expression of Mcm3, Pold1, Pole3, and Rfc4 in different brain cells of AD patients. (e) Receiver–operator characteristic (ROC) curves for DNA replication regulators in brain endothelium. (f) The expression changes of genes involved in APC in different brain cells of AD patients. (g) The expression change of M phase regulators in AD endothelium. The expression data of AD patients used here were obtained from GSE125050 (Srinivasan et al., 2020). Astro: astrocyte; Neuro: Neuron; Endo: endothelial cell; Mye: myeloid. For Astro, n = 7 (AD group), n = 12 (control group); for Endo, n = 10 (AD group), n = 17 (control group); for Mye, n = 10 (AD group), n = 15 (control group); for Neuro, n = 21 (AD group), n = 21 (control group). *p < 0.05; **p < 0.01; ns, not significant in AD versus control
FIGURE 8
FIGURE 8
A schematic overview of cerebral endothelial alterations in the context of CAA. Vascular Aβ accumulation is associated with aberrant cell cycle activation, disrupted neurovascular coupling, and enhanced inflammation in cerebral endothelium. Red color: upregulation; blue color: downregulation

References

    1. Arvanitakis, Z. , Leurgans, S. E. , Wang, Z. , Wilson, R. S. , Bennett, D. A. , & Schneider, J. A. (2011). Cerebral amyloid angiopathy pathology and cognitive domains in older persons. Annals of Neurology, 69(2), 320–327. 10.1002/ana.22112 - DOI - PMC - PubMed
    1. Bernardes‐Silva, M. , Anthony, D. C. , Issekutz, A. C. , & Perry, V. H. (2001). Recruitment of neutrophils across the blood‐brain barrier: The role of E‐ and P‐selectins. Journal of Cerebral Blood Flow and Metabolism, 21(9), 1115–1124. 10.1097/00004647-200109000-00009 - DOI - PubMed
    1. Bonda, D. J. , Evans, T. A. , Santocanale, C. , Llosá, J. C. , Viňa, J. , Bajic, V. P. , Castellani, R. J. , Siedlak, S. L. , Perry, G. , Smith, M. A. , & Lee, H.‐G. (2009). Evidence for the progression through S‐phase in the ectopic cell cycle re‐entry of neurons in Alzheimer disease. Aging, 1(4), 382–388. 10.18632/aging.100044 - DOI - PMC - PubMed
    1. Bonda, D. J. , Lee, H. P. , Kudo, W. , Zhu, X. , Smith, M. A. , & Lee, H. G. (2010). Pathological implications of cell cycle re‐entry in Alzheimer disease. Expert Reviews in Molecular Medicine, 12, e19. 10.1017/S146239941000150X - DOI - PMC - PubMed
    1. Boyle, P. A. , Yu, L. , Nag, S. , Leurgans, S. , Wilson, R. S. , Bennett, D. A. , & Schneider, J. A. (2015). Cerebral amyloid angiopathy and cognitive outcomes in community‐based older persons. Neurology, 85(22), 1930–1936. 10.1212/WNL.0000000000002175 - DOI - PMC - PubMed

Publication types

MeSH terms

Substances