. 2022 Nov;70(11):2169-2187.
doi: 10.1002/glia.24244. Epub 2022 Jul 19.

Microglia deficiency accelerates prion disease but does not enhance prion accumulation in the brain

Affiliations

Microglia deficiency accelerates prion disease but does not enhance prion accumulation in the brain

Barry M Bradford et al. Glia. 2022 Nov.

Abstract

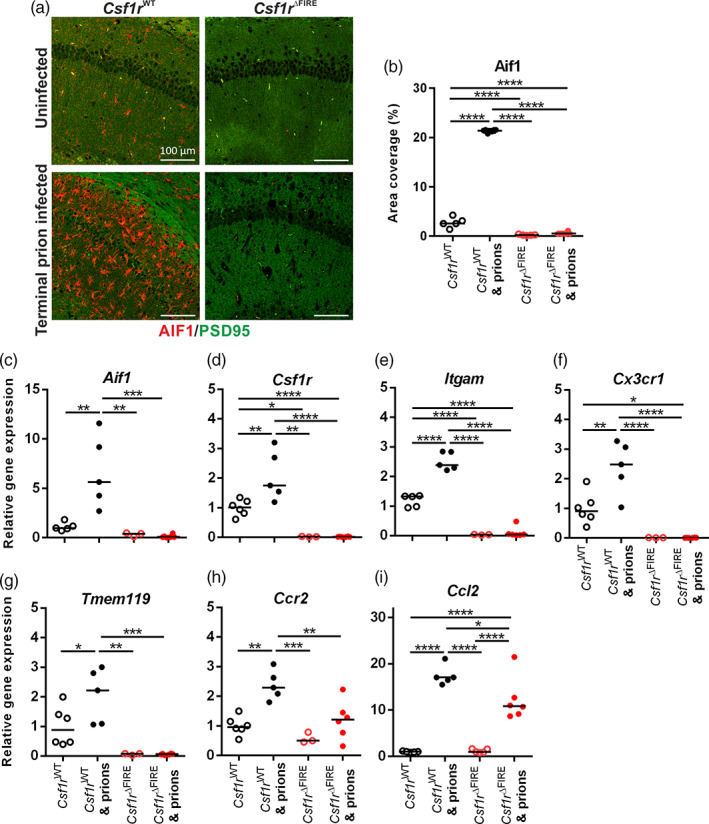
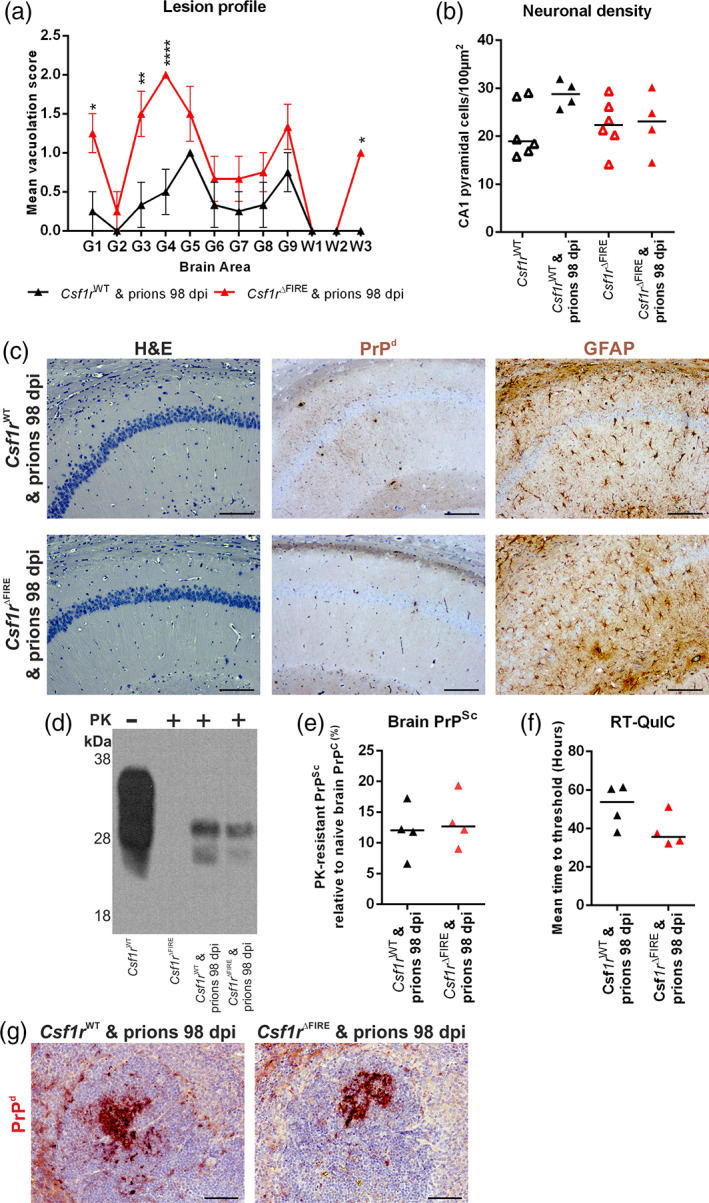
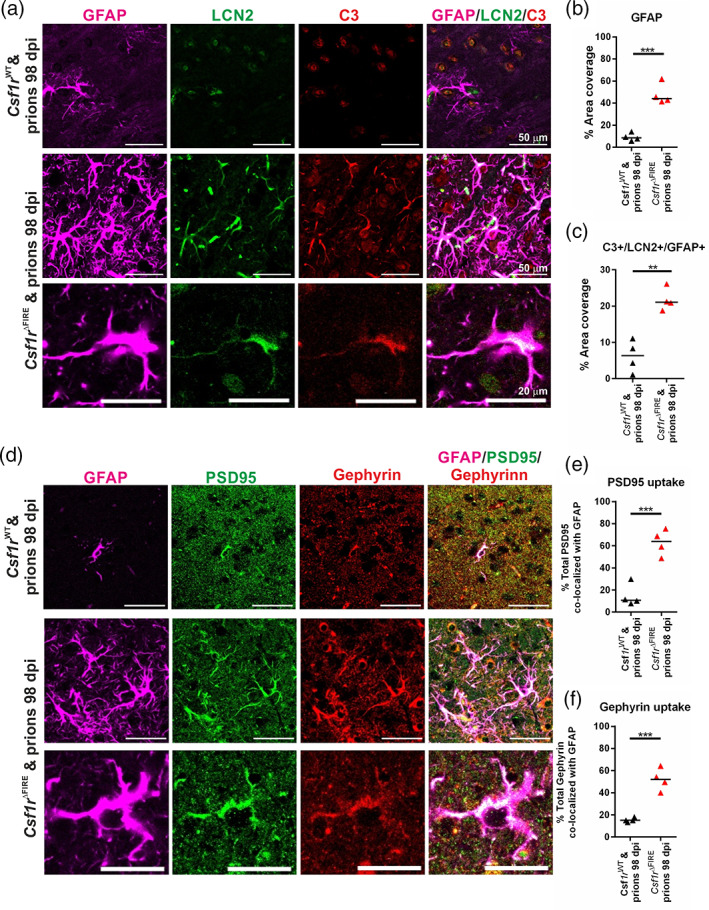
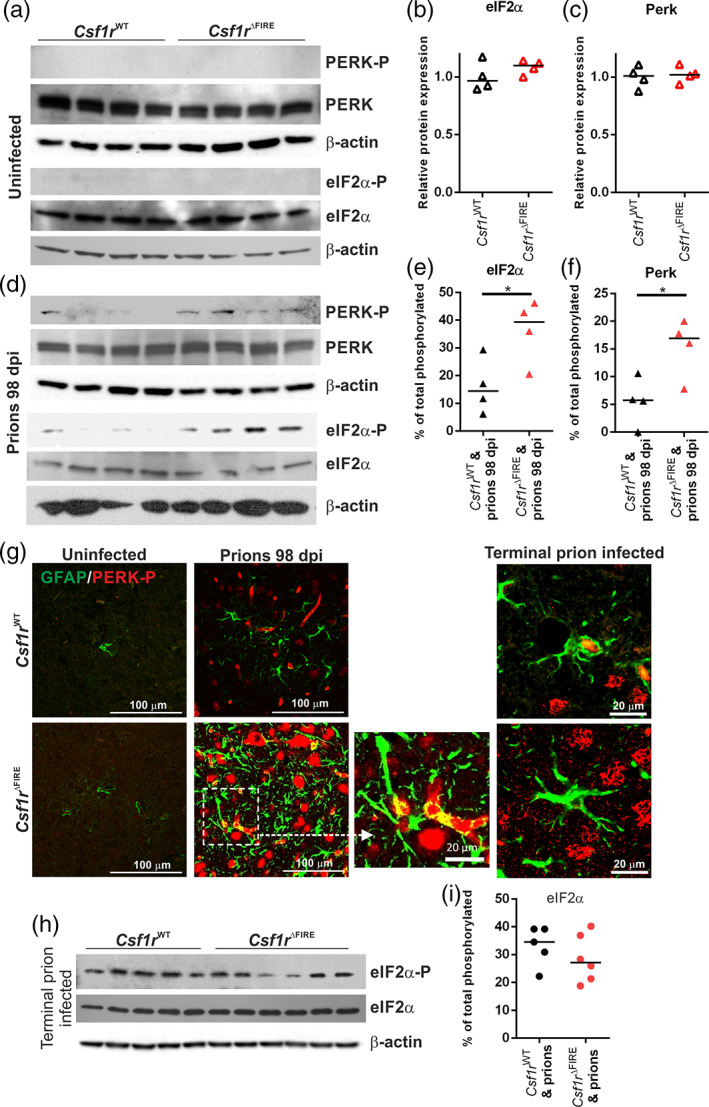
Prion diseases are transmissible, neurodegenerative disorders associated with misfolding of the prion protein. Previous studies show that reduction of microglia accelerates central nervous system (CNS) prion disease and increases the accumulation of prions in the brain, suggesting that microglia provide neuroprotection by phagocytosing and destroying prions. In Csf1rΔFIRE mice, the deletion of an enhancer within Csf1r specifically blocks microglia development, however, their brains develop normally and show none of the deficits reported in other microglia-deficient models. Csf1rΔFIRE mice were used as a refined model in which to study the impact of microglia-deficiency on CNS prion disease. Although Csf1rΔFIRE mice succumbed to CNS prion disease much earlier than wild-type mice, the accumulation of prions in their brains was reduced. Instead, astrocytes displayed earlier, non-polarized reactive activation with enhanced phagocytosis of neuronal contents and unfolded protein responses. Our data suggest that rather than simply phagocytosing and destroying prions, the microglia instead provide host-protection during CNS prion disease and restrict the harmful activities of reactive astrocytes.

Keywords: central nervous system; microglia; neurodegeneration; prion disease; reactive astrocyte.


Conflict of interest statement

The authors declare no conflicts of interest.

Figures

FIGURE 1
FIGURE 1
Csf1r ΔFIRE mice rapidly succumb to prion disease. (a) Survival curve following intracerebral injection of ME7 prions into Csf1r WT or Csf1r ΔFIRE mice (N = 5–6 mice/group). Log‐rank Mantel Cox test, P = .0018. (b) Catwalk XT automated gait analysis weekly assessment of hind base of stance in age‐matched uninfected Csf1r WT or Csf1r ΔFIRE mice. Points represent group mean and error bars 95% confidence interval. (c) Weekly assessment of hind base of stance in prion‐infected Csf1r WT or Csf1r ΔFIRE mice. (d) Weekly assessment of right hind (RH) paw print area in age‐matched uninfected mice. Two‐way ANOVA. (e) Weekly assessment of right hind (RH) paw print area in prion‐infected mice. (f) Weekly assessment of right front (RF) paw intensity in age‐matched uninfected mice. (g) Weekly assessment of right front (RF) paw intensity in prion‐infected mice. *P < .05; **P < .005; ****P < .0001; Two‐way ANOVA, Sidak's multiple comparisons test. Panels B‐G, N = 6–10 mice/group
FIGURE 2
FIGURE 2
Csf1r ΔFIRE mice succumb to prion disease in the absence of microglia. (a) Immunohistochemical assessment of AIF1 (red) in hippocampus CA1 of terminal prion infected or age‐matched uninfected Csf1r WT or Csf1r ΔFIRE mice. Sections were counterstained to detect the post‐synaptic protein PSD95 (green). Scale bars = 100 μm. (b) AIF1 immunostaining quantitation expressed as % area coverage in hippocampus CA1. (c–i) RT‐qPCR of (c) Aif1, (d) Csf1r, (e) Itgam, (f) Cx3cr1, (g) Tmem119, (h) Ccr2, and (i) Ccl2 mRNA in uninfected or terminal prion‐infected brains from Csf1r WT or Csf1r ΔFIRE mice. Points show individual mice. Horizontal bar = median. *P < .05; **P < .01; ****P < .0001; ANOVA. N = 5–6 mice/group
FIGURE 3
FIGURE 3
Microglia‐deficiency effects on prion‐specific vacuolation and prion accumulation. (a) Hematoxylin and eosin stained hippocampus CA1 of terminal prion infected or age‐matched uninfected Csf1r WT or Csf1r ΔFIRE mice. Scale bars = 200 μm. (b) Hippocampal CA1 pyramidal cell density in terminal prion infected Csf1r WT or Csf1r ΔFIRE mice. Student's t‐test. (c) Assessment of neuronal condition expressed as percentage of total neurons pyknotic in terminal prion infected Csf1r WT or Csf1r ΔFIRE mice. Student's t‐test. (d) Lesion profile analysis of prion‐infected brains. Points represent the mean vacuolation score, error bars = ± SEM. Two‐way ANOVA, Sidak's multiple comparisons test. **P < .005; ****P < .0001. (e) Microarray analysis of relative gene expression of Prnp in the brain. Student's t‐test. (f) Microarray analysis of relative gene expression of Csf1 in the brain. Student's t‐test, ****P < .0001. (g) Western blot analysis of uninfected Csf1r WT and Cs1fr ΔFIRE mouse brain, probed with anti‐PrP antibody clone BH1. Relative protein sizes indicated in kilodaltons (kDa). (h) Quantitation of relative brain PrPC expression in the brains of uninfected Csf1r WT and Cs1fr ΔFIRE mice. Student's t‐test. (i) Western blot analysis of terminal prion‐infected Csf1r WT and Cs1fr ΔFIRE mouse brain, probed with anti‐PrP antibody clone BH1. Relative protein sizes indicated in kilodaltons (kDa). (j) Quantitation of relative PrPSc accumulation in the brains of terminal prion‐infected Csf1r WT and Cs1fr ΔFIRE mice. Students t‐test. ***P < .001. Panels a–d, N = 5–6 mice/group. Panels e and f, 3 mice/group. Panels g–j, N = 3–6 mice/group. Panels b, c, e, f, h, and j. points show individual mice, horizontal bar = median.
FIGURE 4
FIGURE 4
Microglial deficiency reduces terminal neuropathology. (a, c, e) Immunohistochemical assessment of (a) PrPd accumulation, (c) GFAP expression and (e) CD44 expression (brown) in the hippocampus of terminal prion infected or age‐matched uninfected Csf1r WT and Cs1fr ΔFIRE mice. DAB (brown) immunostaining lightly counterstained with hematoxylin (blue). Scale bars = 500 μm. (b) PrPd immunostaining quantified by relative intensity. (d) GFAP immunostaining quantified by relative intensity. (f) CD44 immunostaining quantified by relative intensity. Points show individual mice. Horizontal bar = median. Student's t‐test, **P < .005. N = 4–5 mice/group
FIGURE 5
FIGURE 5
Microglia‐deficiency alters astrocyte response to prions. RT‐qPCR analysis of (a) Gfap, (b) Cd44, (c) Cd44v6, (d) Gbp2, (e) Psmb8, (f) Srgn, (g) Tnf, (h) B3gnt5, and (i) Ptx3 mRNA in the brains of terminal prion infected or age‐matched uninfected Csf1r WT or Csf1r ΔFIRE mice. Points show individual mice. Horizontal bar = median. *P < .05; **P < .005; ***P < .001; ****P < .0001; ANOVA. N = 3–6 mice/group
FIGURE 6
FIGURE 6
Microglial deficiency accelerates prion vacuolation but not brain or peripheral prion accumulation. (a) Lesion profile analysis of prion‐infected brains at 98 dpi (N = 4 mice/group). Points represent the mean vacuolation score, error bars = SEM. *P < .05; **P < .01; ****P < .0001; two‐way ANOVA, Sidak's multiple comparisons test. (b) Hippocampal CA1 pyramidal neuron density was assessed in 98 dpi prion‐infected mice and age‐matched uninfected (N = 4–6 mice/group). Points show individual mice, bar = median. Not significantly different, ANOVA. (c) Hematoxylin and eosin (H&E) stained sections used for vacuolation and neuronal density analyses. Immunohistochemical analysis of PrPd accumulation and GFAP expression in 98 dpi prion‐infected Csf1r WT and Csf1r ΔFIRE hippocampus CA1. Scale bars = 200 μm. (d) Western blot analysis as indicated to determine the relative amount of PrPSc accumulation in the brains of mice from each group at 98 dpi with prions. (e) Quantitation of PrPSc levels in brains of 98 dpi prion‐infected Csf1r WT and Csf1r ΔFIRE mice. Points show individual mice, bar = median. Not significantly different, Student's t‐test. (F) Relative prion seeding activities in brains at 98 dpi with prions were quantified in vitro by RT‐QuIC expressed as mean time to threshold. Points show individual mice, bar = median. Not significantly different, Student's t‐test. (g) Immunohistochemical analysis of PrPd accumulation in spleens of prion‐infected Csf1r WT and Csf1r ΔFIRE mice at 98 dpi. PrPd immunostaining (red) counterstained with hematoxylin (blue). Scale bar = 100 μm. Panels c–g, N = 4 mice/group
FIGURE 7
FIGURE 7
Accelerated astrocyte activation in the absence of microglia. (a) Superior colliculus (G3) and (b) hypothalamus (G4) neuronal density was assessed via quantitation of the density of NeuN+ cells in 98 dpi prion‐infected or age‐matched uninfected Csf1r WT and Csf1r ΔFIRE mice. Not significantly different, ANOVA. N = 2–5 mice/group. (c) Hematoxylin and eosin (H&E) stained superior colliculus in 98 dpi prion‐infected Csf1r WT and Csf1r ΔFIRE mice. Scale bars = 100 μm. (d) Immunohistochemical assessment of CD44 expression in 98 dpi prion‐infected Csf1r WT and Cs1fr ΔFIRE superior colliculus. Scale bars = 200 μm. (e) Quantitation of CD44% area coverage in superior colliculus. Points show individual mice. Horizontal bar = median. *P < .05, Student's t test. N = 4 mice/group
FIGURE 8
FIGURE 8
Increased astrocyte synaptic phagocytosis in the absence of microglia (a) Immunofluorescent assessment of GFAP (violet), lipocalin2 (LCN2, green) and complement component C3 (red) in 98 dpi prion‐infected Csf1r WT and Cs1fr ΔFIRE superior colliculus. Scale bars = 50 or 20 μm as indicated. (b) Quantitation of GFAP % area coverage in superior colliculus. (c) Quantitation of C3+/LCN2+/GFAP+ astrocytes. (d) Immunofluorescent assessment of GFAP (violet), and the post‐synaptic proteins PSD95 (green) and gephyrin (red) in 98 dpi prion‐infected Csf1r WT and Cs1fr ΔFIRE superior colliculus. Scale bars = 50 or 20 μm as indicated. (E) quantitation of PSD95 uptake by astrocytes expressed as % of total PSD95 colocalized with GFAP. (F) Quantitation of gephyrin uptake by astrocytes expressed as % of total gephryin colocalized with GFAP. Points show individual mice. Horizontal bar = median. **P < .01; ***P < .001, Student's T test. N = 4 mice/group
FIGURE 9
FIGURE 9
Increased unfolded protein response pathway is associated with earlier astrocyte activation. (a) Western blot analyses of age‐matched uninfected Csf1r WT and Cs1fr ΔFIRE mouse brains for unfolded protein response components as indicated, β‐Actin displayed as a loading control. (b) Quantitation of relative expression levels of eIF2α in uninfected Csf1r WT and Cs1fr ΔFIRE mouse brains. Not significantly different, Student's t‐test. (c) Quantitation of relative expression levels of PERK uninfected Csf1r WT and Cs1fr ΔFIRE mouse brain. Not significantly different, Student's t‐test. (d) Western blot analysis of 98 dpi prion‐infected Csf1r WT and Cs1fr ΔFIRE mouse brain for unfolded protein response components as indicated. (e) Quantitation of the percentage of total phosphorylated eIF2α in 98 dpi prion‐infected Csf1r WT and Cs1fr ΔFIRE mouse brain. *P < .05, Student's t‐test. (f) Quantitation of the percentage of total phosphorylated PERK in 98 dpi prion‐infected Csf1r WT and Cs1fr ΔFIRE mouse brain. *P < .05, Student's t‐test. (g) Immunohistochemical analysis of phosphorylated PERK (PERK‐P; red) and GFAP (green) in 98 dpi prion infected, terminal prion infected and age‐matched uninfected Csf1r WT and Cs1fr ΔFIRE superior colliculus (G3). Scale bars = 100 μm or 20 μm as indicated. (h) Western blot analysis of terminal prion‐infected brain homogenates probed for unfolded protein response components as indicated, β‐Actin displayed as a loading control. (i) Quantitation of the percentage of total phosphorylated eIF2α in terminal prion‐infected Csf1r WT and Cs1fr ΔFIRE mouse brains. Not significantly different, Student's t‐test. Points show individual mice. Panels A‐G, N = 4 mice/group. Horizontal bar = median. Panels H&I, N = 5–6 mice/group

References

    1. Atarashi, R. , Sano, K. , Satoh, K. , & Nishida, N. (2011). Real‐time quaking‐induced conversion. Prion, 5(3), 150–153. - PMC - PubMed
    1. Badimon, A. , Strasburger, H. J. , Ayata, P. , Chen, X. , Nair, A. , Ikegami, A. , Hwang, P. , Chan, A. T. , Graves, S. M. , Uweru, J. O. , Ledderose, C. , Kutlu, M. G. , Wheeler, M. A. , Kahan, A. , Ishikawa, M. , Wang, Y.‐C. , Loh, Y.‐H. E. , Jiang, J. X. , Surmeier, D. J. , … Schaefer, A. (2020). Negative feedback control of neuronal activity by microglia. Nature, 586, 417–423. - PMC - PubMed
    1. Benilova, I. , Reilly, M. , Terry, C. , Wenborn, A. , Schmidt, C. , Marinho, A. T. , Risse, E. , Al‐Doujaily, H. , Wiggins De Oliveira, M. , Sandberg, M. K. , Wadsworth, J. D. F. , Jat, P. S. , & Collinge, J. (2020). Highly infectious prions are not directly neurotoxic. Proceedings of the National Academy of Sciences USA, 117(38), 23815–23822. - PMC - PubMed
    1. Beringue, V. , Demoy, M. , Lasmezas, C. I. , Gouritin, B. , Weingarten, C. , Deslys, J. P. , Andreux, J. P. , Couvreur, P. , & Dormont, D. (2000). Role of spleen macrophages in the clearance of scrapie agent early in pathogenesis. Journal of Pathology, 190(4), 495–502. - PubMed
    1. Bradford, B. M. , Reizis, B. , & Mabbott, N. A. (2017). Oral prion disease pathogenesis is impeded in the specific absence of CXCR5‐expressing dendritic cells. Journal of Virology, 91(10), e00124–e00117. - PMC - PubMed

Publication types