. 2022 Aug;600(16):3865-3896.
doi: 10.1113/JP283012. Epub 2022 Aug 1.

Novel types of frequency filtering in the lateral perforant path projections to dentate gyrus

Affiliations

Novel types of frequency filtering in the lateral perforant path projections to dentate gyrus

Julian Quintanilla et al. J Physiol. 2022 Aug.

Abstract

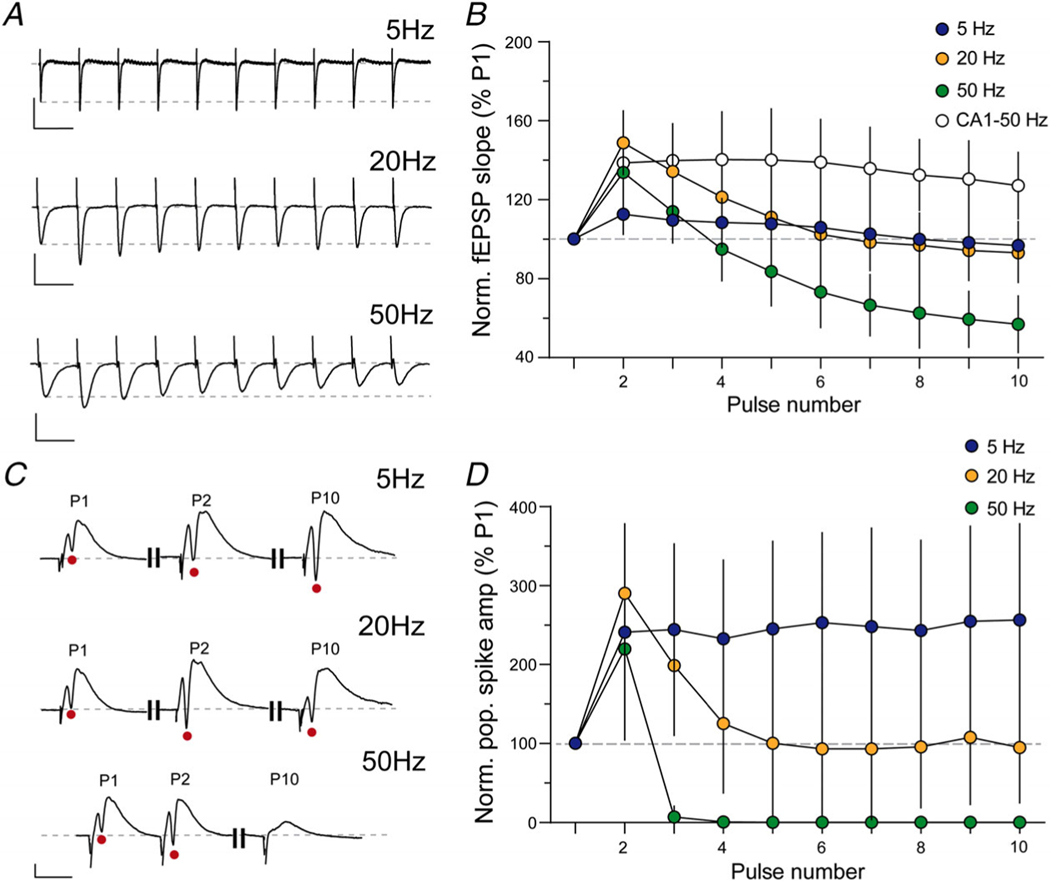
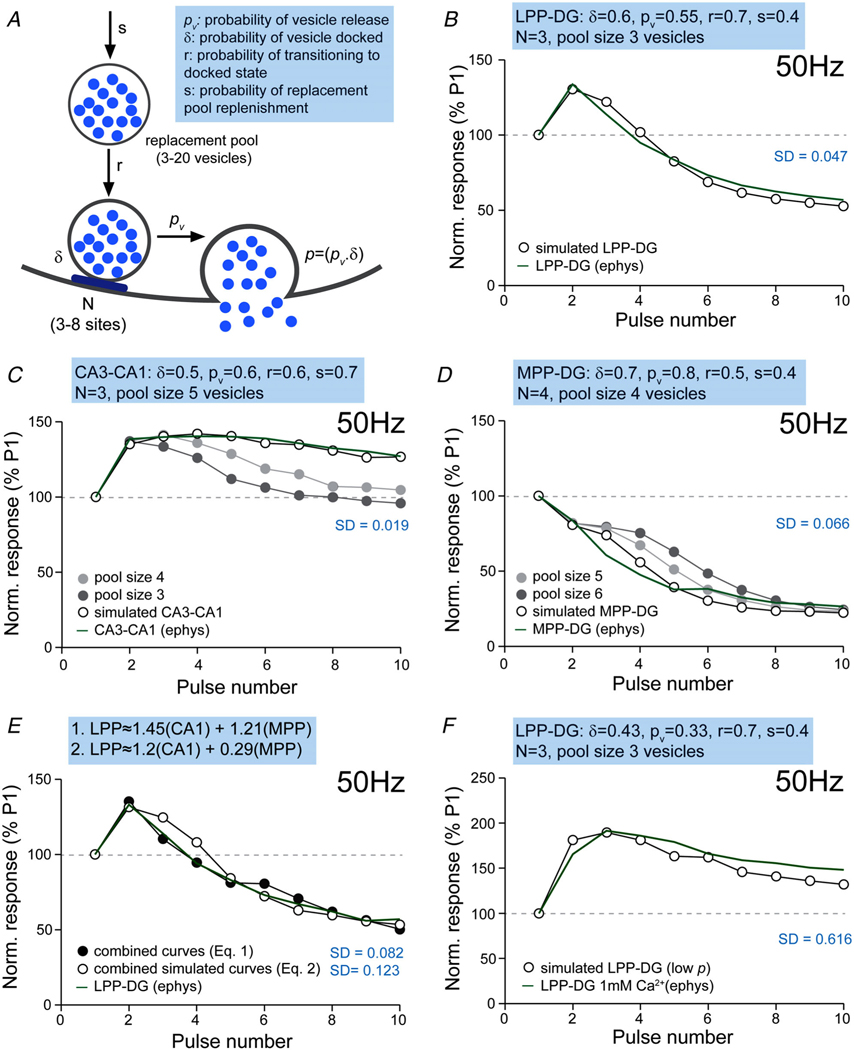
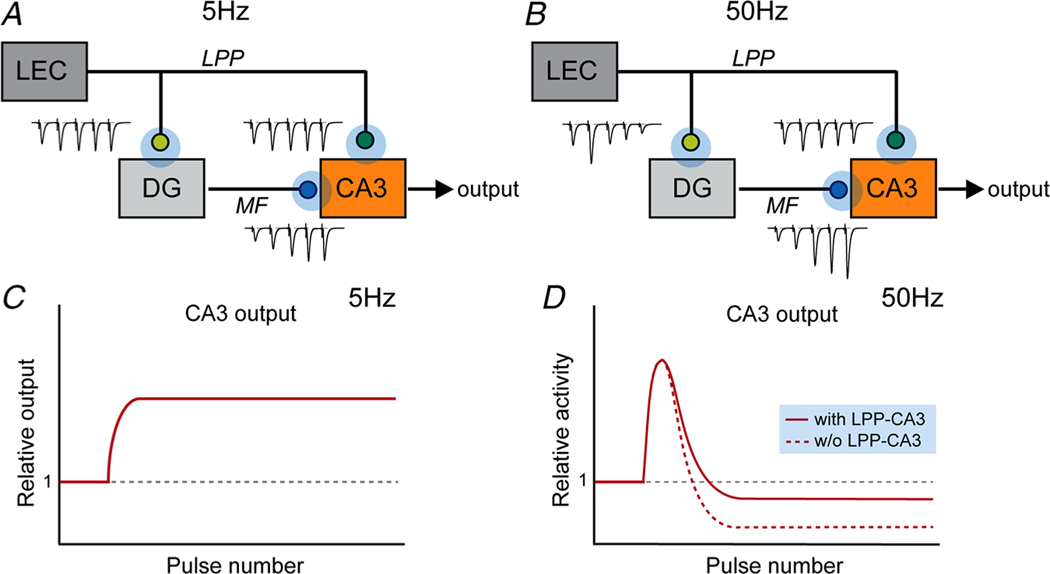
Despite its evident importance to learning theory and models, the manner in which the lateral perforant path (LPP) transforms signals from entorhinal cortex to hippocampus is not well understood. The present studies measured synaptic responses in the dentate gyrus (DG) of adult mouse hippocampal slices during different patterns of LPP stimulation. Theta (5 Hz) stimulation produced a modest within-train facilitation that was markedly enhanced at the level of DG output. Gamma (50 Hz) activation resulted in a singular pattern with initial synaptic facilitation being followed by a progressively greater depression. DG output was absent after only two pulses. Reducing release probability with low extracellular calcium instated frequency facilitation to gamma stimulation while long-term potentiation, which increases release by LPP terminals, enhanced within-train depression. Relatedly, per terminal concentrations of VGLUT2, a vesicular glutamate transporter associated with high release probability, were much greater in the LPP than in CA3-CA1 connections. Attempts to circumvent the potent gamma filter using a series of short (three-pulse) 50 Hz trains spaced by 200 ms were only partially successful: composite responses were substantially reduced after the first burst, an effect opposite to that recorded in field CA1. The interaction between bursts was surprisingly persistent (>1.0 s). Low calcium improved throughput during theta/gamma activation but buffering of postsynaptic calcium did not. In all, presynaptic specializations relating to release probability produce an unusual but potent type of frequency filtering in the LPP. Patterned burst input engages a different type of filter with substrates that are also likely to be located presynaptically. KEY POINTS: The lateral perforant path (LPP)-dentate gyrus (DG) synapse operates as a low-pass filter, where responses to a train of 50 Hz, γ frequency activation are greatly suppressed. Activation with brief bursts of γ frequency information engages a secondary filter that persists for prolonged periods (lasting seconds). Both forms of LPP frequency filtering are influenced by presynaptic, as opposed to postsynaptic, processes; this contrasts with other hippocampal synapses. LPP frequency filtering is modified by the unique presynaptic long-term potentiation at this synapse. Computational simulations indicate that presynaptic factors associated with release probability and vesicle recycling may underlie the potent LPP-DG frequency filtering.

Keywords: VGLUT2; frequency facilitation; gamma oscillations; hippocampus; lateral entorhinal cortex; long-term potentiation; simulations; transmitter release.


Figures

Figure 1.
Figure 1.. The LPP–DG synapse operates as a low pass filter
A, representative traces recorded from the DG OML in response to LPP stimulation with 10 pulse trains delivered at 5, 20 and 50 Hz (scale bars: 5 Hz: y = 1 mV, x = 200 ms; 20 Hz: y = 1 mV, x = 50 ms; 50 Hz: y = 1 mV, x = 20 ms). B, graph summarizing the within-train facilitation of the fEPSP slope for each stimulation frequency. Note the striking difference in the nature of the responses generated at LPP–DG (green circles) and CA3–CA1 (white circles) synapses following stimulation at 50 Hz (for all frequencies, n = 21–22 slices/9 animals). C, representative traces showing the first two and final responses recorded from the granule cell layer with a 10-pulse stimulation train delivered to the LPP at 5, 20 and 50 Hz. The stimulation intensity was increased to generate a small population spike (red circles; scale bars: y = 1 mV, x = 10 ms). D, graph summarizing the within-train facilitation of the population amplitude for each stimulation frequency (5 and 20 Hz, n = 7 slices; 50 Hz, n = 10 slices; n = 4 mice per frequency). Note the extreme filtering of spike output at frequencies in the γ (50 Hz) range.
Figure 2.
Figure 2.. Low pass filtering at the LPP–DG synapse is independent of MPP inputs
A, graph summarizing the fEPSP slope responses of the MPP reveals a depression across all three frequency trains (5, 20 and 50 Hz). B, infusion of the mGluRII agonist DCG IV (1 μM) markedly depressed baseline MPP fEPSPs (MPP: t2 = 9.88, *P = 0.01, average of the last 5 min before and after infusion). DCG IV infusion has much smaller effects on LPP–DG fEPSPs (LPP: t6 = 3.18, *P = 0.02; MPP vs. LPP: t8 = 9.6, ****P < 0.0001; LPP n = 7 slices/5 mice; MPP n = 3 slices/2 mice, unpaired Student’s t-test of the average of the last 5 min). C, representative traces of MPP–DG (top) and LPP–DG (bottom) responses before (black) and after (grey) DCG IV infusion. D, summary graphs showing the effects of DCG IV on LPP–DG fEPSP amplitude (**P = 0.004, paired t-test), slope (*P = 0.028) and half-width (P = 0.209) for individual slices (n = 7 slices/5 mice). E, representative traces recorded from the OML of the DG in response to LPP stimulation with a 10 pulse 50 Hz train before (black) and 40 min after (grey) bath application of DCG IV (1 μM). F, the within-train depression of fEPSP slopes of LPP–DG synapses at 50 Hz was not influenced by 40 min DCG IV infusion (F(9,54) = 1.06, P = 0.41; n = 7 slices/mice per group; two way RM-ANOVA).
Figure 3.
Figure 3.. The LPP–DG low pass filter is not dependent upon GABAergic inhibition
A, ensemble averages of LPP fEPSPs recorded from a representative slice in the absence (top) and presence (bottom) of picrotoxin (PTX; 1 μM) (scale bars: y = 0.5 mV, x = 10 ms). B, summary graphs showing the effect of PTX on the mean slope, half-width and decay τ of the LPP fEPSPs. Note that PTX significantly increased the fEPSP duration and decay time (*P = 0.012; **P = 0.007; baseline vs. PTX, paired Student’s t-test; n = 10 slices/5 mice). C, representative traces recorded from the DG OML with stimulation (10 pulses) of the LPP at 20 Hz before (black) and after (blue) PTX infusion (scale bars: y = 1 mV, x = 100 ms). D, graph showing the within-train facilitation of the fEPSP slope with 20 Hz LPP stimulation in the absence and presence of bath PTX (*P = 0.049, F(9,36) = 2.167; two-way RM-ANOVA pulse number vs. PTX; n = 5 slices/2 mice). E, representative traces showing fEPSP responses to LPP stimulation (10 pulses) at 50 Hz before (black) and after (blue) bath application of PTX (scale bars: y = 1 mV, x = 50 ms). F, graph showing the within-train facilitation of the fEPSP slope with 50 Hz LPP stimulation in the absence and presence of PTX (P = 0.371, F(9,36) = 1.125 two-way RM-ANOVA pulse number vs. PTX; n = 5 slices/2 mice). G, representative eIPSCs recorded from an exemplar granule cell in response to LPP stimulation at 5, 20 and 50 Hz (scale bars: y = 50 pA, x = 200 ms, 100 ms and 50 ms). H, graph showing the within-train facilitation of the eEPSC for each stimulation frequency (n = 7 cells/frequency/4 mice).
Figure 4.
Figure 4.. GABAergic inhibition does not shape granule cell output with LPP activation at θ, β and γ frequencies
A, ensemble average LPP-evoked fEPSP recorded from a representative slice in the absence (black) and presence (blue) of picrotoxin (PTX) showing an increase in population spike (p.s.) amplitude with PTX infusion (scale bars: y = 1 mV, x = 10 ms). B, bar graph summarizing the mean population spike amplitude before (white) and following (blue) PTX infusion (t5 = 3.10, P = 0.027, n = 6 slices/4 mice; paired Student’s t-test). C, plot of DG normalized population spike amplitude across a 10-pulse, 5 Hz train, showing that the facilitation of response amplitude is unaffected by PTX (F(9,54) = 0.9938, P = 0.4562; two-way RM-ANOVA; n = 7 slices/4 mice). D, at 20 Hz, PTX infusion significantly decreased amplitude of DG population-spike elicited by the second pulse only of a 10 pulse train (F(9,45) = 3.392, **P = 0.001, n = 6 slices/4 mice). E, PTX did not influence population spike responses to a 10-pulse, 50 Hz train; in both cases there was no detectible population spike by pulse 4 (F(9,45) = 0.0231, P > 0.999, n = 7 slices/4 mice). F, representative eIPSCs recorded from an exemplar dentate gyrus granule cell in response to stimulation of the LPP. Bath application of bicuculline (bic; blue) completely blocked the evoked response (scale bars: y = 50 pA, x = 100 ms). G, bar graphs summarizing the mean peak amplitude and decay time) of eIPSCs recorded from dentate gyrus granule cells. H, graph summarizing the normalized within-train suppression of eIPSC amplitude in response to stimulation at 5, 20 and 50 Hz frequencies (n = 7 cells/4 mice). Note that suppression of the eIPSC although evident at all frequencies shows frequency-dependence. I–K, representative eIPSCs recorded from an exemplar dentate gyrus granule cell in response to stimulation of the LPP at 5 Hz (I), 20 Hz (J) and 50 Hz (K). The evoked responses to 50 Hz stimulation are illustrated on an expanded time scale. Scale bars: 5 Hz: y = 50 pA, x = 200 ms; 20 Hz: y = 100 pA, x = 100 ms; 50 Hz: y = 100 pA, x = 100 ms (top) and 50 ms (bottom).
Figure 5.
Figure 5.. The low pass filter at the LPP–DG synapse is removed by reducing release probability
Representative traces showing LPP responses to stimulation trains (10 pulses) delivered at θ (5 Hz) (A), β (20 Hz) (B) and γ (50 Hz) (C) frequencies under high (2.5 mM; top) and low (1 mM; bottom) Ca2+ conditions. Corresponding line graphs (right) illustrate the nature of within-train facilitation and suppression under the different Ca2+ conditions (n = 7–12 slices/group; n = 4–5 mice/group). Note the marked increase in facilitation, particularly at higher stimulation frequencies, when external Ca2+ is reduced. Scale bars: 5 Hz: y = 1 mV, x = 200 ms; 20 Hz: y = 1 mV, x = 50 ms; 50 Hz: y = 1 mV, x = 20 ms.
Figure 6.
Figure 6.. The LPP–DG low pass filter does not require activation of Ca2+-dependent SK channels
A, ensemble averages of fEPSPs recorded from a representative slice in the absence (top) and presence (bottom) of the SK channel antagonist apamin (200 nM; scale bars: y = 0.5 mV, x = 10 ms). B–D, graphs showing the effect of apamin upon the mean amplitude (B), slope (C) and decay τ (D) of LPP-evoked fEPSPs (bars show group means; points show individual slice measures). Apamin had no significant effect on any of the fEPSP parameters (amplitude: P = 0.309; slope: P = 0.267; τ: P = 0.053 baseline vs. apamin; paired Student’s t-test; n = 14 slices/7 mice). E, representative traces showing LPP responses to 10 pulse stimulation trains delivered at 50 Hz before (top) and after (bottom) apamin infusion (scale bars: y = 1 mV; x = 50 ms). F, graph summarizing the within-train facilitation of fEPSP slope with and without apamin present. The inhibitor significantly increased facilitation only during the second pulse (*P = 0.027 at pulse 2, F(9,63) = 2.290 two-way RM-ANOVA, n = 8 slices/4 mice). G, representative traces showing fEPSP responses to field CA3–CA1 Schaffer-commissural stimulation at 50 Hz (10-pulse trains) before (top) and after (bottom) apamin infusion. H, the within-train facilitation was enhanced 40 min after apamin infusion onset through the duration of the train (F(9,54) = 4.67, ****P < 0.0001; n = 7 slices/5 mice; two-way RM-ANOVA).
Figure 7.
Figure 7.. LTP modifies synaptic filtering at the LPP–DG synapse
A, LTP was induced in the LPP–DG synapses via high frequency stimulation (HFS, at upward arrow) that resulted in a 50% increase in response compared to slices that did not receive HFS. Representative traces show LPP responses before and 60 min after HFS (right) or control low frequency stimulation (left) (scale bars: y = 0.5 mV, x = 5 ms) (n = 12 slices/7 mice). B, the mean response (fEPSP slope) recorded 55–60 min post-HFS, normalized to same-slice baseline, was markedly potentiated relative to similarly normalized measures from control slices (t(17) = 6.14, ****P < 0.0001, paired t-test of the average of the last 5 min). C, top: representative traces of paired-pulse stimulation of the LPP–DG (40 ms between pulses) before (black) and 60 min after (red) LPP-LTP induction. Bottom: PPF of the fEPSP slope was reduced 60 min after inducing LPP-LTP relative to baseline levels (t4 = 3.02, n = 5 slices/3 mice, *P = 0.039; scale bars: y = 0.5 mV, x = 5 ms). D, responses to trains of 5, 20 and 50 Hz stimulation applied to the LPP before HFS (or control LFS) reveal no differences between the groups (5 Hz: F(9,135) = 1.85, P > 0.05; 20 Hz: F(9,153) = 0.75, P > 0.05; 50 Hz: F(9,135) = 1.56, P > 0.05; two-way RM-ANOVA). E, responses to stimulation trains applied to the LPP 45–60 min after LTP induction revealed striking differences in the pattern of frequency facilitation for slices that were potentiated compared to those (control) that were not. At 5 Hz, facilitation is sustained throughout the train in control slices but was absent in slices that had been potentiated (interaction between pulse number and groups: F(9,162) = 5.41, ****P < 0.0001). The frequency facilitation profiles are also significantly different between control and LTP slices in response to 20 Hz stimulation (interaction F(9,153) = 5.78, ****P < 0.0001) and 50 Hz (F(9,135) = 5.85, ****P < 0.0001). For all panels n = 11 slices/7 mice, unless otherwise specified.
Figure 8.
Figure 8.. VGLUT2 is selectively concentrated in LPP terminals
A, representative photomicrographs of VGLUT1- and VGLUT2-immunoreactivity (ir) in mouse hippocampal subfields. The shaded boxes illustrate the sample fields used for FDT analyses of terminals in the DG OML for the LPP and CA1 stratum radiatum (sr) for CA3–CA1 terminals. Calibration bar, 200 μm. ml, molecular layer of the DG; sg, stratum granulosum; slm, stratum lacunosum-moleculare; sp, stratum pyramidale. B, photomicrograph of VGLUT2-ir in the LPP field. Inset shows double-labelling for both VGLUT2 (green) and Syt7 (red) in the LPP field; double-labelled profiles are seen as either touching or overlapping (yellow). Calibration bar, 1 μm; 0.6 μm for inset. C, intensity frequency distribution curves for VGLUT2-ir in Syt-7 positive terminals in CA1 sr and the LPP (F(50,400) = 63.52; ***P < 0.0001; n = 5 mice/group); plots show group mean ± SEM values throughout (note, some error bars are short and covered by symbols for panels C, E and G). D, bar graph showing there is a greater percentage of terminals with high density VGLUT2-ir in the LPP field as compared to CA1 sr (F(2,12) = 84.56, P < 0.0001; one-way AVOVA; ***P < 0.0001, Tukey’s test; high density is ≥ 100 in C and E). Note that percentage of synapses with high density VGLUT2-ir is not significantly different between the LPP and MPP fields (P = 0.558, Tukey’s test). E, intensity frequency distribution curves for VGLUT1-ir in Syt-7 positive presynaptic terminals in CA1 sr and the LPP (F(31,248) = 5.533; ***P < 0.0001; n = 5 mice/group). F, bar graph showing the percentage of terminals with high density (≥100) levels of VGLUT1-ir (F(2,12) = 1.056, P = 0.3781). G, intensity frequency distribution curves for Syt7-ir in CA1 sr and the LPP (F(50,400) = 1.358; P = 0.0602). H, bar graph showing the percentage of terminals with high density (≥100) levels of Syt7-ir (P = 0.8859; paired Student’s t-test). I, photomicrographs of VGLUT1-ir and VGLUT2-ir in the DG molecular layer ipsilateral to an entorhinal cortex lesion (Les) and on the contralateral, control (Con) side; asterisks denote the loss of immunolabelling in the perforant path terminal fields. Calibration bar, 200 μm.
Figure 9.
Figure 9.. Monte Carlo simulations of a two-step release model recapitulate the output curves across three different types of synapse
A, schematic illustration of the variables within the two-step model where N represents the number of docking sites. B, using physiologically constrained parameters, the two-step model (white circles) reliably recapitulates the electrophysiologically recorded responses (green line) following γ frequency stimulation of the LPP. When constrained by initial p, the two-step model reliably recapitulates the low-p CA3–CA1 synapse (C) and high-p MPP–DG synapse (D). Note that the simulated output at both of these synapses was highly sensitive to the pool size. E, the LPP–DG output curve (green line) could be replicated by combining either the simulated (white circles) or empirically measured (black circles) CA3–CA1 and MPP–DG curves when weighted appropriately. The equations used to generate each curve are given above. F, reducing the initial p prevented the simulated within-train suppression of responses (white circles), producing an output curve similar to that recorded electrophysiologically under conditions of low external Ca2+ (green line).
Figure 10.
Figure 10.. Processing short bursts of γ frequency information occurs differently at LPP–DG and CA3–CA1 synapse
Representative traces recorded from the OML of the DG (A and B) and str. radiatum of CA1 (C and D) in response to five γ frequency bursts (three pulses) delivered at intervals of 200 ms (i.e. θγ ) via the LPP and Schaffer–commissural (CA3–CA1) projections, respectively (LPP–DG: n = 39 slices/13 mice; CA3–CA1: n = 7 slices/4 mice). The responses to pulse 1 and pulse 5 (shaded areas) are illustrated on an expanded time scale for LPP–DG (B) and CA3–CA1 (D); scale bars: y = 1 mV, x = 100 ms (A and C) or 20 ms (B and D). E, graph summarizing the change in fEPSP slopes (relative to the initial response of the first burst) during θγ stimulation (five bursts) at LPP–DG and CA3–CA1 synapses. Note that CA3–CA1 exhibit facilitation that is maintained across successive bursts whereas suppression occurs at LPP–DG synapses. F, graph summarizing the decline in within-burst facilitation that occurs across successive bursts delivered at θγ patterns at CA3–CA1 and LPP–DG synapses. Other than the marked difference in facilitation of the first burst, both synapses show a similar decline across successive bursts.
Figure 11.
Figure 11.. Suppression of within-burst facilitation persists for a prolonged period and does not involve enhanced GABAAR-mediated inhibition
A, representative responses of the LPP to the first and fifth burst recorded from the OML of the DG evoked during a train of five γ frequency bursts (three pulses) delivered to the LPP with intervals of 200 ms, 1 s and 5 s (scale bars: y = 0.5 mV, x = 20 ms). B, graph summarizing the change in fEPSP slopes (relative to the initial response of the first burst) during stimulation of the LPP with γ frequency bursts (five bursts) separated by intervals indicated (200 ms: n = 19 slices/8 mice; 1 s: n = 11 slices/5 mice; 5 s: n = 14 slices/3 mice). C, graph summarizing the within-burst facilitation that occurs across successive bursts delivered at intervals indicated. Note that the within-burst facilitation is maintained when bursts are separated by intervals of 5 s (blue symbols) (200 ms: n = 19 slices/8 mice; 1 s: n = 11 slices/5 mice; 5 s: n = 14 slices/3 mice). D, representative responses to the first and fifth burst recorded from the OML evoked during a train of five γ frequency bursts (three pulses) delivered to the LPP at intervals of 200 ms before (black) and after (blue) bath application of PTX (scale bars: y = 0.5 mV, x = 20 ms). E, graph summarizing the change in fEPSP slopes (relative to the initial response of the first burst) during θγ stimulation (five bursts) before (white circle) and after (blue circle) bath application of PTX. Treatment with PTX results in a modest enhancement of responses across bursts (F(14,112) = 1.964, P = 0.0269; n = 9 slices/4 mice per group; two-way RM-ANOVA). F, Graph showing the similar decline in within-burst facilitation that occurs across successive bursts delivered at θγ patterns before (white circle) and after (blue circle) PTX (F(14,112) = 0.5098, P = 0.9232; n = 9 slices/4 mice per group; two-way RM-ANOVA).
Figure 12.
Figure 12.. Reducing the initial release probability (p) removes the filter associated with brief γ frequency bursts at the LPP–DG synapse
A, representative responses to the first and fifth burst recorded in low Ca2+ (1 mM) aCSF from the OML of the DG evoked during a train of five γ frequency bursts (three pulses) delivered to the LPP at intervals of 200 ms (scale bars: y = 0.5 mV, x = 20 ms). B, graph summarizing the change in fEPSP slopes (relative to the initial response of the first burst) during θγ stimulation (five bursts, 200 ms interval) under low external Ca2+ (n = 8 slices/4 mice). C, graph summarizing the within-burst facilitation that occurs across successive bursts delivered at θγ patterns. Under low external Ca2+, both initial response and within-burst facilitation is maintained across bursts, although the latter declines across successive bursts (n = 8 slices/4 mice).
Figure 13.
Figure 13.. Postsynaptic Ca2+-dependent mechanisms do not contribute to the prolonged suppression of within burst facilitation
A, representative responses to the first and fifth burst recorded from the DG OML evoked during a train of five γ frequency bursts (three pulses) delivered to the LPP at intervals of 200 ms before (top) and during (bottom) bath application of the SK channel antagonist apamin (200 nM; scale bars: y = 0.5 mV, x = 20 ms). B, graph summarizing the change in fEPSP slopes (relative to the initial response of the first burst) during θγ stimulation (five bursts) before (white circle) and after (orange circle) bath application of apamin. Apamin caused a modest enhancement of responses across bursts (F(14,182) = 2.459, P = 0.003; n = 13 slices/4 mice; two-way RM-ANOVA). C, graph summarizing the decline in within-burst facilitation that occurs across successive bursts delivered at θγ patterns before (white circle) and with (orange circle) apamin present. Note the marked decline in the within-burst facilitation occurring across bursts during θγ stimulation is modestly enhanced by apamin (F(14,182) = 1.873, P = 0.032; n = 13 slices/4 mice; two-way RM-ANOVA). D, exemplar eEPSCs recorded from DG granule cells following θγ stimulation of the LPP without (top) and with (bottom) the Ca2+ chelator BAPTA in the electrode’s internal solution (scale bars: y = 50 pA, x = 200 ms). E and F, graphs summarizing the relative change in the amplitude of eEPSC across bursts (E), and the decline in within-burst facilitation (F) that occurs following the activation of the LPP with θγ patterns of input. Note that BAPTA does not attenuate these responses (CTRL: n = 7 cells; BAPTA: n = 4 cells/3−4 mice).
Figure 14.
Figure 14.. Schematic representation of direct and indirect inputs to CA3 with predicted outputs to activation at 5 Hz and 50 Hz
A and B, schematic illustration of the proposed responses at the LPP–DG (yellow), LPP–CA3 (green) and Mossy Fiber (MF)–CA3 synapses in response to afferent inputs firing at 5 Hz (A) and 50 Hz (B). LEC, lateral entorhinal cortex. C and D, graphs depicting the predicted output (red) from field CA3 following activation at 5 Hz (C) and 50 Hz (D) based upon the synaptic transformations that occur across the three synapses within the circuit at each frequency. At 5 Hz modest frequency facilitation at both LPP–DG and LPP–CA3 synapses is accompanied by pronounced facilitation of responses at the MF–CA3 synapse (A). However, the predicted CA3 output (C) is not simply the sum of the facilitation across the three synapses as the MF–CA3 preferentially promotes robust feed-forward inhibition via activation of the interneuron network at 5 Hz. As such, one would predict that feed-forward inhibition will dampen the output from CA3. At higher stimulation frequencies (50 Hz), the output from CA3 will be largely determined by the balance between suppression of responses at the LPP–DG synapse and the robust frequency facilitation occurring at the MF–CA3. In D, the hypothetical outputs with and without a contribution from the direct LPP–CA3 input is shown. We propose that at γ frequencies (i.e. 50 Hz) activation of the LPP–CA3 will, due to its ability to largely follow inputs in this frequency range, increase the CA3 output. One should note that the proposed model does not account for the manner in which different frequencies of afferent stimulation may shape output from CA3 such that throughput is enhanced or suppressed.

Similar articles

Cited by

References

    1. Adelman JP, Maylie J, & Sah P. (2012). Small-conductance Ca2+-activated K+ channels: Form and function. Annual Review of Physiology, 74(1), 245–269. - PubMed
    1. Amani M, Lauterborn JC, Le AA, Cox BM, Wang W, Quintanilla J, Cox CD, Gall CM, & Lynch G. (2021). Rapid aging in the perforant path projections to the rodent dentate gyrus. Journal of Neuroscience, 41(10), 2301–2312. - PMC - PubMed
    1. Arai A, Silberg J, & Lynch G. (1995). Differences in the refractory properties of two distinct inhibitory circuitries in field CA1 of the hippocampus. Brain Research, 704(2), 298–306. - PubMed
    1. Barmashenko G, Hefft S, Aertsen A, Kirschstein T, & Kohling R. (2011). Positive shifts of the GABAA receptor reversal potential due to altered chloride homeostasis is widespread after status epilepticus. Epilepsia, 52(9), 1570–1578. - PubMed
    1. Bellocchio EE, Hu HL, Pohorille A, Chan J, Pickel VM, & Edwards RH. (1998). The localization of the brain-specific inorganic phosphate transporter suggests a specific presynaptic role in glutamatergic transmission. Journal of Neuroscience, 18(21), 8648–8659. - PMC - PubMed

Publication types