. 2022 Jul 19;79(8):432.
doi: 10.1007/s00018-022-04460-6.

Activation of the hypoxia response protects mice from amyloid-β accumulation

Affiliations

Activation of the hypoxia response protects mice from amyloid-β accumulation

Teemu Ollonen et al. Cell Mol Life Sci. .

Abstract

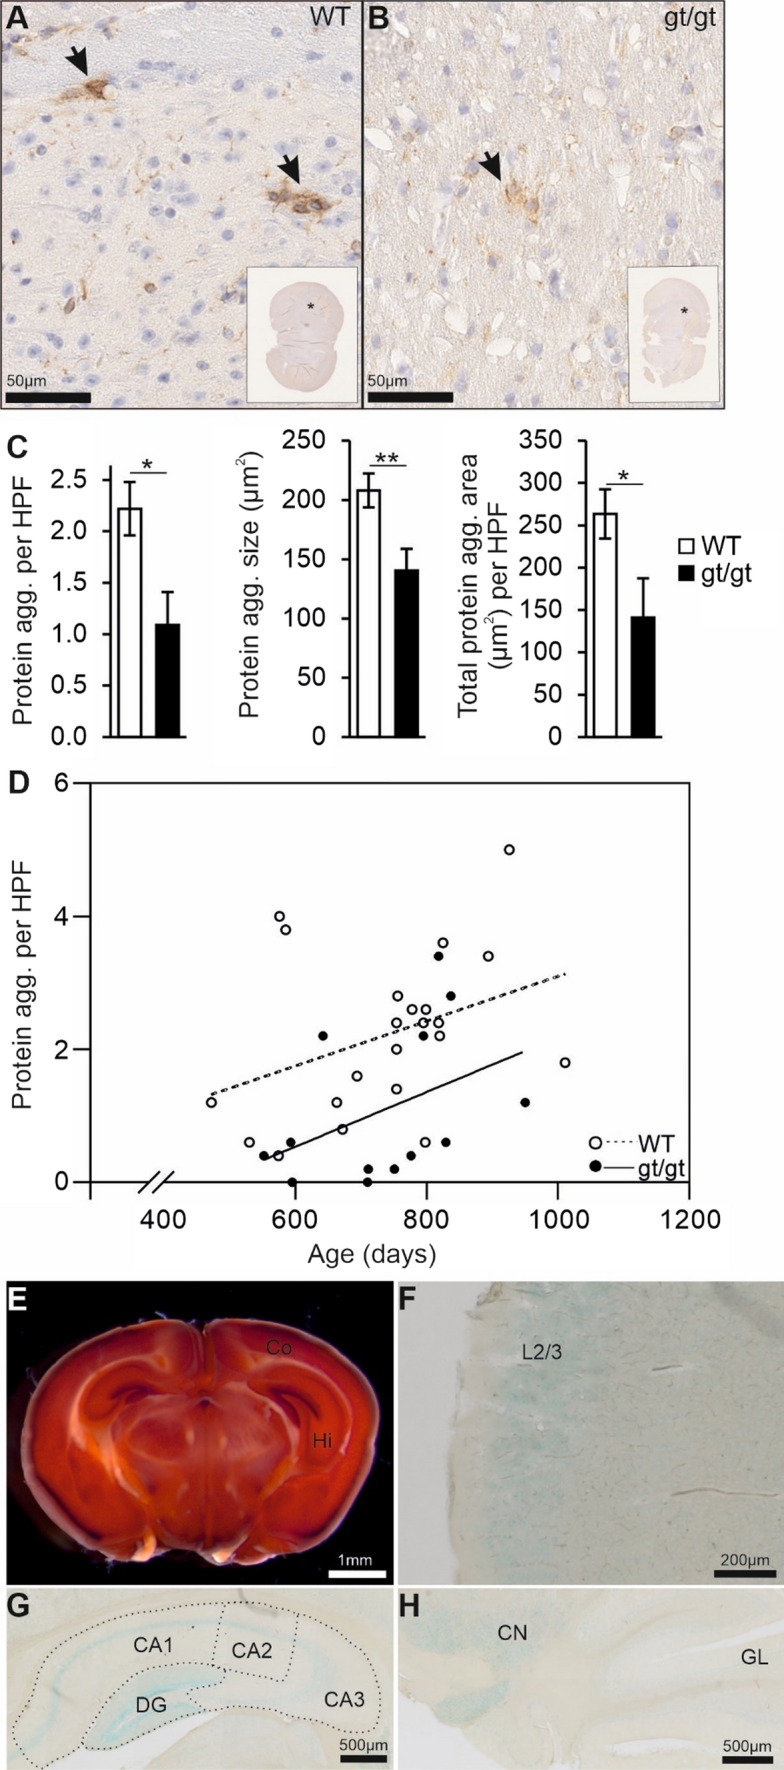
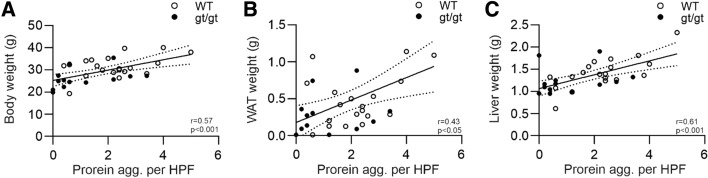
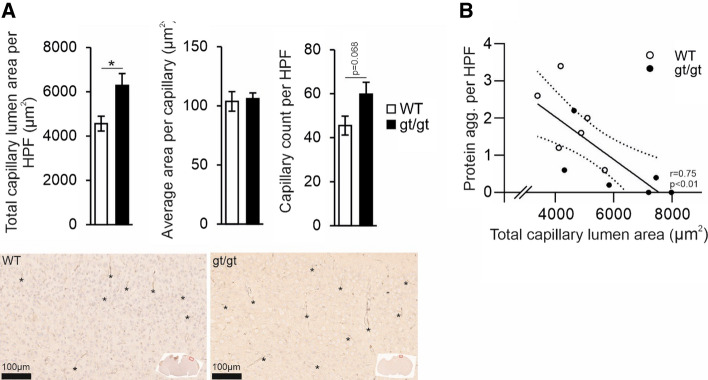
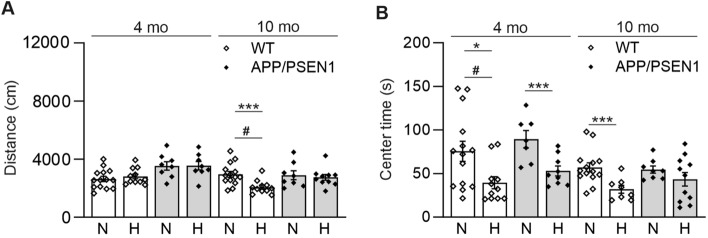
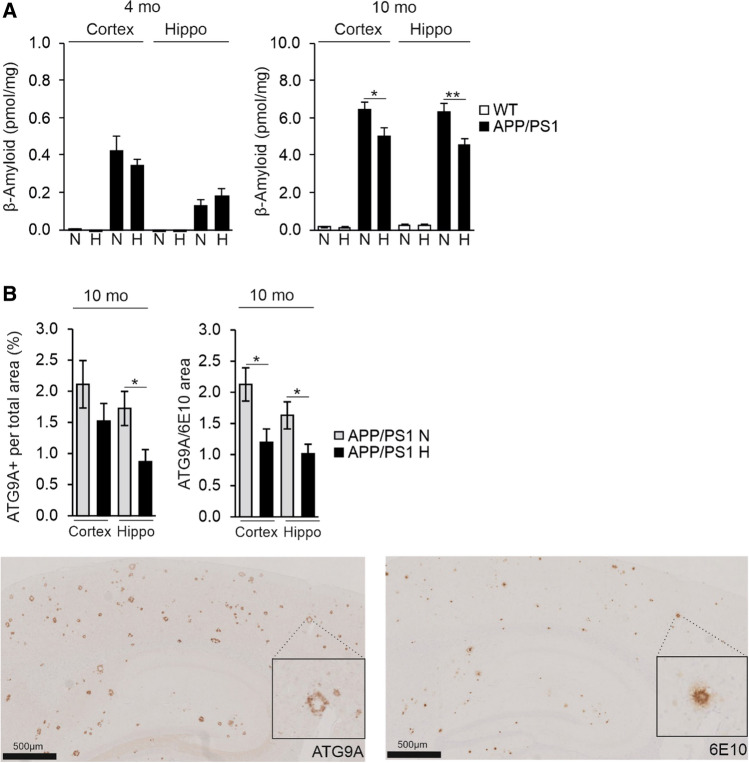
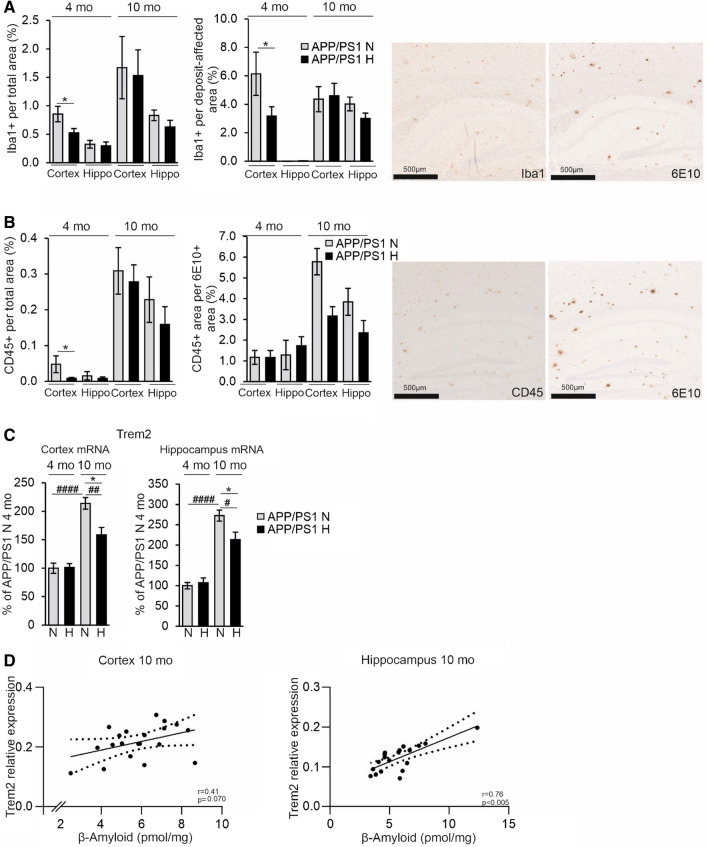
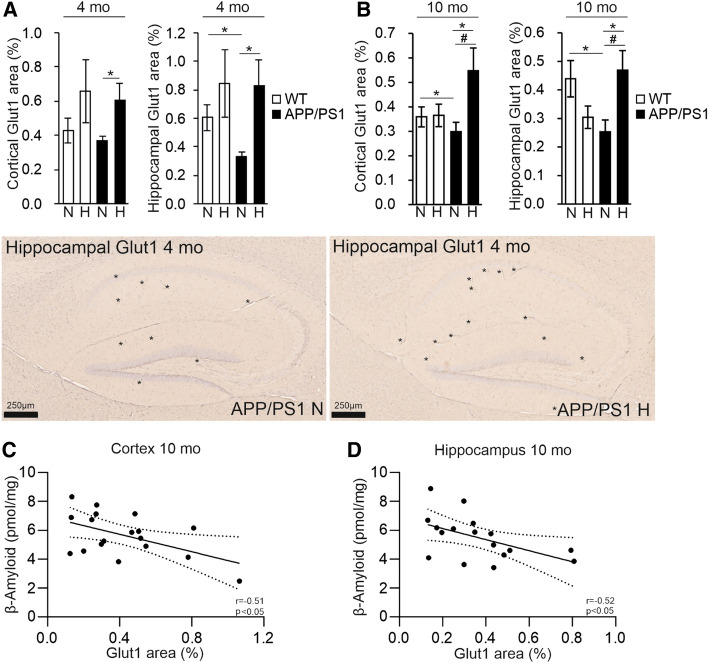
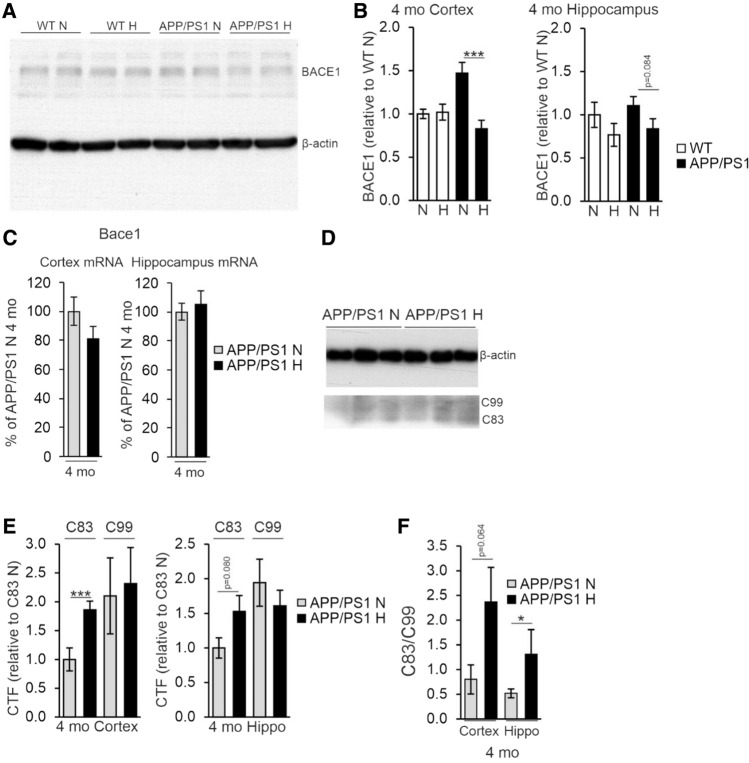
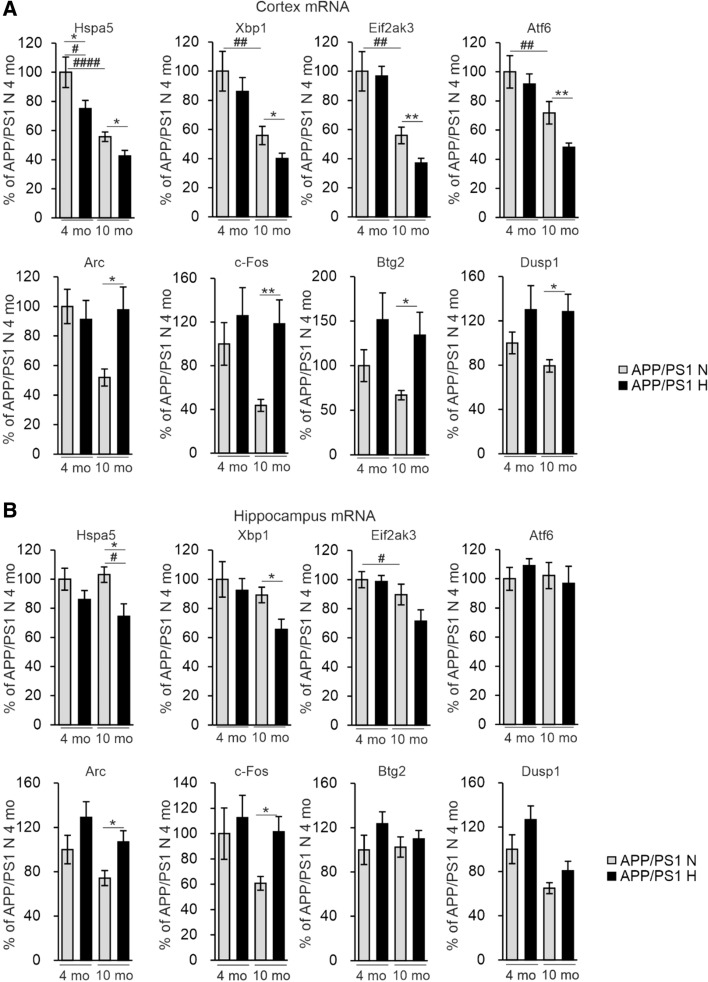
Alzheimer's disease (AD) is the most common cause of dementia with limited treatment options affecting millions of people and the prevalence increasing with the aging population. The current knowledge on the role of the hypoxia/hypoxia-inducible factor (HIF) in the AD pathology is restricted and controversial. We hypothesized based on benefits of the genetic long-term inactivation of HIF prolyl 4-hydroxylase-2 (HIF-P4H-2) on metabolism, vasculature and inflammatory response that prolonged moderate activation of the hypoxia response could hinder AD pathology. We used an aging model to study potential spontaneous accumulation of amyloid-β (Aβ) in HIF-P4H-2-deficient mice and a transgenic APP/PSEN1 mouse model subjected to prolonged sustained environmental hypoxia (15% O2 for 6 weeks) at two different time points of the disease; at age of 4 and 10 months. In both settings, activation of the hypoxia response reduced brain protein aggregate levels and this associated with higher vascularity. In the senescent HIF-P4H-2-deficient mice metabolic reprogramming also contributed to less protein aggregates while in APP/PSEN1 mice lesser Aβ associated additionally with hypoxia-mediated favorable responses to neuroinflammation and amyloid precursor protein processing. In conclusion, continuous, non-full-scale activation of the HIF pathway appears to mediate protection against neurodegeneration via several mechanisms and should be studied as a treatment option for AD.

Keywords: Alzheimer’s disease; HIF; Hypoxia; Inflammation; Metabolism; Vascularity.


Conflict of interest statement

Financial interests: JMy owns equity in FibroGen, Inc., which develops HIF-P4H inhibitors as therapeutics and supports research in JMy laboratory. The other authors have no relevant financial or non-financial interests to disclose.

Figures

Fig. 1
Fig. 1
HIF-P4H-2 deficient mice display less protein aggregates in the brain in senescence. A, B Aged-matched Aβ-stained senescent wild-type (WT) and Hif-p4h-2gt/gt (gt/gt) brain tissue. Scale bars = 50 µm. The brain regions of the enlarged pictures are shown in the inset by an asterisk. Arrows indicate the Aβ-positive protein aggregates. C Number of Aβ-positive protein aggregates, the average size of individual aggregates and the total aggregate-covered area per HPF. Five HPF/mouse were analyzed. D Correlation of the number of Aβ-positive protein aggregates with age. E X-gal-stained coronal gt/gt brain section. Scale bar = 1 mm. F X-gal-stained cross-section of the auditory cortex in a gt/gt mouse. The positivity is largely limited to layer 2/3. Scale bar = 200 µm. G, H X-gal-stained coronal gt/gt hippocampus and coronal cerebellum, respectively. Scale bars = 500 µm. Data are means ± SEM. *P < 0.05, **P < 0.01 in T-test. In C and D, n = 22 WT, 13 gt/gt males. agg. Aggregate, CA cornu ammonis, CN cerebellar nuclei, Co cortex, DG dentate gyrus, GL granular layer, Hi hippocampus, HPF high-powered field, L2/3 layer 2/3
Fig. 2
Fig. 2
Number of age-associated brain protein aggregates correlates with the body weight and metabolic tissue weights of the senescent HIF-P4H-2 deficient mice. A Correlation of wild-type (WT) and Hif-p4h-2gt/gt (gt/gt) body weight with the number of brain protein aggregates. B, C Correlation of the WAT and liver weight, respectively, with the number of brain protein aggregates. n = 22 WT, 12–13 gt/gt. agg. Aggregate, HPF high-powered field, WAT white adipose tissue
Fig. 3
Fig. 3
Increased capillary lumen area associates with lower number of age-associated brain protein aggregates in the HIF-P4H-2 deficient mice. A The total capillary lumen area, the average size of a capillary lumen and the number of individual capillaries analyzed in senescent age-matched wild-type (WT) and Hif-p4h-2gt/gt (gt/gt) brain sections with GLUT1 staining. In the histological pictures the brain regions of the enlarged pictures are shown in the inset by a red square. Asterisks indicate examples of capillaries. B Correlation of the number of brain protein aggregates with the total capillary lumen area. Data are means ± SEM. *P < 0.05 in T-test. n = 6 WT, 6 gt/gt. agg. Aggregates, HPF high-powered field
Fig. 4
Fig. 4
Hypoxia treatment decreases the time spent in the center of the open field. Behavioral assessment of wild-type (WT) and APP/PSEN1 mice after 4 weeks of hypoxia/normoxia treatment. A The distance traversed and B the time spent in the open field center. Data are means ± SEM. #P > 0.05 in 3-way ANOVA, *P < 0.05, ***P < 0.005 in T-test, #P < 0.05 in 3-way ANOVA. n = 14 WT N 4 mo, n = 11 WT H 4 mo, n = 7–8 APP/PSEN1 N 4 mo, n = 8–9 APP/PSEN1 H 4 mo, n = 14 WT N 10 mo, n = 9–11 WT H 10 mo, n = 8 APP/PSEN1 N 10 mo, n = 10–11 APP/PSEN1 H 10 mo. H hypoxia, mo months old, N normoxia
Fig. 5
Fig. 5
Hypoxia treatment decreases brain Aβ levels and the area of dystrophic neurites colocalizing with the Aβ plaques in the APP/PSEN1 mice. A Aβ amount in the cortex and hippocampus of 4 and 10 mo WT and APP/PSEN1 mice kept for 6 weeks in normoxia or hypoxia. B ATG9A-positive total area and ATG9A-positive area colocalizing with Aβ–positive area detected by 6E10 antibody in the brain of 10-month-old APP/PSEN1 mice under normoxia and hypoxia. Example pictures of histological stainings of consecutive sections of ATG9A and 6E10 in cortex and hippocampus, respectively. Data are means ± SEM. *P < 0.05, **P < 0.01 in T-test. n = 14 WT N 4 mo, n = 12 WT H 4 mo, n = 8 APP/PSEN1 N 4 mo, n = 9–10 APP/PSEN1 H 4 mo, n = 14 WT N 10 mo, n = 11 WT H 10 mo, n = 8–9 APP/PSEN1 N 10 mo, n = 9–11 APP/PSEN1 H 10 mo. Hippo hippocampus, H hypoxia, mo months old, N normoxia
Fig. 6
Fig. 6
Hypoxia treatment decreases brain neuroinflammatory responses in the APP/PSEN1 mice. A IBA1-positive area total area and IBA1-positive area in relation to the Aβ deposit-affected area. Aβ-positive deposits were detected by 6E10 antibody. Example pictures of histological stainings of consecutive sections of IBA1 and 6e10 in cortex and hippocampus, respectively. B CD45-positive total area and CD45-positive area in relation to Aβ area detected by 6E10 antibody. Example pictures of histological stainings of consecutive sections of CD45 and 6E10 in cortex and hippocampus, respectively. C qPCR analysis of the mRNA levels of Trem2 in the cortex and the hippocampus of 4 and 10 mo APP/PSEN1 mice. D Correlation of the Trem2 mRNA relative expression with the Aβ amount in the cortex and hippocampus of the 10 mo APP/PSEN1 mice. Data are means ± SEM. *P < 0.05 in T-test, ##P < 0.01, ####P < 0.0001 in 2-way ANOVA. n = 14 WT N 4 mo, n = 12 WT H 4 mo, n = 8 APP/PSEN1 N 4 mo, n = 9–10 APP/PSEN1 H 4 mo, n = 14 WT N 10 mo, n = 11 WT H 10 mo, n = 8–9 APP/PSEN1 N 10 mo, n = 9–11 APP/PSEN1 H 10 mo. Hippo hippocampus, H hypoxia, mo months old, N normoxia
Fig. 7
Fig. 7
Hypoxia treatment increases the GLUT1-positive area in APP/PSEN1 brain and this associates with decreased Aβ amount. GLUT1-positive area per total cortical and hippocampal area of A 4 mo and B 10 mo mice treated for 6 weeks in normoxia or hypoxia. In the histological pictures asterisks indicate examples of Glut1-positive capillaries in the hippocampus. Correlation of Aβ amount with the GLUT1-positive area in C cortex and D hippocampus of 10 mo APP/PSEN1 mice. Data are means ± SEM. *P < 0.05 in T-test, #P < 0.05 in 2-way ANOVA. n = 5–6 WT N 4 mo, n = 5–6 WT H 4 mo, n = 5 APP/PSEN1 N 4 mo, n = 5–6 APP/PSEN1 H 4 mo, n = 11–14 WT N 10 mo, n = 11 WT H 10 mo, n = 9 APP/PSEN1 N 10 mo, n = 10–11 APP/PSEN1 H 10 mo. β-amyloid, H hypoxia, mo months old, N normoxia
Fig. 8
Fig. 8
Hypoxia treatment alters the post-translational modification of APP. A Western blot analysis of BACE1 levels from 4 mo wild-type (WT) and APP/PSEN1 mice treated in normoxia or hypoxia for 6 weeks. B Quantification of the relative BACE1 relative protein levels in cortex and hippocampus of 4 mo APP/PSEN1 mice. C qPCR analysis of the Bace1 mRNA levels in cortex and hippocampus of 4 mo APP/PSEN1 mice. D Western blot analysis of the levels of C-terminal factors (CTFs) of APP from 4 mo APP/PSEN1 mice. E Quantification of the relative CTF levels in cortex and hippocampus of 4 mo mice. F Ratio of APP CTFs in cortex and hippocampus of 4 mo APP/PSEN1 mice. Data are means ± SEM. *P < 0.05, ***P < 0.005 in T-test. n = 8 APP/PSEN1 N 4 mo, n = 9–10 APP/PSEN1 H 4 mo. CTF C-terminal factor, hippo hippocampus, H hypoxia, mo months old, N normoxia
Fig. 9
Fig. 9
Hypoxia treatment modified gene expression to promote brain cell functions and survival. qPCR analysis of the mRNA levels of the indicated genes in A cortex and B hippocampus of the APP/PSEN1 mice treated for 6 weeks in normoxia or hypoxia. Data are means ± SEM. *P < 0.05, **P < 0.01 in T-test #P < 0.05, #P < 0.05, ##P < 0.01, ####P < 0.0001 in 2-way ANOVA. n = 8 N 4 mo, n = 9–10 H 4 mo, n = 8–9 N 10 mo, n = 10–11 H 10 mo

Similar articles

Cited by

References

    1. Querfurth HW, LaFerla FM. Alzheimer's disease. N Engl J Med. 2010;362:329–344. doi: 10.1056/NEJMra0909142. - DOI - PubMed
    1. Masters CL, Bateman R, Blennow K, Rowe CC, Sperling RA, Cummings JL. Alzheimer's disease. Nat Rev Dis Primers. 2015;1:15056. doi: 10.1038/nrdp.2015.56. - DOI - PubMed
    1. Loy CT, Schofield PR, Turner AM, Kwok JB. Genetics of dementia. Lancet. 2014;383:828–840. doi: 10.1016/S0140-6736(13)60630-3. - DOI - PubMed
    1. Kaelin WG, Jr, Ratcliffe PJ. Oxygen sensing by metazoans: the central role of the HIF hydroxylase pathway. Mol Cell. 2008;30:393–402. doi: 10.1016/j.molcel.2008.04.009. - DOI - PubMed
    1. Chen N, Hao C, Peng X, et al. Roxadustat for anemia in patients with kidney disease not receiving dialysis. N Engl J Med. 2019;381:1001–1010. doi: 10.1056/NEJMoa1813599. - DOI - PubMed

Substances