Multicenter Study
. 2022 Sep 15;28(18):3965-3978.
doi: 10.1158/1078-0432.CCR-22-0803.

Upfront Biology-Guided Therapy in Diffuse Intrinsic Pontine Glioma: Therapeutic, Molecular, and Biomarker Outcomes from PNOC003

Affiliations
Multicenter Study

Upfront Biology-Guided Therapy in Diffuse Intrinsic Pontine Glioma: Therapeutic, Molecular, and Biomarker Outcomes from PNOC003

Cassie Kline et al. Clin Cancer Res. .

Abstract

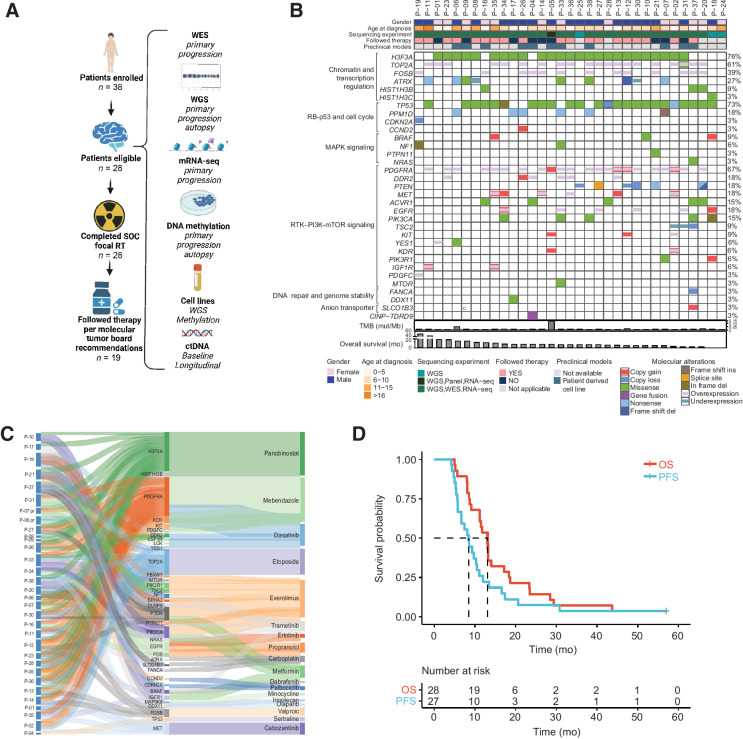
Purpose: PNOC003 is a multicenter precision medicine trial for children and young adults with newly diagnosed diffuse intrinsic pontine glioma (DIPG).

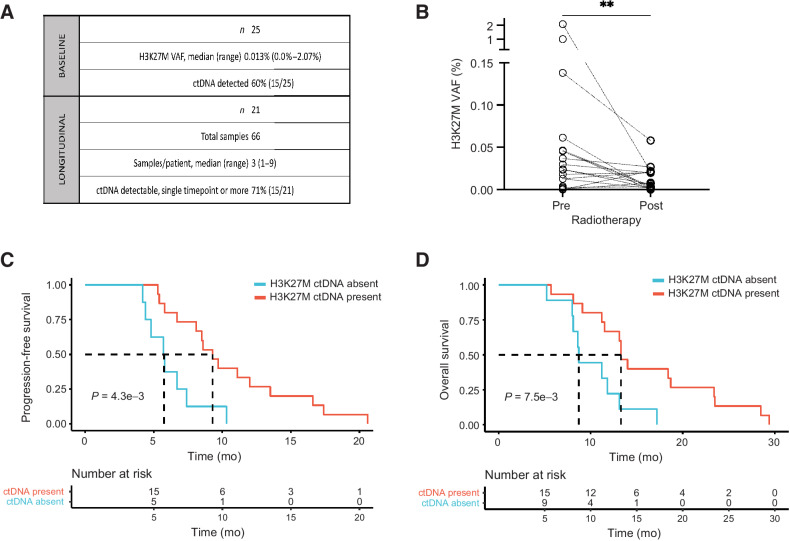
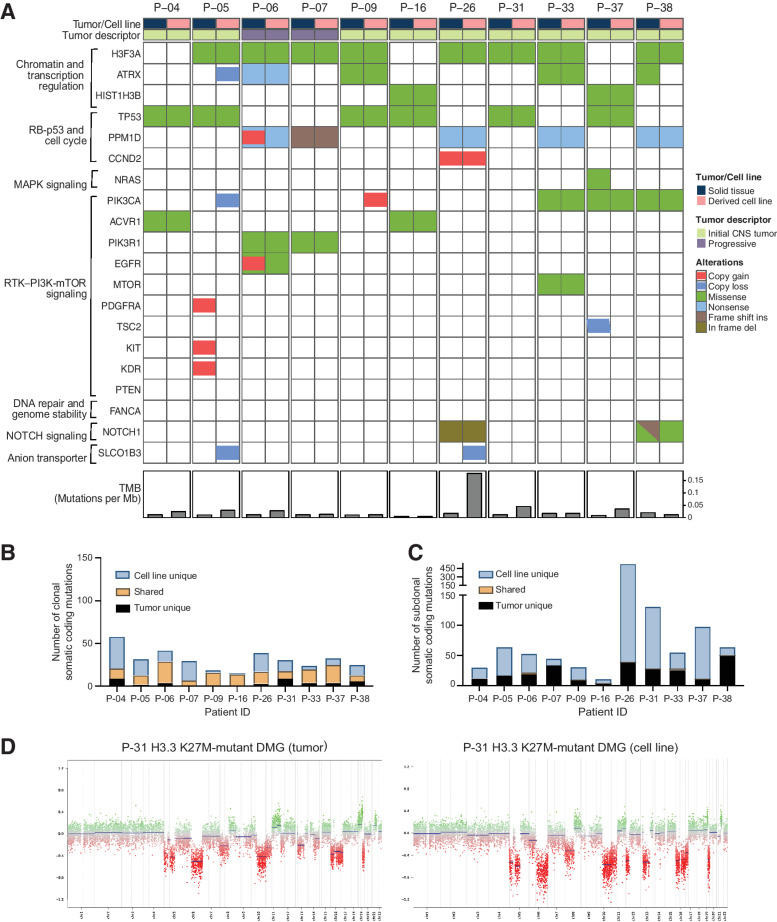
Patients and methods: Patients (3-25 years) were enrolled on the basis of imaging consistent with DIPG. Biopsy tissue was collected for whole-exome and mRNA sequencing. After radiotherapy (RT), patients were assigned up to four FDA-approved drugs based on molecular tumor board recommendations. H3K27M-mutant circulating tumor DNA (ctDNA) was longitudinally measured. Tumor tissue and matched primary cell lines were characterized using whole-genome sequencing and DNA methylation profiling. When applicable, results were verified in an independent cohort from the Children's Brain Tumor Network (CBTN).

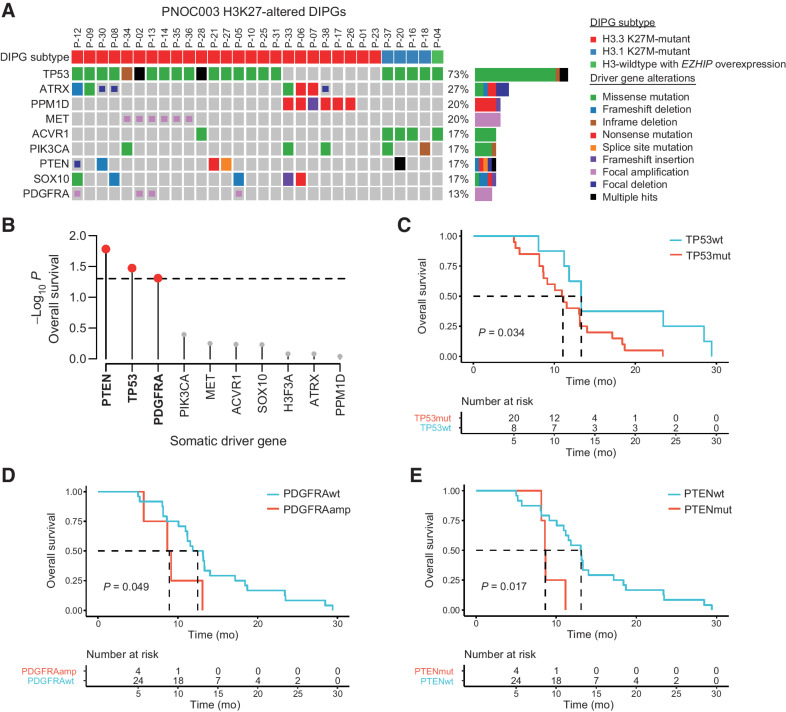
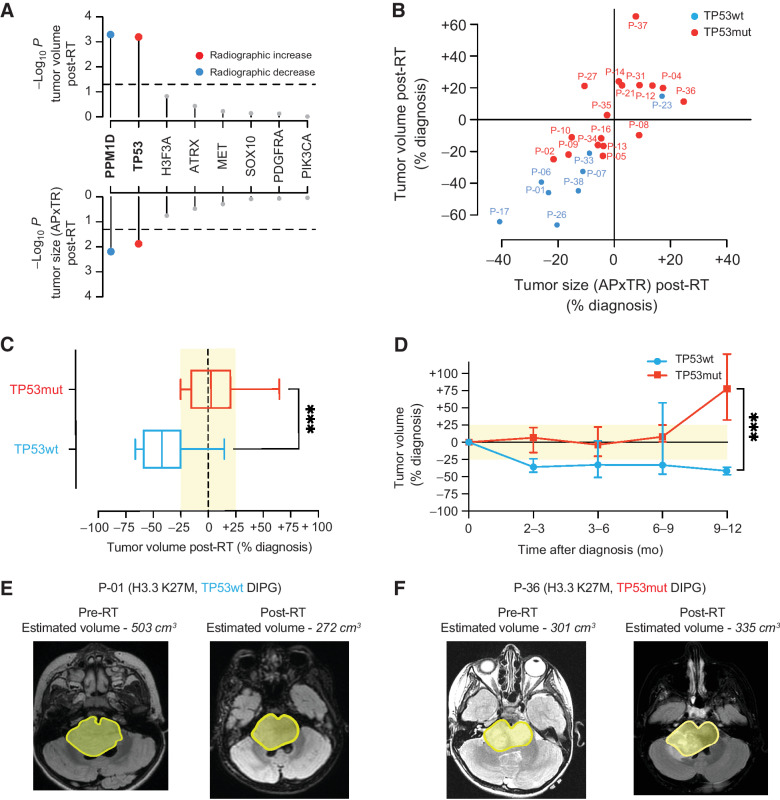
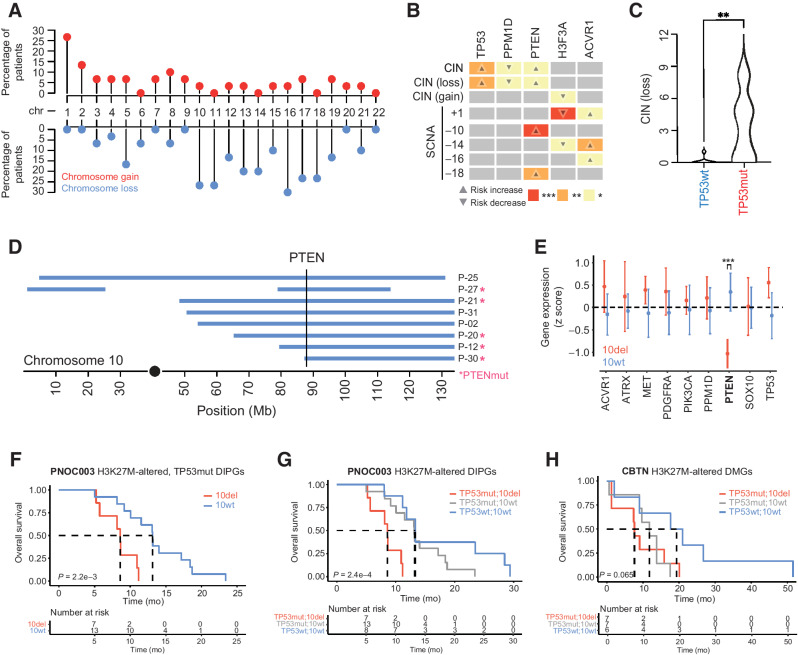
Results: Of 38 patients enrolled, 28 patients (median 6 years, 10 females) were reviewed by the molecular tumor board. Of those, 19 followed treatment recommendations. Median overall survival (OS) was 13.1 months [95% confidence interval (CI), 11.2-18.4] with no difference between patients who followed recommendations and those who did not. H3K27M-mutant ctDNA was detected at baseline in 60% of cases tested and associated with response to RT and survival. Eleven cell lines were established, showing 100% fidelity of key somatic driver gene alterations in the primary tumor. In H3K27-altered DIPGs, TP53 mutations were associated with worse OS (TP53mut 11.1 mo; 95% CI, 8.7-14; TP53wt 13.3 mo; 95% CI, 11.8-NA; P = 3.4e-2), genome instability (P = 3.1e-3), and RT resistance (P = 6.4e-4). The CBTN cohort confirmed an association between TP53 mutation status, genome instability, and clinical outcome.

Conclusions: Upfront treatment-naïve biopsy provides insight into clinically relevant molecular alterations and prognostic biomarkers for H3K27-altered DIPGs.


Figures

Figure 1. Overview of the PNOC003 clinical trial, molecular alterations identified, assigned therapy recommendations based on molecular data, and clinical outcomes. A, Left shows the clinical trial outline with the total number of patients in each treatment phase of the trial (includes 38 enrolled patients and 10 patients removed from outcome analyses due to the family changing decision about undergoing biopsy; n = 1), failure to collect sufficient tissue for CLIA molecular analysis (n = 3), ineligible pathology diagnosis, withdrawal of participation after the biopsy but before study required treatment (n = 1), and death before completion of CLIA molecular profiling or radiotherapy (n = 2). Right provides an overview of the completed multi-omic profiling of tumor tissue, germline, CSF, and cell lines. B, Oncoprint representation of alterations identified for all patients that successfully underwent WGS, WES, or RNA-seq in primary DIPG tumors (n = 33; WES and mRNA-seq, CLIA; WGS, non-CLIA). Patients P-18, P-24, and P-25 were removed from trial due to insufficient tissue availability for WES and mRNA-seq; however, these patients completed WGS (not used for treatment decision-making). “Tier 1” targetable alteration listed. “Not applicable” for “Followed Therapy” row indicates patients that came off therapy before initiation of therapy recommendations due to family preference (n = 1), the family changed mind about continuing therapy recommendations (n = 1), patient death before rendering therapy recommendations (n = 1), or did not have sufficient tissue to perform CLIA molecular analyses required to render therapy recommendations (n = 2). Patients are represented in columns, and genes are labeled in rows. Percentages on the right column represent the proportion of patients in the cohort with molecular alterations. Tumor mutation burden (TMB) and overall survival (OS) are represented below the oncoprint. C, Sankey diagram illustrates the individualized, targeted therapy recommendations for each PNOC003 patient who underwent molecular tumor board (n = 30) and based on gene alterations identified via molecular profiling. The first node shows the patient identifier connected to the therapeutically informative genes in the second node. The third node depicts targeted therapy agents recommended by the molecular tumor board. Abbreviations used for drugs are shown in parentheses, “pr” indicates targeted recommendations from repeat biopsy at progression (n = 2). Two patients underwent molecular tumor board but were removed from therapy due to patient/family preference (n = 1; P-28) or patient death during RT (n = 1; P-20). D, Kaplan–Meier OS and PFS of all patients followed for survival outcomes (n = 28 for OS, n = 27 for PFS; based on missing PFS for P-31). Median OS of 13.1 months and median PFS of 8.5 months. WES, whole-exome sequencing; WGS, whole-genome sequencing; mRNA-seq, mRNA sequencing; ctDNA, circulating tumor DNA; TMB, tumor mutation burden; OS, overall survival; PFS, progression-free survival.
Figure 1.
Overview of the PNOC003 clinical trial, molecular alterations identified, assigned therapy recommendations based on molecular data, and clinical outcomes. A, Left shows the clinical trial outline with the total number of patients in each treatment phase of the trial (includes 38 enrolled patients and 10 patients removed from outcome analyses due to the family changing decision about undergoing biopsy; n = 1), failure to collect sufficient tissue for CLIA molecular analysis (n = 3), ineligible pathology diagnosis, withdrawal of participation after the biopsy but before study required treatment (n = 1), and death before completion of CLIA molecular profiling or radiotherapy (n = 2). Right provides an overview of the completed multi-omic profiling of tumor tissue, germline, CSF, and cell lines. B, Oncoprint representation of alterations identified for all patients that successfully underwent WGS, WES, or RNA-seq in primary DIPG tumors (n = 33; WES and mRNA-seq, CLIA; WGS, non-CLIA). Patients P-18, P-24, and P-25 were removed from trial due to insufficient tissue availability for WES and mRNA-seq; however, these patients completed WGS (not used for treatment decision-making). “Tier 1” targetable alteration listed. “Not applicable” for “Followed Therapy” row indicates patients that came off therapy before initiation of therapy recommendations due to family preference (n = 1), the family changed mind about continuing therapy recommendations (n = 1), patient death before rendering therapy recommendations (n = 1), or did not have sufficient tissue to perform CLIA molecular analyses required to render therapy recommendations (n = 2). Patients are represented in columns, and genes are labeled in rows. Percentages on the right column represent the proportion of patients in the cohort with molecular alterations. Tumor mutation burden (TMB) and overall survival (OS) are represented below the oncoprint. C, Sankey diagram illustrates the individualized, targeted therapy recommendations for each PNOC003 patient who underwent molecular tumor board (n = 30) and based on gene alterations identified via molecular profiling. The first node shows the patient identifier connected to the therapeutically informative genes in the second node. The third node depicts targeted therapy agents recommended by the molecular tumor board. Abbreviations used for drugs are shown in parentheses, “pr” indicates targeted recommendations from repeat biopsy at progression (n = 2). Two patients underwent molecular tumor board but were removed from therapy due to patient/family preference (n = 1; P-28) or patient death during RT (n = 1; P-20). D, Kaplan–Meier OS and PFS of all patients followed for survival outcomes (n = 28 for OS, n = 27 for PFS; based on missing PFS for P-31). Median OS of 13.1 months and median PFS of 8.5 months. WES, whole-exome sequencing; WGS, whole-genome sequencing; mRNA-seq, mRNA sequencing; ctDNA, circulating tumor DNA; TMB, tumor mutation burden; OS, overall survival; PFS, progression-free survival.
Figure 2. Somatic TP53, PTEN, and PDGFRA alterations are associated with clinical outcomes in H3K27-altered DIPG. A, Oncoprint representation of recurrent somatic driver gene alterations in H3K27-altered DIPGs with available WES, WGS, and mRNA-seq, regardless of the availability of survival outcomes (n = 30). H3K27-altered DIPG subtyping based on the 2021 WHO Classification of Central Nervous System Tumors system: H3F3A (p.K27M), HIST1H3B (p.K27M), and EZHIP overexpression. B, Association between somatic driver gene status and OS in H3K27-altered DIPG patients (n = 28). Lollipop plot shows the −log10 log-rank test P value for all tested driver genes (n = 8). Red colored dots mark genes significantly (P < 0.05) associated with OS. C–E, Kaplan–Meier survival curves and log-rank P values for H3K27-altered DIPG patients stratified by TP53 (C), PDGFRA (D), and PTEN (E) alteration status. WES, whole-exome sequencing; WGS, whole-genome sequencing; mRNA-seq, mRNA sequencing; OS, overall survival; PFS, progression-free survival; wt, wild-type; mut, mutant; amp, amplification.
Figure 2.
Somatic TP53, PTEN, and PDGFRA alterations are associated with clinical outcomes in H3K27-altered DIPG. A, Oncoprint representation of recurrent somatic driver gene alterations in H3K27-altered DIPGs with available WES, WGS, and mRNA-seq, regardless of the availability of survival outcomes (n = 30). H3K27-altered DIPG subtyping based on the 2021 WHO Classification of Central Nervous System Tumors system: H3F3A (p.K27M), HIST1H3B (p.K27M), and EZHIP overexpression. B, Association between somatic driver gene status and OS in H3K27-altered DIPG patients (n = 28). Lollipop plot shows the −log10 log-rank test P value for all tested driver genes (n = 8). Red colored dots mark genes significantly (P < 0.05) associated with OS. C–E, Kaplan–Meier survival curves and log-rank P values for H3K27-altered DIPG patients stratified by TP53 (C), PDGFRA (D), and PTEN (E) alteration status. WES, whole-exome sequencing; WGS, whole-genome sequencing; mRNA-seq, mRNA sequencing; OS, overall survival; PFS, progression-free survival; wt, wild-type; mut, mutant; amp, amplification.
Figure 3. Somatic TP53 mutations predict poor radiographic response after radiotherapy in patients with H3K27-altered DIPG. A, Association between somatic driver gene status and change in tumor volume (top) and tumor size measured by anterior-posterior (AP) and transverse (TR) dimensions (bottom) post-RT (n = 25 H3K27-altered DIPG patients with available pre- and post-RT MRI data). Colored dots show mutant driver genes that are significantly (P < 0.05) associated with an increase (red) or decrease (blue) in tumor volume/size post-RT. B, Scatter plot comparing the percentage of change pre- and post-RT tumor volume versus tumor size across TP53mut (n = 17; red dots) and TP53wt (n = 8, blue dots) H3K27-altered DIPG. C, Box plot comparing tumor volumes stratified by TP53 mutation status based on post-RT MR images in patients enrolled in PNOC003 (TP53mut, n = 17, red box; TP53wt, n = 8, blue box). D, Line graph showing longitudinal changes in tumor volume from time of initial diagnosis up to 12 months from subjects enrolled in PNOC003 based on volumetric tumor assessment on MRI (n = 99 MRI scans; TP53mut, n = 17, red line; TP53wt, n = 8, blue line). E and F, show a representative example of pre- and post-RT MRI tumor volume for patients with a TP53wt (C) and TP53mut (F) H3.3 K27M-mutant DIPG. Yellow area marks tumor outline. RT, radiotherapy; wt, wild-type; mut, mutant; MRI, magnetic resonance imaging; AP, anterior–posterior; TR, transverse.
Figure 3.
Somatic TP53 mutations predict poor radiographic response after radiotherapy in patients with H3K27-altered DIPG. A, Association between somatic driver gene status and change in tumor volume (top) and tumor size measured by anterior-posterior (AP) and transverse (TR) dimensions (bottom) post-RT (n = 25 H3K27-altered DIPG patients with available pre- and post-RT MRI data). Colored dots show mutant driver genes that are significantly (P < 0.05) associated with an increase (red) or decrease (blue) in tumor volume/size post-RT. B, Scatter plot comparing the percentage of change pre- and post-RT tumor volume versus tumor size across TP53mut (n = 17; red dots) and TP53wt (n = 8, blue dots) H3K27-altered DIPG. C, Box plot comparing tumor volumes stratified by TP53 mutation status based on post-RT MR images in patients enrolled in PNOC003 (TP53mut, n = 17, red box; TP53wt, n = 8, blue box). D, Line graph showing longitudinal changes in tumor volume from time of initial diagnosis up to 12 months from subjects enrolled in PNOC003 based on volumetric tumor assessment on MRI (n = 99 MRI scans; TP53mut, n = 17, red line; TP53wt, n = 8, blue line). E and F show a representative example of pre- and post-RT MRI tumor volume for patients with a TP53wt (C) and TP53mut (F) H3.3 K27M-mutant DIPG. Yellow area marks tumor outline. RT, radiotherapy; wt, wild-type; mut, mutant; MRI, magnetic resonance imaging; AP, anterior–posterior; TR, transverse. ***, P < 0.001.
Figure 4. Somatic driver gene alterations are associated with distinct patterns of chromosome instability in H3K27-altered DIPG. A, Lollipop plot showing the frequency of somatic chromosomal gain and loss events in H3K27-altered DIPGs (n = 30). Percentages on the left show the proportion of primary tumors with chromosomal gains or losses (middle row). Red dots represent full/partial chromosome gains; blue dots represent full/partial chromosome losses. B, Association between somatic driver gene alterations (top side), CIN (left side), and SCNAs (left side) in H3K27-altered DIPGs. Box color and associated number of asterisks indicate the degree of statistical significance (colored boxes). Direction of the arrow indicates an increased risk of association (up-arrow) or decreased risk of association (down-arrow). C, Plot shows the total number of chromosomal losses in TP53mut (n = 20) and TP53wt (n = 8) H3K27-altered DIPGs. D, Somatic PTEN alterations are associated with SCNAs on 10q. Plot shows the genomic position of somatic deletions (blue bars) on chromosome 10 and somatic PTEN alterations (pink asterisk). The vertical line marks the genomic location of the PTEN gene. E, Association between driver gene expression and 10q deletion status in H3K27M-altered DIPG. PTEN expression is significantly reduced in DIPGs that harbor a 10q deletion (Mann–Whitney U test). F, Kaplan–Meier survival curves show poor clinical outcomes in H3K27-altered, TP53-mutant DIPG patients in PNOC003. G and H, Kaplan–Meier survival curves for PNOC003 (C) and CBTN (D) H3K27-altered DIPG/DMG patients after stratification into three genetically defined risk groups: TP53mut/10del (red, highest risk), TP53mut/10wt (gray, intermediate risk), and TP53wt/10wt (blue, lowest risk). SCNA, somatic copy-number alterations; CIN, chromosomal instability; wt, wild-type; mut, mutant; del, deletion; CBTN, Children's Brain Tumor Network; ***, P < 0.001; **, P < 0.01; *, P < 0.05.
Figure 4.
Somatic driver gene alterations are associated with distinct patterns of chromosome instability in H3K27-altered DIPG. A, Lollipop plot showing the frequency of somatic chromosomal gain and loss events in H3K27-altered DIPGs (n = 30). Percentages on the left show the proportion of primary tumors with chromosomal gains or losses (middle row). Red dots represent full/partial chromosome gains; blue dots represent full/partial chromosome losses. B, Association between somatic driver gene alterations (top side), CIN (left side), and SCNAs (left side) in H3K27-altered DIPGs. Box color and associated number of asterisks indicate the degree of statistical significance (colored boxes). Direction of the arrow indicates an increased risk of association (up-arrow) or decreased risk of association (down-arrow). C, Plot shows the total number of chromosomal losses in TP53mut (n = 20) and TP53wt (n = 8) H3K27-altered DIPGs. D, Somatic PTEN alterations are associated with SCNAs on 10q. Plot shows the genomic position of somatic deletions (blue bars) on chromosome 10 and somatic PTEN alterations (pink asterisk). The vertical line marks the genomic location of the PTEN gene. E, Association between driver gene expression and 10q deletion status in H3K27M-altered DIPG. PTEN expression is significantly reduced in DIPGs that harbor a 10q deletion (Mann–Whitney U test). F, Kaplan–Meier survival curves show poor clinical outcomes in H3K27-altered, TP53-mutant DIPG patients in PNOC003. G and H, Kaplan–Meier survival curves for PNOC003 (C) and CBTN (D) H3K27-altered DIPG/DMG patients after stratification into three genetically defined risk groups: TP53mut/10del (red, highest risk), TP53mut/10wt (gray, intermediate risk), and TP53wt/10wt (blue, lowest risk). SCNA, somatic copy-number alterations; CIN, chromosomal instability; wt, wild-type; mut, mutant; del, deletion; CBTN, Children's Brain Tumor Network; ***, P < 0.001; **, P < 0.01; *, P < 0.05.
Figure 5. H3K27M-mutant plasma ctDNA associates with clinical outcomes in DIPG. A, Summary table with baseline and longitudinal plasma ctDNA collection in PNOC003. B, Change in plasma H3K27M-mutant ctDNA VAF pre- and post-RT in PNOC003 cohort. C and D, Kaplan–Meier PFS (C) and OS (D) curves after stratification of patients with (present) and without (absent) detectable plasma H3K27M-mutant ctDNA at baseline. VAF, variant allele frequency; ctDNA, circulating tumor DNA; RT, radiotherapy; PFS, progression-free survival; OS, overall survival; **, P < 0.01.
Figure 5.
H3K27M-mutant plasma ctDNA associates with clinical outcomes in DIPG. A, Summary table with baseline and longitudinal plasma ctDNA collection in PNOC003. B, Change in plasma H3K27M-mutant ctDNA VAF pre- and post-RT in PNOC003 cohort. C and D, Kaplan–Meier PFS (C) and OS (D) curves after stratification of patients with (present) and without (absent) detectable plasma H3K27M-mutant ctDNA at baseline. VAF, variant allele frequency; ctDNA, circulating tumor DNA; RT, radiotherapy; PFS, progression-free survival; OS, overall survival. **, P < 0.01.
Figure 6. Genomic fidelity of DIPG cell lines derived from primary and progressive tumor biopsies. A, Oncoprint of WGS-derived somatic driver gene alterations for 11 DIPG cell lines and matched tumor tissue samples (biopsy at diagnosis, n = 9; biopsy at progression, n = 2). B and C, Total number of nonsynonymous gene mutations in 11 DIPG cell lines and matched tumors with clonal (B) and subclonal mutations (C). Somatic mutations in DIPG cell lines and matched tumors are shown in orange, and mutations present only in cell lines and matched tumors are shown in blue and black, respectively. D, DNA methylation-based somatic copy-number profile of a representative H3.3K27M-mutant DIPG cell line and matched primary tumor biopsy sample. WGS, whole-genome sequencing; TMB, tumor mutation burden; VAF, variant allele frequency; clonal, VAF >0.20; sub-clonal, VAF 0.05–0.20.
Figure 6.
Genomic fidelity of DIPG cell lines derived from primary and progressive tumor biopsies. A, Oncoprint of WGS-derived somatic driver gene alterations for 11 DIPG cell lines and matched tumor tissue samples (biopsy at diagnosis, n = 9; biopsy at progression, n = 2). B and C, Total number of nonsynonymous gene mutations in 11 DIPG cell lines and matched tumors with clonal (B) and subclonal mutations (C). Somatic mutations in DIPG cell lines and matched tumors are shown in orange, and mutations present only in cell lines and matched tumors are shown in blue and black, respectively. D, DNA methylation-based somatic copy-number profile of a representative H3.3K27M-mutant DIPG cell line and matched primary tumor biopsy sample. WGS, whole-genome sequencing; TMB, tumor mutation burden; VAF, variant allele frequency; clonal, VAF >0.20; sub-clonal, VAF 0.05–0.20.

References

    1. Cohen KJ, Heideman RL, Zhou T, Holmes EJ, Lavey RS, Bouffet E, et al. Temozolomide in the treatment of children with newly diagnosed diffuse intrinsic pontine gliomas: a report from the Children's Oncology Group. Neuro Oncol 2011;13:410–6. - PMC - PubMed
    1. Macy ME, Kieran MW, Chi SN, Cohen KJ, MacDonald TJ, Smith AA, et al. A pediatric trial of radiation/cetuximab followed by irinotecan/cetuximab in newly diagnosed diffuse pontine gliomas and high-grade astrocytomas: A Pediatric Oncology Experimental Therapeutics Investigators' Consortium study. Pediatr Blood Cancer. 2017 Nov;64(11):10.1002/pbc.26621. doi: 10.1002/pbc.26621. Epub 2017 May 24. PMID: 28544128; PMCID: PMC5605460. - PMC - PubMed
    1. Vanan MI, Eisenstat DD. DIPG in Children—What Can We Learn from the Past? Front Oncol 2015;5:237. - PMC - PubMed
    1. Veldhuijzen van Zanten SEM, El-Khouly FE, Jansen MHA, Bakker DP, Sanchez Aliaga E, Haasbeek CJA, et al. A phase I/II study of gemcitabine during radiotherapy in children with newly diagnosed diffuse intrinsic pontine glioma. J Neurooncol 2017;135:307–15. - PMC - PubMed
    1. Veldhuijzen van Zanten SE, Jansen MH, Sanchez Aliaga E, van Vuurden DG, Vandertop WP, Kaspers GJ. A twenty-year review of diagnosing and treating children with diffuse intrinsic pontine glioma in the Netherlands. Expert Rev Anticancer Ther 2015;15:157–64. - PubMed

Publication types