

Association of Optimal Gestational Weight Gain Ranges With Perinatal Outcomes Across Body Mass Index Categories in Twin Pregnancies
- PMID: 35852802
- PMCID: PMC9297120
- DOI: 10.1001/jamanetworkopen.2022.22537
Association of Optimal Gestational Weight Gain Ranges With Perinatal Outcomes Across Body Mass Index Categories in Twin Pregnancies
Abstract
Importance: The existing gestational weight gain (GWG) recommendations for twin pregnancies are lacking for underweight individuals and are not stratified by obesity class.
Objective: To identify optimal GWG ranges associated with reduced adverse perinatal outcomes stratified by prepregnancy body mass index (BMI) categories in twin pregnancies.
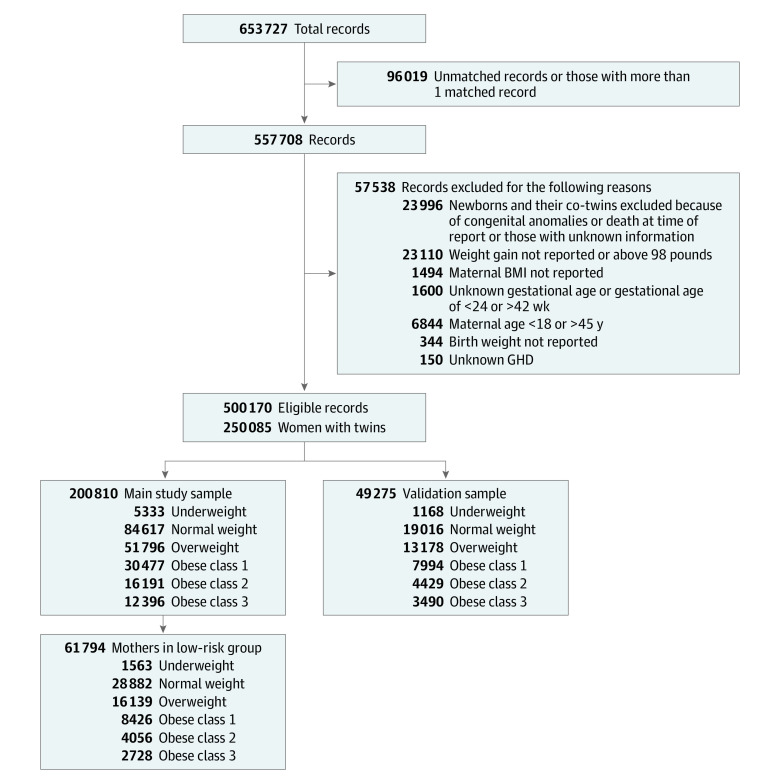
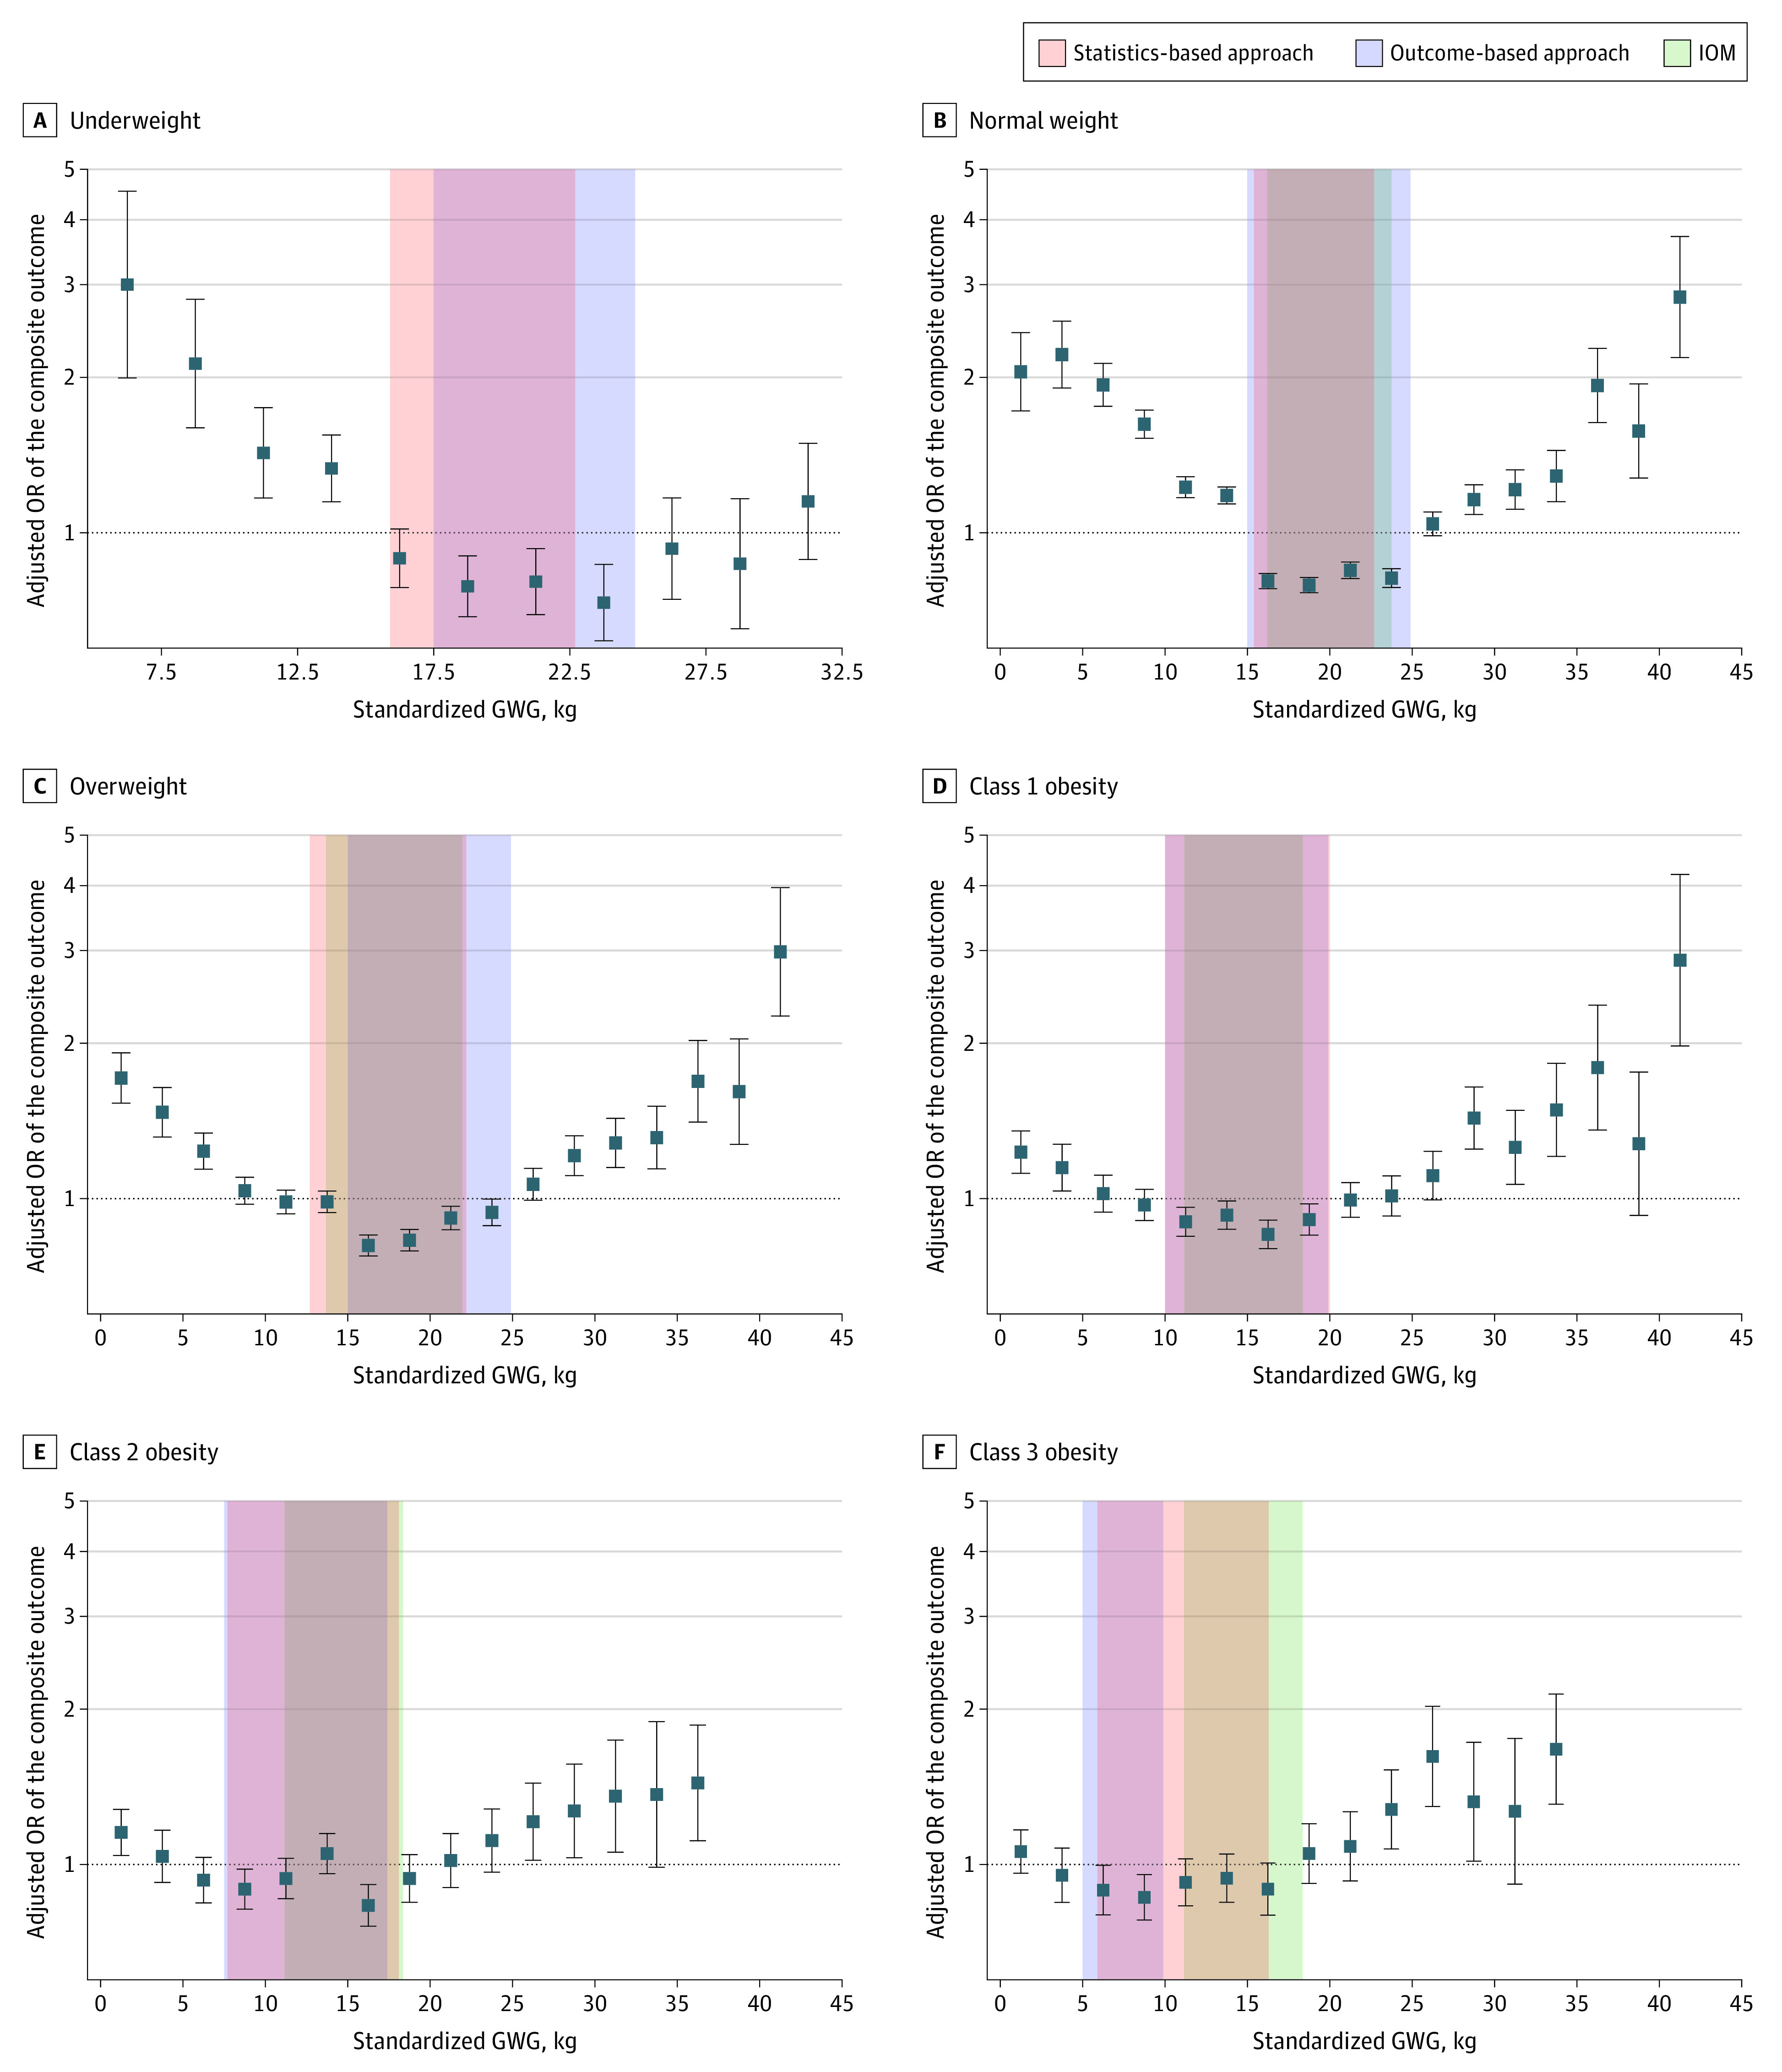
Design, setting and participants: This population-based cohort study of twin pregnancies using data from the National Center for Health Statistics was conducted between January 1, 2014, and December 31, 2018. Statistical analysis was performed from October 24, 2021, to May 7, 2022. The study population comprised 262 604 individuals between 18 and 45 years of age with live-born twins without congenital malformation between 24 and 42 weeks of gestation. Two approaches were used to determine the optimal GWG ranges: a statistics-based approach calculating IQRs of GWG in a low-risk population, and an outcome-based approach identifying GWG thresholds below or above which an adverse perinatal outcome increased.
Exposure: Gestational weight gain.
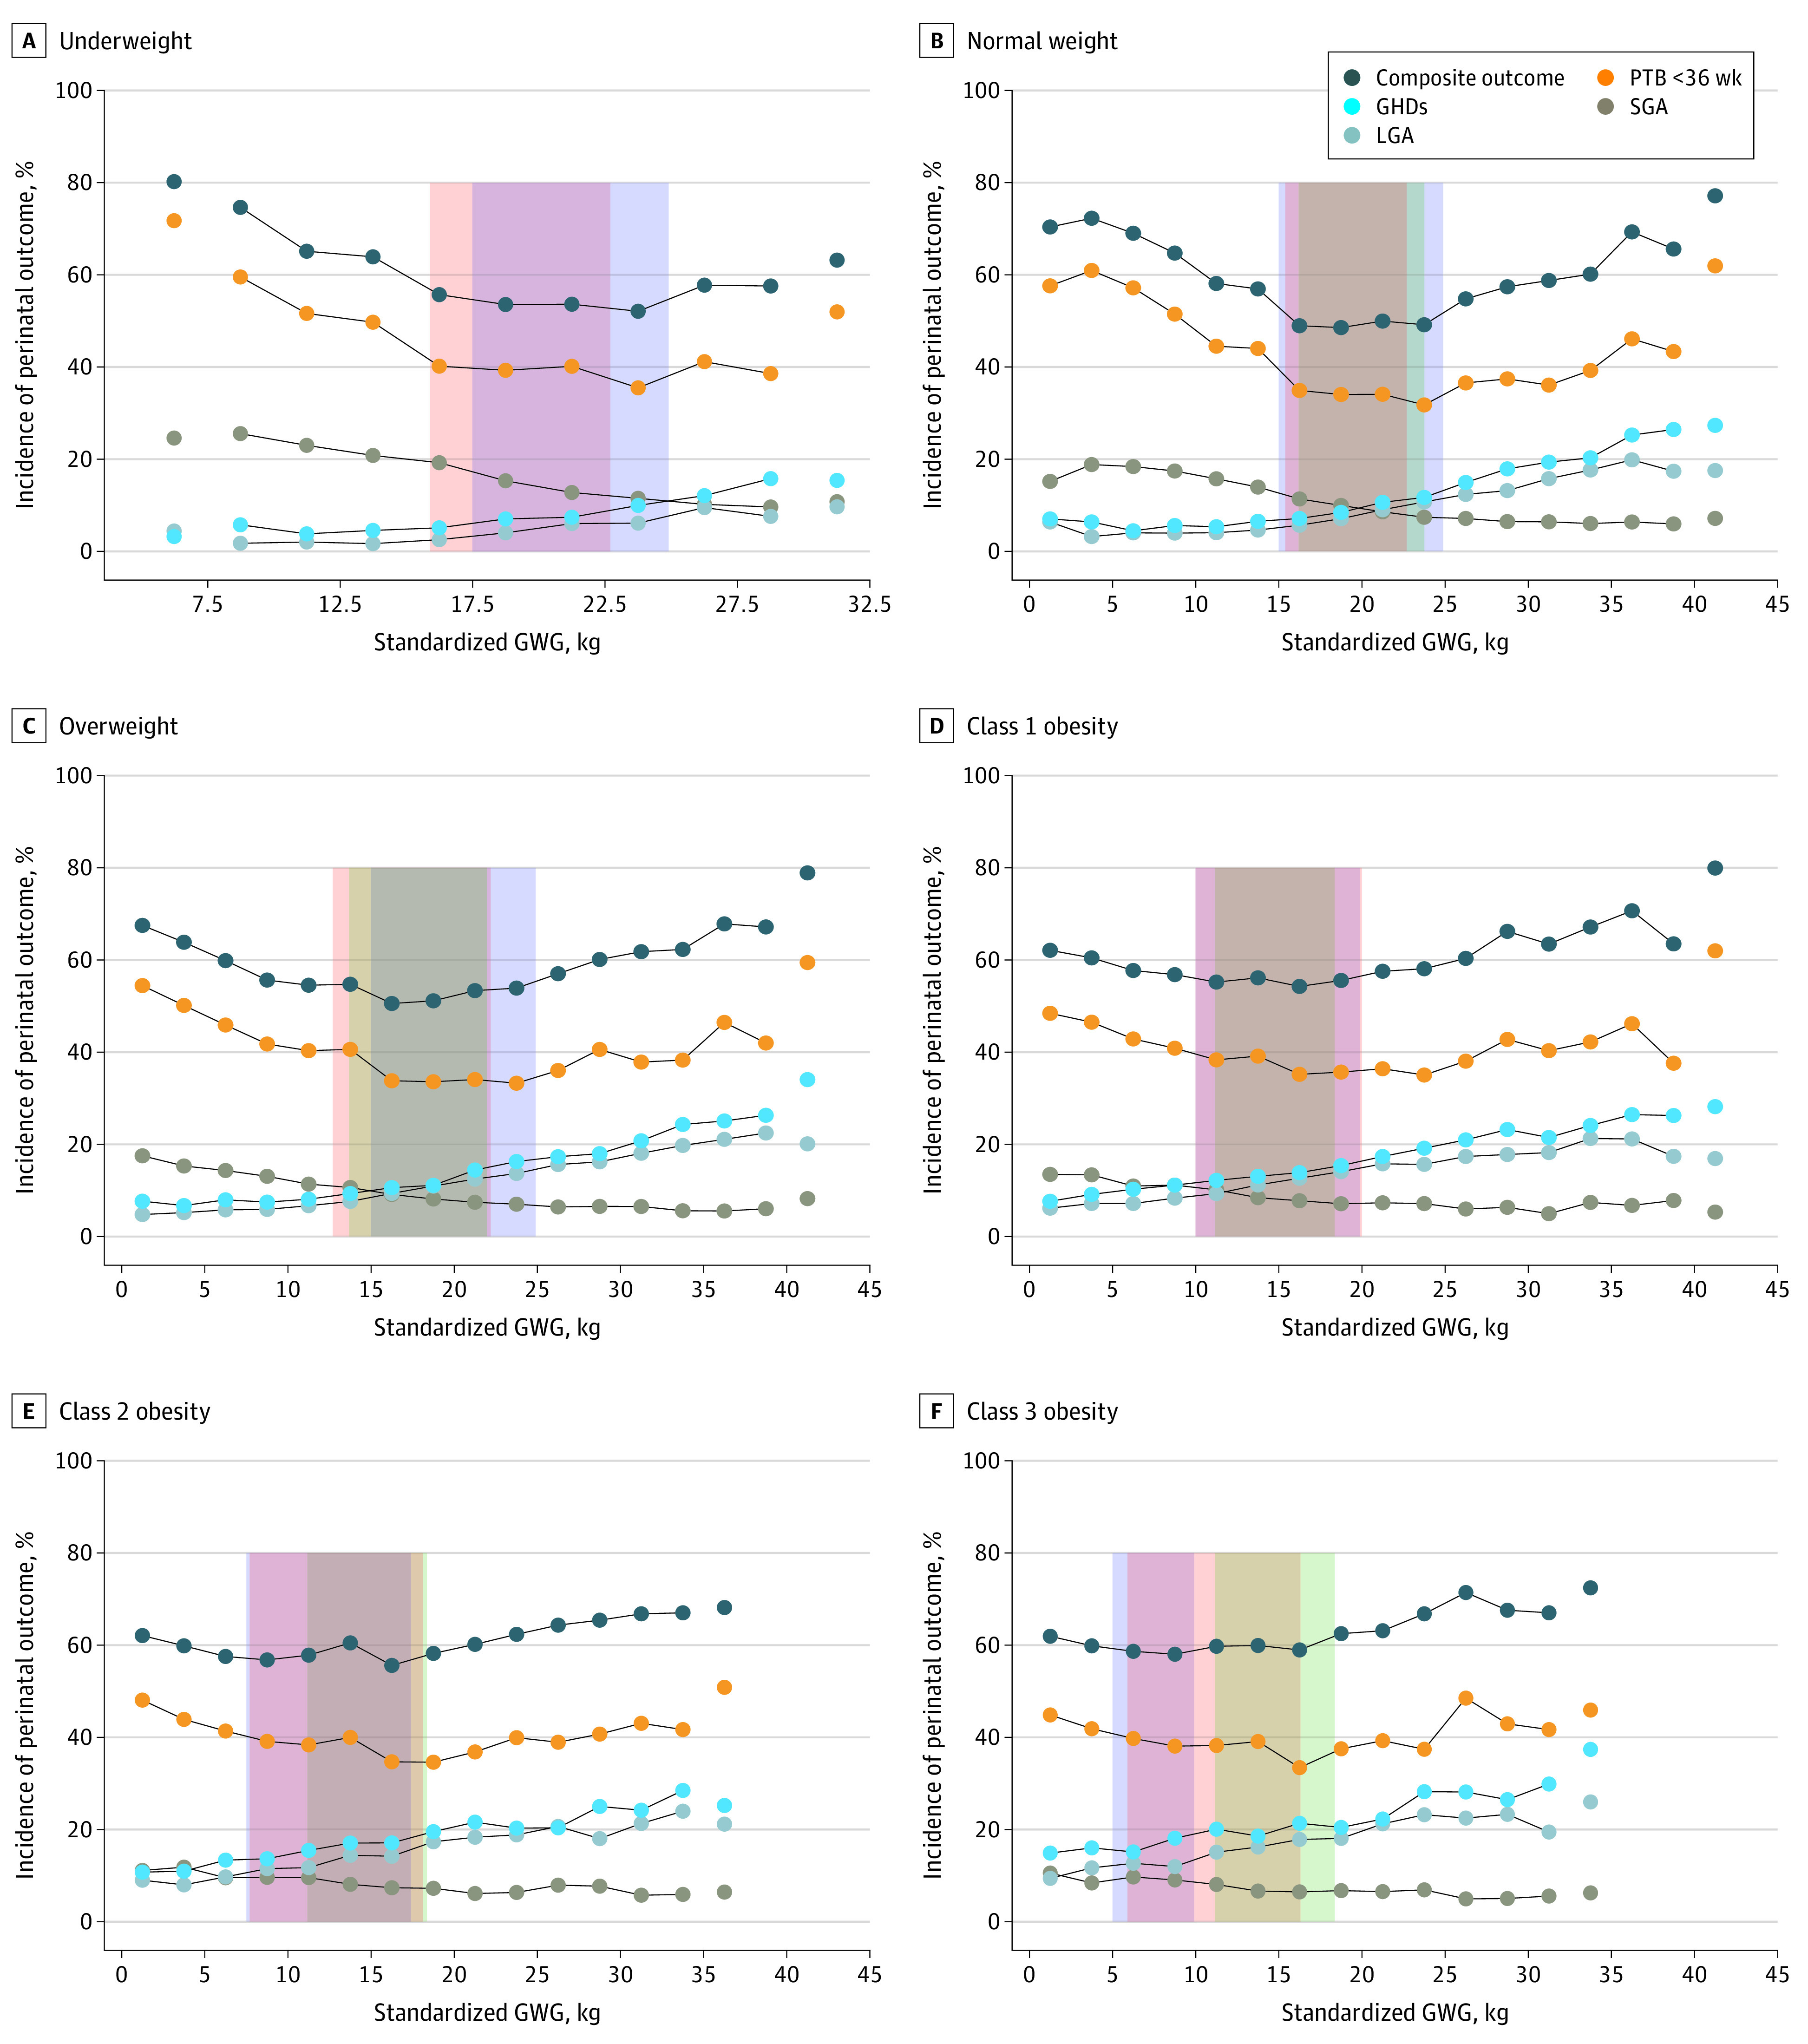
Main outcomes and measures: Preterm birth less than 36 weeks, gestational hypertensive disorders, small for gestational age status, large for gestational age status, and a composite outcome defined as any occurrence of the individual outcomes.
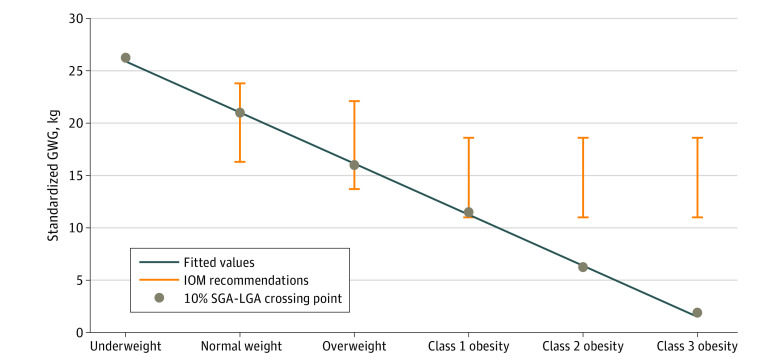
Results: The main sample comprised 200 810 individuals with twin pregnancies (mean [SD] maternal age, 30.4 [5.5] years; 1624 [0.8%] American Indian or Alaska Native, 13 031 [6.5%] Asian or Pacific Islander, 36 423 [18.1%] Black, and 149 732 [74.6%] White; and 137 409 [68.4%] multiparous). In the low-risk subgroup (n = 61 794), the IQRs of the total GWG after 36 weeks of gestation as assessed using a statistics-based approach and based on BMI group were 15.9 to 22.7 kg for underweight, 15.4 to 22.7 kg for normal weight, 12.7 to 22.2 kg for overweight, 10.0 to 20.0 kg for class 1 obesity, 7.7 to 18.1 kg for class 2 obesity, and 5.9 to 16.3 kg for class 3 obesity. The absolute risk of the composite outcome showed U-shaped associations with GWG across BMI categories. The optimal GWG ranges by 36 weeks identified using an outcome-based approach and BMI group were 17.5 to 24.9 kg for underweight, 15.0 to 24.9 kg for normal weight, 15.0 to 24.9 kg for overweight, 10.0 to 19.9 kg for class 1 obesity, 7.5 to 17.4 kg for class 2 obesity, and 5.0 to 9.9 kg for class 3 obesity. The multivariable logistic models assessed using the validation sample (n = 49 275) showed that GWG defined outside those optimal ranges was associated with preterm birth at less than 36 weeks, gestational hypertensive disorders, and small or large for gestational age.
Conclusions and relevance: This population-based cohort study found that optimal GWG ranges were similar for individuals with underweight and normal weight but decreased with increasing severity of obesity. The current US Institute of Medicine GWG recommendations may be too high for individuals with moderate or severe obesity.
Conflict of interest statement
Figures
Comment in
-
Establishing Optimal Gestational Weight Gain in Twin Pregnancies With a Prerequisite Rationale-A Tour de Force.JAMA Netw Open. 2022 Jul 1;5(7):e2222546. doi: 10.1001/jamanetworkopen.2022.22546. JAMA Netw Open. 2022. PMID: 35852806 No abstract available.
References
-
- Madar H, Goffinet F, Seco A, Rozenberg P, Dupont C, Deneux-Tharaux C; EPIMOMS (EPIdémiologie de la MOrbidité Maternelle Sévère) Study Group . Severe acute maternal morbidity in twin compared with singleton pregnancies. Obstet Gynecol. 2019;133(6):1141-1150. doi: 10.1097/AOG.0000000000003261 - DOI - PubMed
MeSH terms
LinkOut - more resources
Full Text Sources
Medical
