. 2022 Aug 22;7(16):e157360.
doi: 10.1172/jci.insight.157360.

Integrated single-cell transcriptomics and proteomics reveal cellular-specific responses and microenvironment remodeling in aristolochic acid nephropathy

Affiliations

Integrated single-cell transcriptomics and proteomics reveal cellular-specific responses and microenvironment remodeling in aristolochic acid nephropathy

Jiayun Chen et al. JCI Insight. .

Abstract

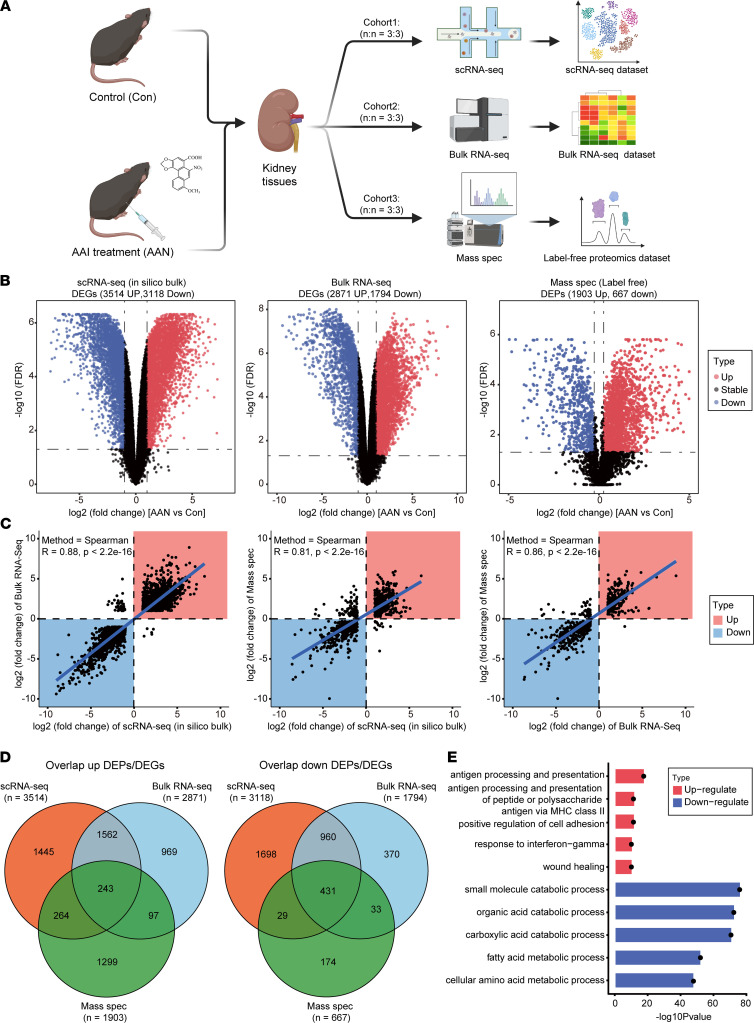
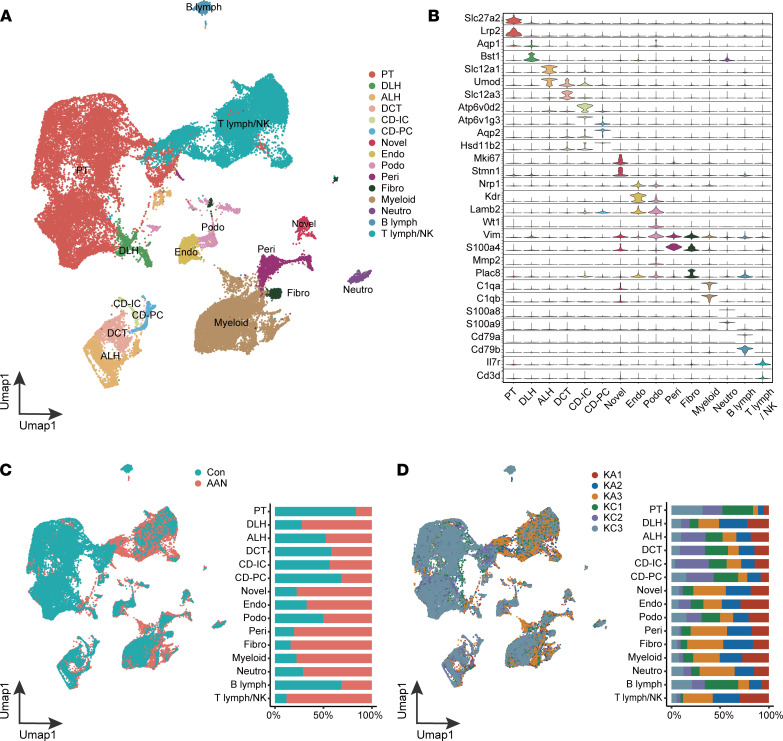
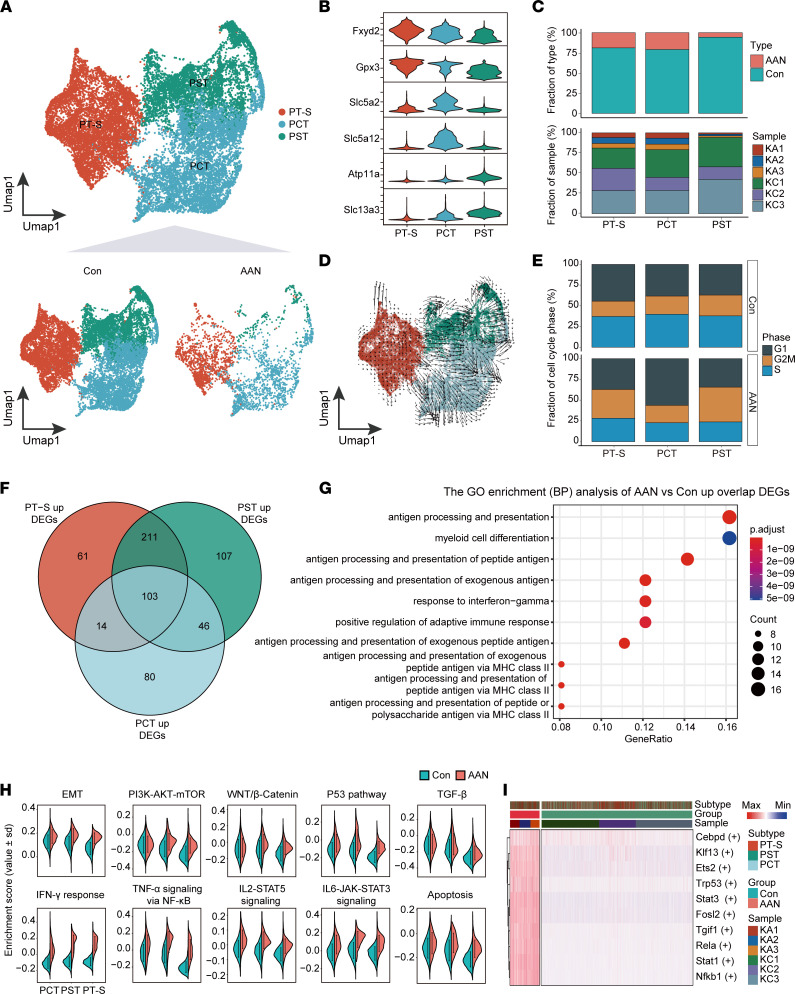
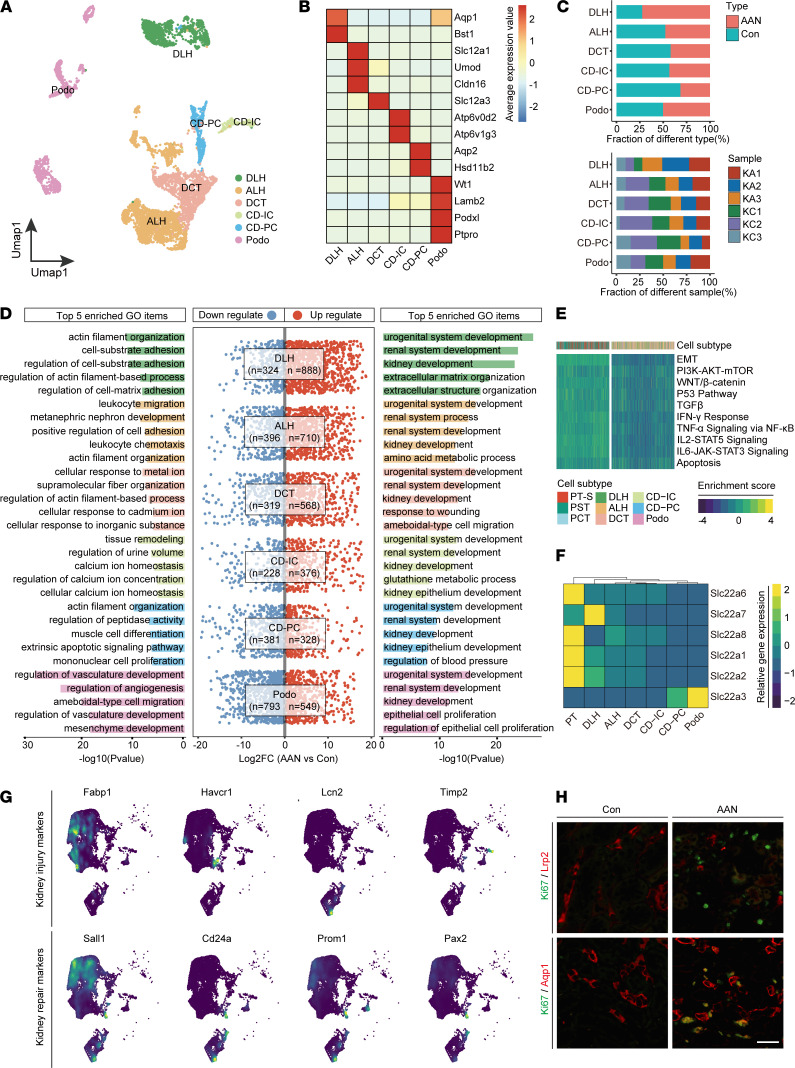
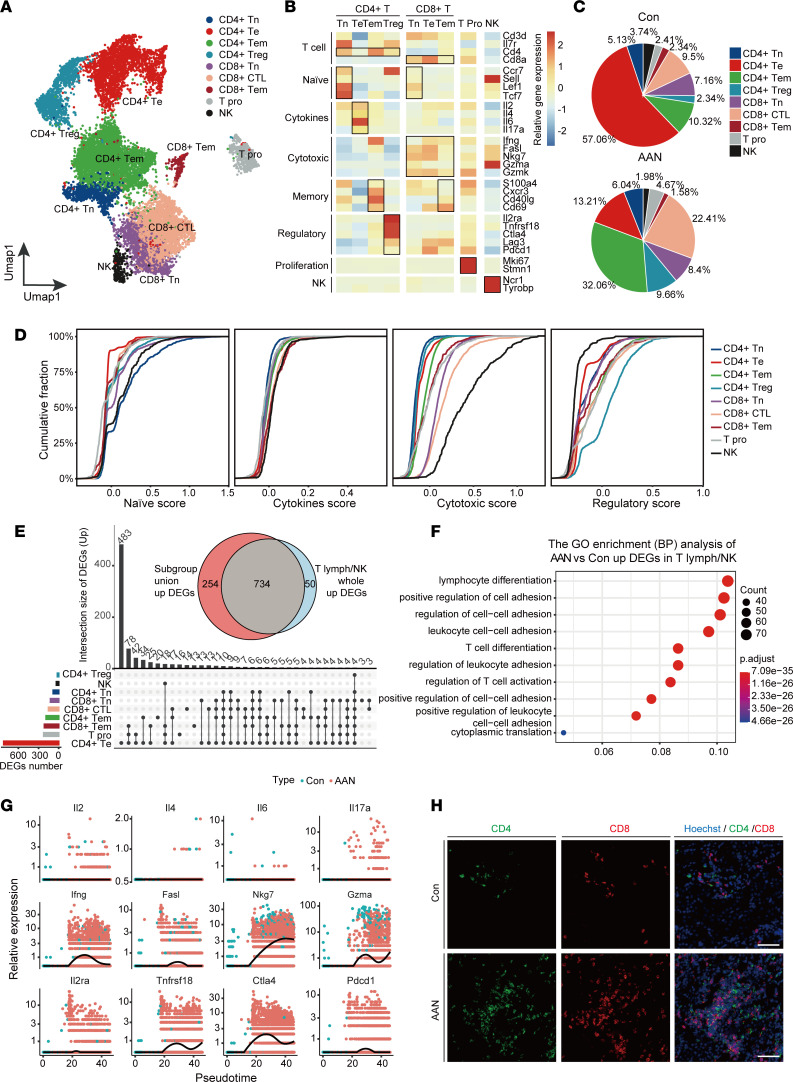
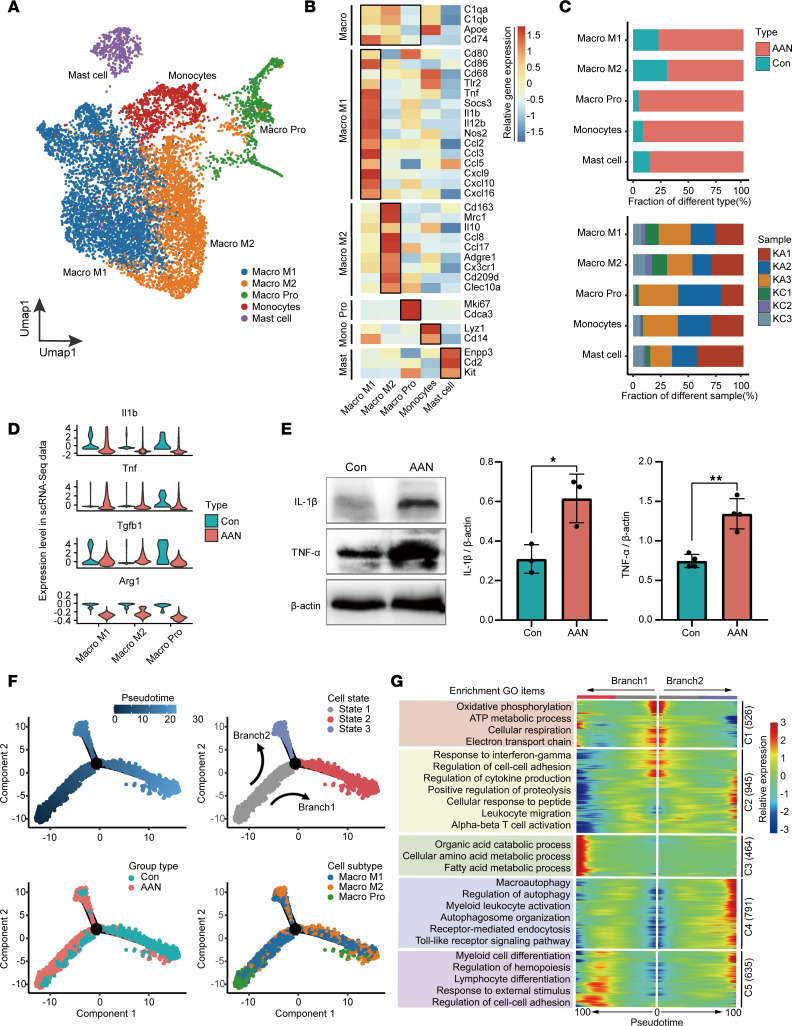
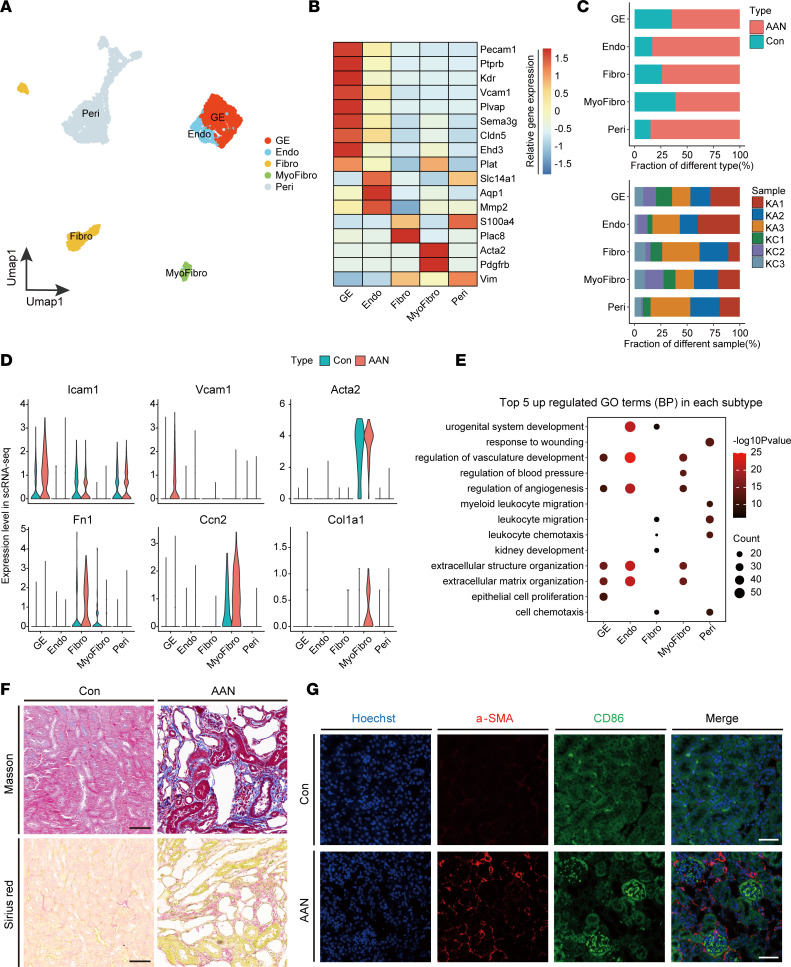
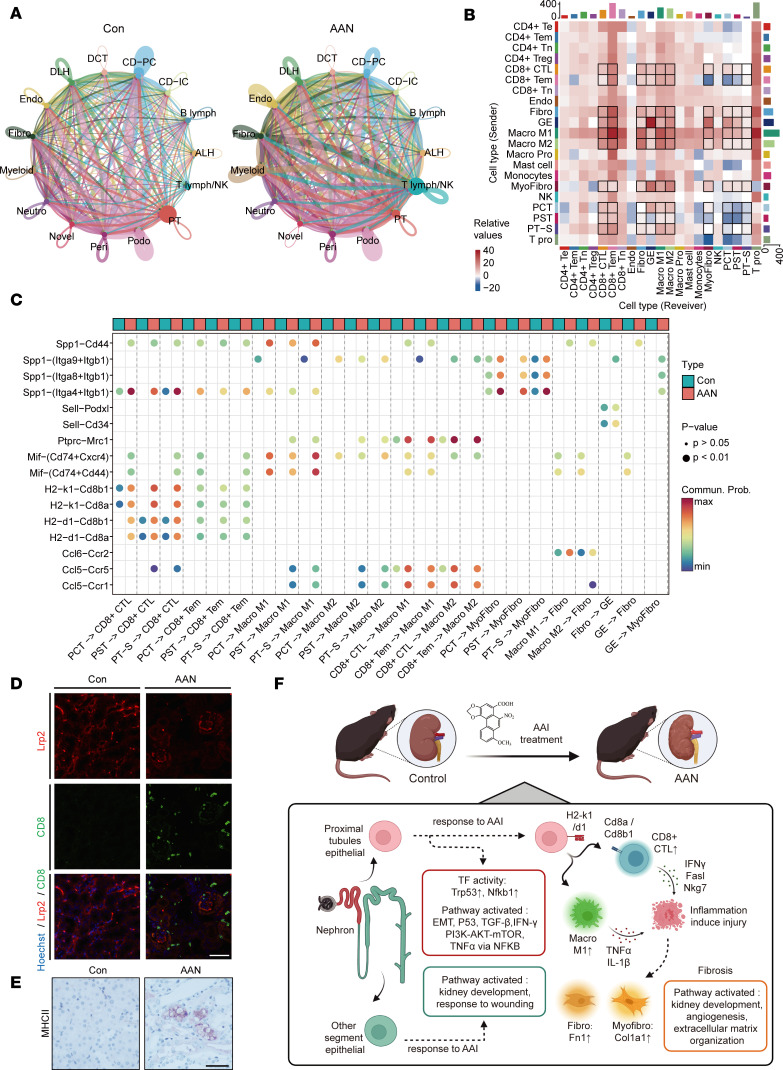
Aristolochic acid nephropathy (AAN) is characterized by acute proximal tubule necrosis and immune cell infiltration, contributing to the global burden of chronic kidney disease and urothelial cancer. Although the proximal tubule has been defined as the primary target of aristolochic acids I (AAI), the mechanistic underpinning of gross renal deterioration caused by AAI has not been explicitly explained, prohibiting effective therapeutic intervention. To this point, we employed integrated single-cell RNA-Seq, bulk RNA-Seq, and mass spectrometry-based proteomics to analyze the mouse kidney after acute AAI exposure. Our results reveal a dramatic reduction of proximal tubule epithelial cells, associated with apoptotic and inflammatory pathways, indicating permanent damage beyond repair. We found the enriched development pathways in other nephron segments, suggesting activation of reparative programs triggered by AAI. The divergent response may be attributed to the segment-specific distribution of organic anion channels along the nephron, including OAT1 and OAT3. Moreover, we observed dramatic activation and recruitment of cytotoxic T and macrophage M1 cells, highlighting inflammation as a principal contributor to permanent renal injury. Ligand-receptor pairing revealed that critical intercellular crosstalk underpins damage-induced activation of immune cells. These results provide potentially novel insight into the AAI-induced kidney injury and point out possible pathways for future therapeutic intervention.

Keywords: Apoptosis; Cell Biology; Mouse models; NF-kappaB; Nephrology.


Figures

Figure 1
Figure 1. Altered gene expression pattern in AAN tissue identified by multiomics.
(A) The workflow chart depicts the multiomics experimental design and initial data exploration in this study (n = 6 for each cohort). (B) The volcano plots show the differentially expressed genes or proteins in scRNA-Seq (in silico bulk) (left), bulk RNA-Seq (middle), and mass spec proteomics (right) data sets. The x axis illustrates the log2 fold change (FC), and the y axis indicates as –log10 FDR. The color of scatter point indicates the changed type of differentially expressed genes or proteins (red, up; black, stable; blue, down). (C) The scatter plots show the correlation relationship of DEGs and DEPs’ log2FC between scRNA-Seq (in silico bulk) and RNA-Seq experiments (left), scRNA-Seq (in silico bulk) and mass spec experiments (middle), and bulk RNA-Seq and mass spec experiments (right). Blue line indicates the Deming regression fit. Black dotted horizontal and vertical lines indicate 0 values (no differential expression) for the in silico bulk and mass spec data, respectively. The color of square indicates the changed type of differential expressed genes or proteins (red, upregulate; blue, downregulate). (D) The Venn plots indicate the overlap upregulated as well as downregulated DEG or DEP number across 3 data sets. (E) The bar plot shows the top 5 upregulated and downregulated GO enrichments items of overlap corresponding DEGs or DEPs across 3 data sets. The color of the bar indicates the type of enriched pathways (red, upregulate; blue, downregulate).
Figure 2
Figure 2. AAI exposure reprograms the single-cell transcriptome of mouse kidney.
(A) The UMAP visualization shows unsupervised scRNA-Seq clustering, revealing 15 distinct cellular identities. PT, proximal tubule; DLH, descending loop of Henle; ALH, ascending loop of Henle; DCT, distal convoluted tubule; CD-IC, collecting duct intercalated cell; CD-PC, collecting duct principal cell; Endo, endothelial; Podo, podocyte; Peri, pericytes and vascular smooth muscle cells; Fibro, fibroblast; Neutro, neutrophil; B lymph, B lymphocyte; T lymph, T lymphocyte; NK, NK cell. (B) The violin plot shows the expression levels of the respective selected markers across 15 clusters. The y axis shows the log-scale normalized reads count. (C) The UMAP plot (left panel) shows the sample type formation of cellular identities, accompanied by the bar plot (right panel) of sample type percentage in each cellular identities, colored according to group types. (D) The UMAP plot (left panel) shows the sample IDs of cellular identities, accompanied by the bar plot (right panel) of sample percentage in each cellular identities, colored according to sample IDs.
Figure 3
Figure 3. Proximal tubule–specific damage response to AAI.
(A) The UMAP visualization shows unsupervised scRNA-Seq clustering (up) and split into Con and AAN groups (down), revealing 3 distinct subtypes of PT cells. PT-S, proximal tubules subgroup; PCT, proximal convoluted tubules; PST, proximal straight tubules. (B) The violin plot shows the expression levels of respective selected markers across 3 cellular subtypes. The y axis shows the log-scale normalized reads count. (C) The bar plot shows the percentages of group types (upper panel) and sample origin (lower panel) of cells among 3 subtypes, colored according to group types and sample IDs, respectively. (D) The UMAP plot represents the PT cells colored by cell subtypes with Velocyto projection. (E) The bar plot shows percentages of cell cycle phase (G1, G2M, and S phase) of cells among 3 subtypes in the Con and the AAN groups. (F) The Venn plot represents the intersect and union number upregulated DEGs among 3 proximal tubules subtypes. (G) The bubble plot shows the top 10 GO enriched pathways of overlap upregulated DEGs among 3 cellular subtypes upon AAI treatment. (H) The split-violin plots show the distribution of enrichment scores of 10 GAVA hallmark pathways between the Con (green) and the AAN (red) groups. Data are shown as mean ± SD. (I) The heatmap depicts the relative activity scores of the top 10 regulons within different cellular subtypes, group types, and sample IDs.
Figure 4
Figure 4. Segment-specific reparative responses to AAI.
(A) The UMAP visualization shows unsupervised scRNA-Seq clustering, revealing 6 distinct subtypes of segment epithelial except PT cells. DLH, descending loop of Henle; ALH, ascending loop of Henle; DCT, distal convoluted tubule; CD-IC, collecting duct intercalated cell; CD-PC, collecting duct principal cell; Podo, podocyte. (B) The heatmap depicts the cell marker expression of each cell subtype in the segment epithelial subpopulation. (C) The bar plots show the percentages of group types (upper panel) and sample origin (lower panel) of cells among 6 subtypes, colored according to group types and sample ID, respectively. (D) The visualization shows the scatter plot of log2FC value in both upregulated and downregulated DEGs (middle), combined with the bar plot of downregulated (left) and upregulated (right) top 5 enriched GO items’ –log10(P value) in each subtype. FC, fold change; DEGs, differentially expressed genes; GO, gene ontology. (E) The heatmap shows the 10 hallmarks gene set enriched scores of PT subtype cells and other segment epithelial cells. (F) The heatmap shows the gene expression level of organic anion transporters and organic cation transporters of PT subtype cells and other segment epithelial cells. (G) The UMAP plot represents the expression level of kidney injury markers and repair markers in renal epithelial cells. (H) Representative immunofluorescence staining of Hoechst (blue), Ki67 (green), and Lrp2 or Aqp1 (red) in the Con and the AAN groups (n = 3 per group). Scale bar: 50 μm.
Figure 5
Figure 5. AAI induces robust renal infiltration of cytotoxic T cells.
(A) The UMAP visualization shows unsupervised scRNA-Seq clustering, revealing 9 distinct subtypes of T lymphocyte and NK cells. CD4+Tn, CD4+ T naive; CD4+Te, CD4+ T effector; CD4+Tem, CD4+ T memory; CD8+ Tn, CD8+ Tnaive; CD8+CTL, CD8+ cytotoxic T cell; CD8+Tem, CD8+ T memory; T Pro, T proliferation; NK, NK cell. (B) The heatmap depicts the cell markers expression of each cell subtype in the T lymphocyte and NK cells subpopulation. (C) The pie chart revealed the relative proportion of each cell subtype of T lymphocyte and NK cells in the Con (upper panel) and the AAN groups (lower panel). (D) Cumulative distribution function shows the distribution of naive, cytokine, cytotoxic, and regulatory state scores across T lymphocyte and NK cell subpopulation. (E) The UpSet plot depicts the concordance of upregulated differentially expressed gene (DEG) numbers of each cell subtype in T lymphocyte and NK cell subpopulations. The Venn plot shows the overlap genes number between subgroup union DEGs and whole T lymph/NK DEGs. (F) The bubble plot shows the GO enrichment BP items of AAN versus Con upregulated DEGs in the whole T lymph/NK subgroup. (G) The scatter plot shows the relative gene expression level of 12 cytokines (upper), cytotoxic (middle), and regulatory (lower) genes in pseudotime, colored according to group types. (H) Representative immunofluorescence staining of CD4 (green) and CD8 (red) (n = 3 per group). Scale bar: 100 μm.
Figure 6
Figure 6. Activated macrophage cells induce inflammatory damage in the AAN.
(A) The UMAP visualization shows unsupervised scRNA-Seq clustering, revealing 5 distinct subtypes of myeloid cells. Macro M1, macrophage M1; Macro M2, macrophage M2; Macro Pro, macrophage proliferation; Mono, monocytes. (B) The heatmap depicts the cell marker expression of each cell subtype in myeloid cell subpopulations. (C) The bar plot shows percentages of group types (upper panel) and sample origin (lower panel) of cells among 5 subtypes, colored according to group types and sample ID, respectively. (D) The violin plot shows the relative expression levels of key cytokines of 3 macrophage subtypes in scRNA-Seq data sets, colored according to group types. (E) The expression of proinflammatory factors IL-1β and TNF-α proteins by Western blotting and quantitative statistics correspond to groups. The P value was calculated by 2-tailed t test. *P < 0.05, **P < 0.01. (F) Monocle trajectory inference traces a path of pesudotime (top left), and label with the cell state (top right), group types (bottom left), and macrophage subtypes (bottom right). (G) The heatmap reveals the relative gene expression level of 5 clusters at 2 branches (from state1 to state2, and state1 to state3) based on branched expression analysis modeling (right), combined with the upregulative GO enriched items of each cluster (left).
Figure 7
Figure 7. Tissue microenvironment remodeling induced by AAI.
(A) The UMAP visualization shows unsupervised single-cell transcriptome clustering, revealing 5 distinct subtypes of stromal cells. GE, Glomerular endothelial; Endo, endothelial; Fibro, fibroblast; MyoFibro, MyoFioblast; Peri, pericytes and vascular smooth muscle cells. (B) The heatmap depicts the cell marker expression of each cell subtype in stromal cell subpopulations. (C) The bar plot shows percentages of group types (upper panel) and sample origin (lower panel) of cells among 5 subtypes, colored according to group types and sample ID, respectively. (D) The violin plots show the relative expression level of cytokines of 5 stromal subtypes in scRNA-Seq data sets, colored according to group types. (E) The bubble plot shows the GO enrichment BP items of the AAN versus Con upregulated DEGs in 5 stromal subtypes. (F) Kidney sections in renal parenchyma with Masson’s trichrome and Sirius red staining (n = 3 per group). Scale bar: 50 μm. (G) Immunofluorescence staining of Hoechst (blue), α-SMA (red), and CD86 (green) in Con and AAN renal tissues (n = 3 per group). Scale bar: 50 μm.
Figure 8
Figure 8. AAI rewires intercellular crosstalk in renal microenvironment.
(A) The chordal graph of total cell-to-cell interaction number of cell types between the Con and the AAN groups, colored according to each cell type; the thickness degree indicates the interaction strength between sender and receiver cell. (B) The heatmap shows the differential interaction numbers between the sender and receiver subtypes in the AAN group compared with Con group. The top bar plot represents the sum of incoming signaling, and the right represents the sum of outgoing signaling. (C) The bobble plot shows significant upregulated ligand-receptor pairs between sender and receiver cell, colored according to group types. (D) Immunofluorescence staining of Hoechst (blue), Lrp2 (red), and CD8 (green) in the Con and AAN renal tissues (n = 3 per group). Scale bar: 50 μm. (E) IHC staining of kidney sections for MHC II (n = 3 per group). Scale bar: 50 μm. (F) The scRNA-Seq profiles reveal cellular microenvironment features and cell-to-cell interaction, driving the renal injury and fibrosis in AAN.

References

    1. Li J, et al. The potential role of aquaporin 1 on aristolochic acid I induced epithelial mesenchymal transition on HK-2 cells. J Cell Physiol. 2018;233(6):4919–4925. doi: 10.1002/jcp.26310. - DOI - PubMed
    1. Shibutani S, et al. Selective toxicity of aristolochic acids I and II. Drug Metab Dispos. 2007;35(7):1217–1222. doi: 10.1124/dmd.107.014688. - DOI - PubMed
    1. Vanherweghem JL, et al. Rapidly progressive interstitial renal fibrosis in young women: association with slimming regimen including Chinese herbs. Lancet. 1993;341(8842):387–391. doi: 10.1016/0140-6736(93)92984-2. - DOI - PubMed
    1. Wankowicz Z, et al. Nephropathy after use of Chinese herbs: rapidly progressive interstitial renal fibrosis or renal vasculitis? Pol Arch Med Wewn. 1996;96(5):474–478. - PubMed
    1. Debelle FD, et al. Aristolochic acid nephropathy: a worldwide problem. Kidney Int. 2008;74(2):158–169. doi: 10.1038/ki.2008.129. - DOI - PubMed

Publication types

Substances