Multicenter Study
. 2022 Aug 22;7(16):e160332.
doi: 10.1172/jci.insight.160332.

Multicenter analysis of neutrophil extracellular trap dysregulation in adult and pediatric COVID-19

Affiliations
Multicenter Study

Multicenter analysis of neutrophil extracellular trap dysregulation in adult and pediatric COVID-19

Carmelo Carmona-Rivera et al. JCI Insight. .

Abstract

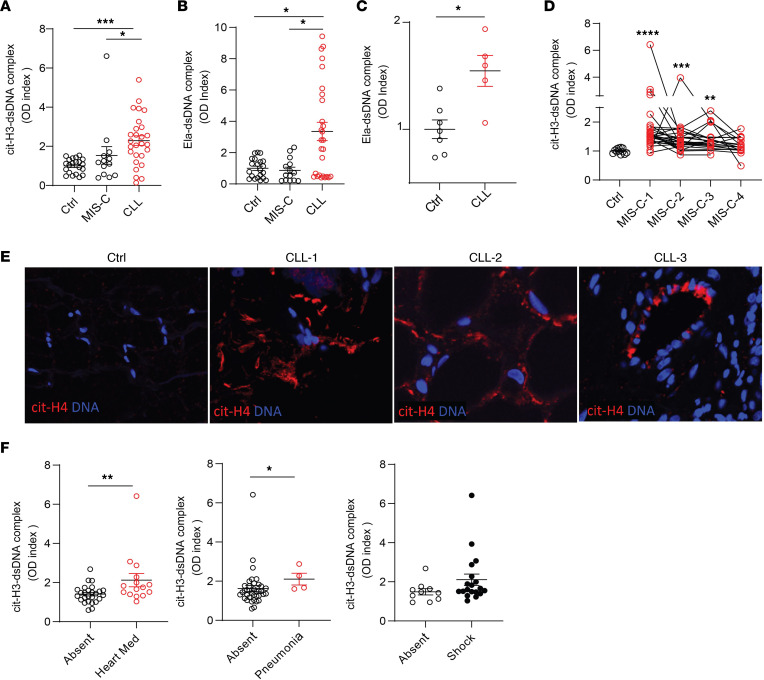
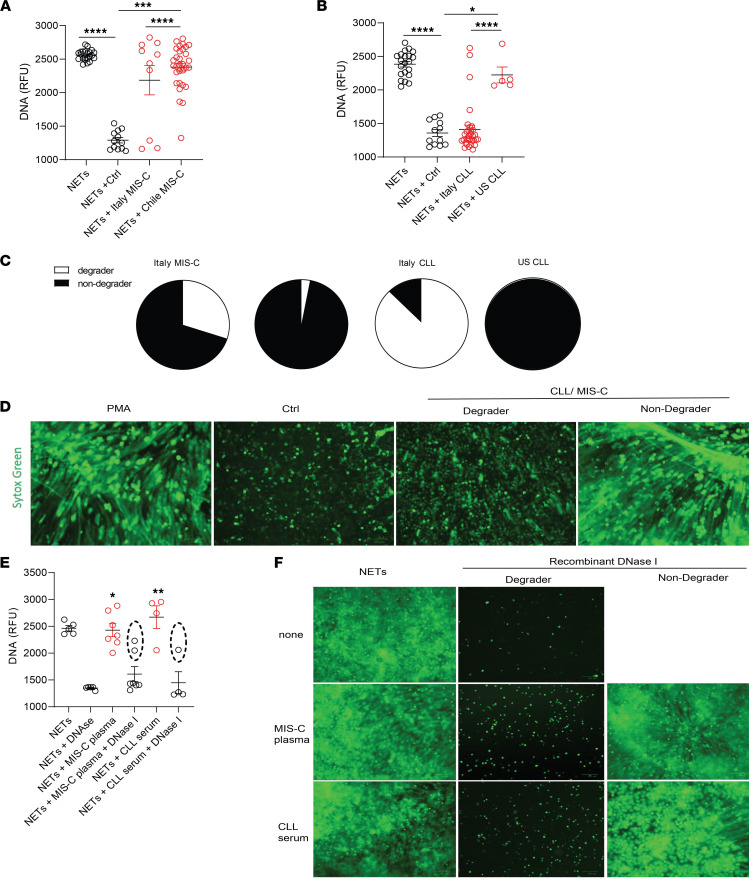
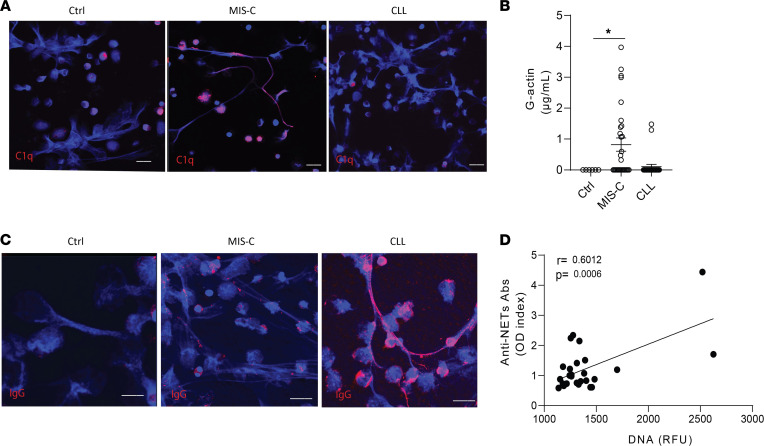
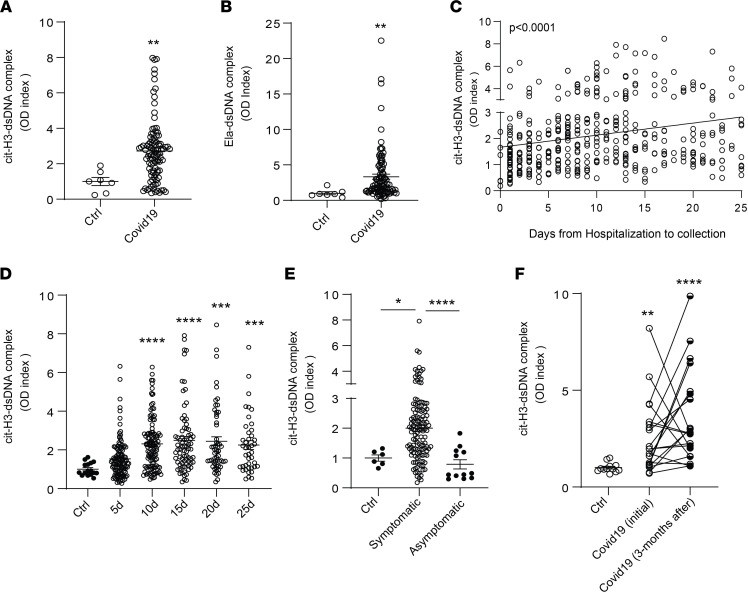
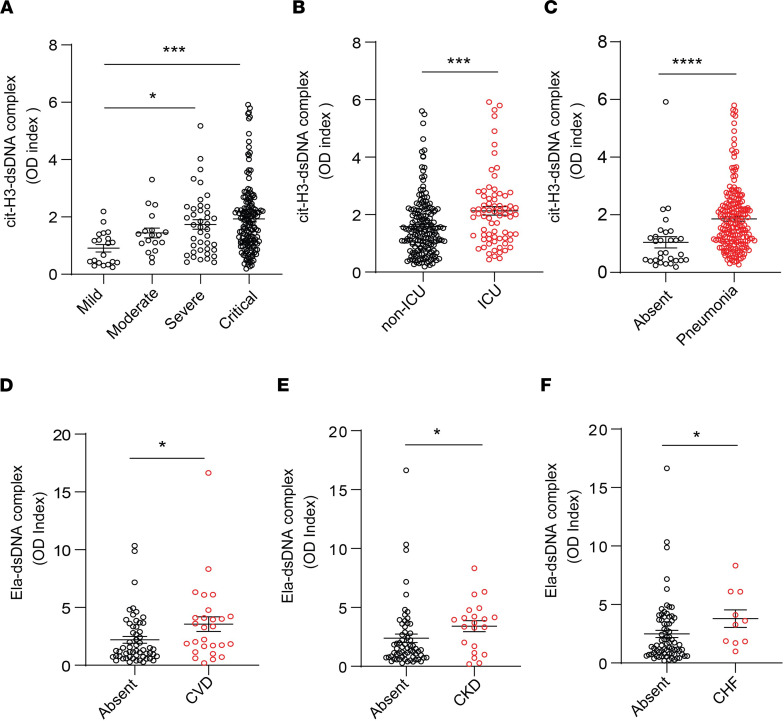
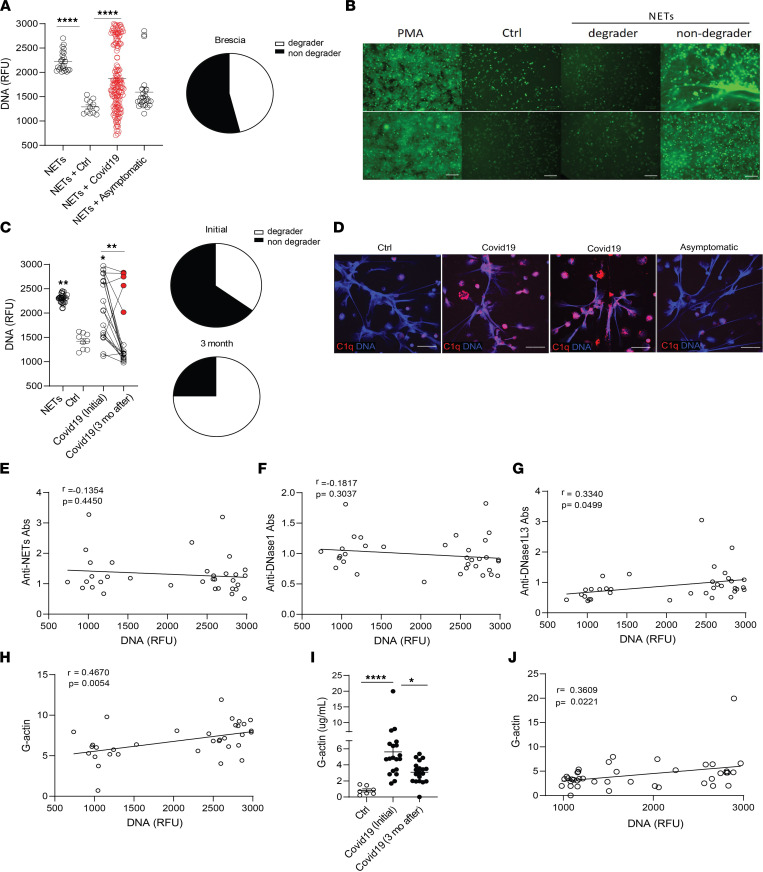
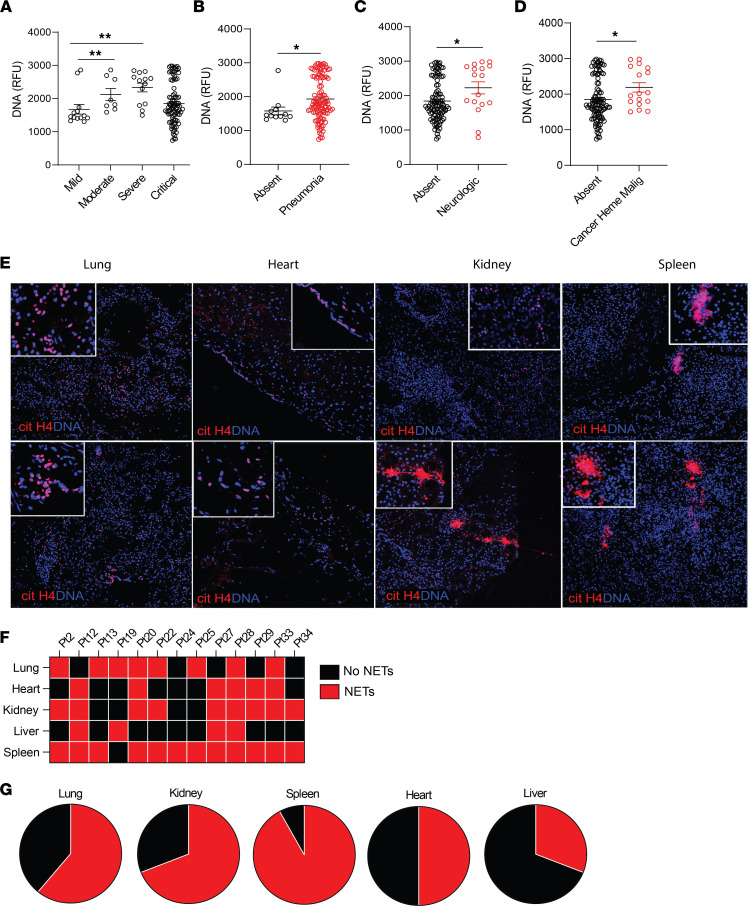
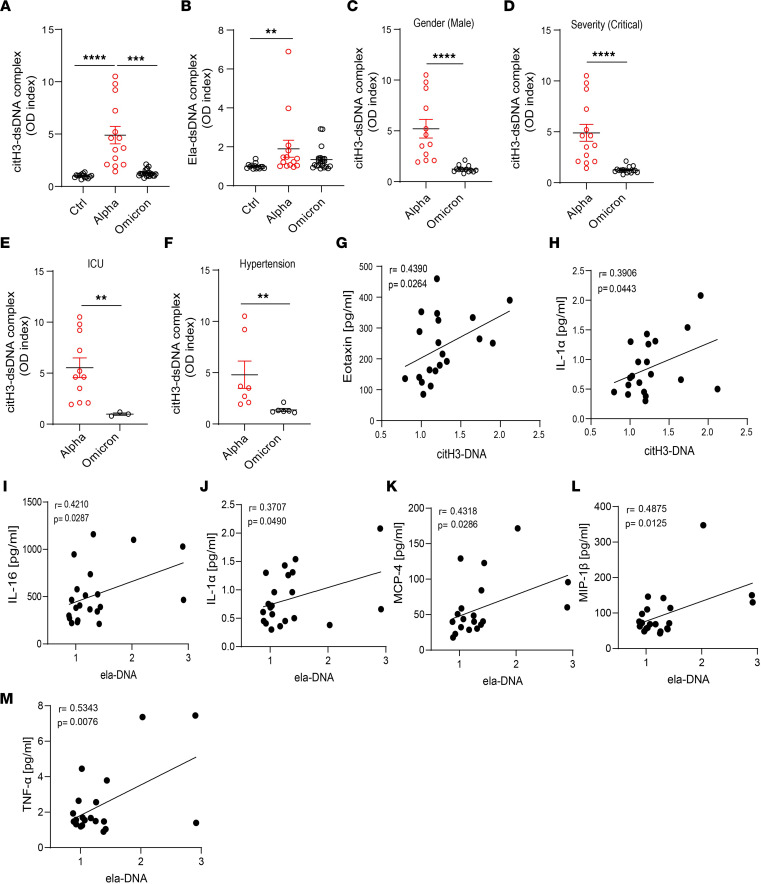
Dysregulation in neutrophil extracellular trap (NET) formation and degradation may play a role in the pathogenesis and severity of COVID-19; however, its role in the pediatric manifestations of this disease, including multisystem inflammatory syndrome in children (MIS-C) and chilblain-like lesions (CLLs), otherwise known as "COVID toes," remains unclear. Studying multinational cohorts, we found that, in CLLs, NETs were significantly increased in serum and skin. There was geographic variability in the prevalence of increased NETs in MIS-C, in association with disease severity. MIS-C and CLL serum samples displayed decreased NET degradation ability, in association with C1q and G-actin or anti-NET antibodies, respectively, but not with genetic variants of DNases. In adult COVID-19, persistent elevations in NETs after disease diagnosis were detected but did not occur in asymptomatic infection. COVID-19-affected adults displayed significant prevalence of impaired NET degradation, in association with anti-DNase1L3, G-actin, and specific disease manifestations, but not with genetic variants of DNases. NETs were detected in many organs of adult patients who died from COVID-19 complications. Infection with the Omicron variant was associated with decreased NET levels when compared with other SARS-CoV-2 strains. These data support a role for NETs in the pathogenesis and severity of COVID-19 in pediatric and adult patients.

Keywords: Infectious disease; Inflammation; Neutrophils.


Conflict of interest statement

Conflict of interest: The authors have declared that no conflict of interest exists.

Figures

Figure 1
Figure 1. NETs are identified in MIS-C and CLLs.
Citrullinated histone H3– and elastase-DNA (citH3-DNA and Ela-DNA) complexes were quantified in serum or plasma MIS-C and CLL samples obtained at 2 different visits for some patients from (A and B) Italy (MIS-C n = 14, CLL n = 27, ctrl n = 21), (C) USA (CLL n = 5, ctrl n = 5), and (D) Chile (MIS-C n = 27, ctrl n = 12). Mann-Whitney and Kruskal-Wallis analyses were performed. (E) Detection of citrullinated histone H4 (citH4, shown in red) and DNA (shown in blue) was performed in skin tissue. Microphotographs depict representative images in 3 CLL and 1 control (from a total of 8 CLL and 2 control specimens). Original magnification, 40×. (F) Levels of citH3-DNA complexes were correlated with the absence or presence of inotropes (Heart Med), pneumonia, or shock in Chilean patients with MIS-C. Results are the mean ± SEM. Mann-Whitney analysis was performed. *P < 0.05, **P < 0.01, ***P < 0.001, ****P < 0.0001. Ctrl, controls; OD, optical density.
Figure 2
Figure 2. Impaired NET degradation in MIS-C and CLLs.
NET degradation capabilities were measured in MIS-C serum or plasma obtained from (A) Italy (MIS-C n = 12, control n = 12) and Chile (MIS-C n = 27) and CLLs obtained from (B) Italy (CLL n = 27, control n = 12) and the United States (n = 5). Results are the mean ± SEM. Kruskal-Wallis analysis was performed. (C) Pie charts representing the proportion of degrader (white) and nondegrader (black) per cohort. (D) Representative images of PMA-generated NETs by healthy control neutrophils incubated with serum or plasma from pediatric controls or patients with MIS-C or CLLs. DNA is detected by SYTOX green and scale bar is 100 μm. (E) NET degradation capabilities were measured in serum or plasma of MIS-C (n = 7) and CLL (n = 4) samples in the presence or absence of recombinant DNase1. Samples within dashed ovals are those that did not respond to treatment with DNase1. Kruskal-Wallis analysis was performed. (F) Representative images of PMA-generated NETs incubated with serum or plasma from patients with MIS-C or CLLs in the presence or absence of recombinant DNase1. DNA is detected by SYTOX green and scale bar is 100 μm; *P < 0.05, **P < 0.01, ***P < 0.001, ****P < 0.0001. RFU, relative fluorescence units.
Figure 3
Figure 3. Multiple factors impair NET degradation in MIS-C and CLLs.
(A) Representative confocal images of immunofluorescence analysis of C1q (red) in PMA-generated NETs by healthy control neutrophils after incubation with serum or plasma from patients with MIS-C or CLLs. DNA is detected in blue and scale bar is 10 μm. (B) Levels of circulating G-actin measured in MIS-C (n = 27) and CLL (n = 26) samples compared with pediatric healthy controls (n = 19). Results are the mean ± SEM. Kruskal-Wallis analysis was performed. *P < 0.05. (C) Representative confocal images of immunofluorescence analysis of immunoglobulin G (IgG) (red) in PMA-generated NETs after incubation with serum or plasma from patients with MIS-C or CLLs. Scale bar is 10 μm. (D) Correlation analysis of levels of anti-NET Abs and degradation capabilities; Pearson analysis was used. Ctrl, controls; OD, optical density; RFU, relative fluorescence units.
Figure 4
Figure 4. NET remnants are detected in plasma and serum of adult Italian COVID-19 patients.
Plasma levels of (A) citH3- and (B) Ela-dsDNA complexes were measured in adult COVID-19 samples obtained from different cities in Italy (Brescia, Monza, Turin; n = 99, control n = 7); Mann-Whitney was used. (C and D) Serum levels of citH3-DNA complexes were elevated in samples obtained up to 25 days (5d n = 118, 10d n = 117, 15d n = 77, 20d n = 57, 25d n = 42) of hospitalization in samples collected in Brescia, Italy. Kruskal-Wallis analysis was used. Levels of citH3-DNA complexes were measured in (E) symptomatic (n = 77) and asymptomatic (n = 12) COVID-19 samples. (F) Levels of citH3-DNA complexes at initial (first 6 days after hospitalization) and 3 months after diagnosis of infection with SARS-CoV-2 (n = 20). Results are the mean ± SEM. Kruskal-Wallis analysis was used, *P < 0.05, **P < 0.01, ***P < 0.001, ****P < 0.0001. OD, optical density; ctrl, controls; d, days from diagnosis.
Figure 5
Figure 5. NET remnants are present in plasma and serum of adult COVID-19 patients and correlate with disease severity and comorbidities.
Serum levels of (A) citH3-DNA complexes collected within the first 5 days after hospitalization were elevated in critical patients (mild n = 20, moderate n = 18, severe n = 41, critical n = 156). Kruskal-Wallis analysis was used. Elevated levels of citH3-DNA complexes were detected in (B) COVID-19 patients admitted to the intensive care unit (ICU; non-ICU n = 175, ICU n = 73) and (C) those with pneumonia (absent n = 30, pneumonia n = 203); Mann-Whitney was used. Plasma levels of Ela-DNA complexes were elevated in patients with COVID-19 patients who displayed (D) cardiovascular disease (CVD) (absent n = 56, CVD n = 27), (E) chronic kidney disease (CKD) (absent n = 62, CKD n = 21), and (F) congestive heart failure (CHF) (absent n = 73, CHF n = 10). Results are the mean ± SEM. Mann-Whitney was used. *P < 0.05, ***P < 0.001, ****P < 0.0001. OD, optical density.
Figure 6
Figure 6. G-actin associates with decreased degradation of NETs in adult Italian COVID-19 patients.
(A) NET degradation capabilities were measured in COVID-19 serum samples obtained from Brescia, Italy (COVID-19 n = 153, asymptomatic n = 26, control n = 12); pie chart depicts the proportion of degrader (white) and nondegrader (black) serum. Results are the mean ± SEM. Kruskal-Wallis analysis was performed. (B) Representative images of PMA generated NETs incubated with serum from controls (n = 13) or patients with COVID-19 (n = 179). DNA is detected by SYTOX green and scale bar is 100 μm. (C) NET degradation capabilities were assessed in 20 patients at initial infection and 3 months after. Pie charts depicting the proportion of degrader (white) and nondegrader (black) at initial and 3 months after infection with SARS-CoV-2. Kruskal-Wallis analysis was performed. (D) Representative confocal images of immunofluorescence analysis of C1q deposition (red) in PMA-generated NETs by healthy control neutrophils after incubation with serum from symptomatic and asymptomatic COVID-19 patients. DNA is detected in blue and scale bar is 10 μm. Pearson correlation analysis of (E) anti-NET, (F) anti-DNase1, and (G) anti-DNase1L3 Abs and (H) G-actin measured in serum from COVID-19 patients with NET degradation capabilities (DNA). (I) Serum G-actin levels in patients with COVID-19 (n = 20) at initial and 3 months after diagnosis of infection with SARS-CoV-2. Kruskal-Wallis analysis was performed. (J) Pearson correlation analysis of serum G-actin levels in patients with COVID-19 at initial and 3 months after infection with SARS-CoV-2 with NET degradation capabilities (DNA). *P < 0.05, **P < 0.01, ****P < 0.0001; RFU, relative fluorescence units; ctrl, control; mo, months.
Figure 7
Figure 7. Impairment in NET degradation correlates with comorbidities, and NETs are detected in pulmonary and extrapulmonary tissues in COVID-19.
(A) Decreased serum NET degradation capabilities in patients with severe COVID-19 from Brescia, Italy (mild n = 17, moderate n = 8, severe n = 13, critical n = 89). Kruskal-Wallis analysis was used. Serum samples from COVID-19 patients with (B) pneumonia (absent n = 17, pneumonia n = 109), (C) neurological manifestations (absent n = 103, neurological n = 17), and (D) malignancy (absent n = 110, malignancy n = 17) displayed decreased capabilities of NET degradation. Results are the mean ± SEM. Mann-Whitney was used. (E) Representative confocal images of citH4 (red) and DNA (blue) detected in lung, heart, kidney, and spleen tissues obtained from postmortem COVID-19 patients (n = 13). Original magnification, ×20, ×40 (insets). (F) Summary of tissue NET detection in each patient (n = 13). (G) Pie charts depicting global NET detection per tissue analyzed. Red indicates positive to citH4 (NETs); black indicates no presence of citH4 signal (no NETs); *P < 0.05, **P < 0.01. RFU, relative fluorescence units.
Figure 8
Figure 8. NET remnants are lower in adult unvaccinated patients infected with the Omicron variant.
Plasma levels of (A) citH3- and (B) Ela-dsDNA complexes were measured in Italian COVID-19 patients infected with SARS-CoV-2 Alpha or Omicron variants (ctrl n = 14, Alpha n = 14, Omicron n = 21). Kruskal-Wallis analysis was used. (C) Men infected with the Alpha variant of SARS-CoV-2 displayed elevated levels of citH3-DNA complexes (Alpha, n = 12, Omicron, n = 13). Patients infected with the Omicron variant and with critical severity had (D) lower levels of NETs as assessed by decreased levels of plasma citH3-DNA complexes (Alpha n = 14, Omicron n = 16). (E) Patients with COVID-19 in the ICU displayed decreased levels of citH3-DNA complexes when infected with the Omicron variant (Alpha, n = 11, Omicron n = 3). (F) COVID-19 patients with concomitant hypertension displayed decreased levels of citH3-DNA complexes when infected with the Omicron variant (Alpha n = 7, Omicron n = 6), Mann-Whitney was used. Results are the mean ± SEM. **P < 0.01, ***P < 0.001, ****P < 0.0001. Correlation analysis of citH3-DNA complexes with levels of (G) eotaxin or (H) IL-1α. Correlation analysis of Ela-DNA complexes with levels of (I) IL-16, (J) IL-1α, (K) MCP-4, (L) MIP-1β, or (M) TNF-α. Pearson analysis was used. OD, optical density; Ctrl, controls.

Update of

  • Multicenter analysis of neutrophil extracellular trap dysregulation in adult and pediatric COVID-19.
    Carmona-Rivera C, Zhang Y, Dobbs K, Markowitz TE, Dalgard CL, Oler AJ, Claybaugh DR, Draper D, Truong M, Delmonte OM, Licciardi F, Ramenghi U, Crescenzio N, Imberti L, Sottini A, Quaresima V, Fiorini C, Discepolo V, Lo Vecchio A, Guarino A, Pierri L, Catzola A, Biondi A, Bonfanti P, Poli Harlowe MC, Espinosa Y, Astudillo C, Rey-Jurado E, Vial C, de la Cruz J, Gonzalez R, Pinera C, Mays JW, Ng A, Platt A; NIH COVID Autopsy Consortium; COVID STORM Clinicians; Drolet B, Moon J, Cowen EW, Kenney H, Weber SE, Castagnoli R, Magliocco M, Stack MA, Montealegre G, Barron K, Hewitt SM, Arkin LM, Chertow DS, Su HC, Notarangelo LD, Kaplan MJ. Carmona-Rivera C, et al. medRxiv [Preprint]. 2022 Mar 3:2022.02.24.22271475. doi: 10.1101/2022.02.24.22271475. medRxiv. 2022. Update in: JCI Insight. 2022 Aug 22;7(16):e160332. doi: 10.1172/jci.insight.160332. PMID: 35262093 Free PMC article. Updated. Preprint.

Similar articles

Cited by

References

    1. Atzrodt CL, et al. A guide to COVID-19: a global pandemic caused by the novel coronavirus SARS-CoV-2. FEBS J. 2020;287(17):3633–3650. doi: 10.1111/febs.15375. - DOI - PMC - PubMed
    1. Li Q, et al. Early transmission dynamics in Wuhan, China, of novel coronavirus-infected pneumonia. N Engl J Med. 2020;382(13):1199–1207. doi: 10.1056/NEJMoa2001316. - DOI - PMC - PubMed
    1. Tao K, et al. The biological and clinical significance of emerging SARS-CoV-2 variants. Nat Rev Genet. 2021;22(12):757–773. doi: 10.1038/s41576-021-00408-x. - DOI - PMC - PubMed
    1. Hu B, et al. The cytokine storm and COVID-19. J Med Virol. 2021;93(1):250–256. doi: 10.1002/jmv.26232. - DOI - PMC - PubMed
    1. Costela-Ruiz VJ, et al. SARS-CoV-2 infection: the role of cytokines in COVID-19 disease. Cytokine Growth Factor Rev. 2020;54:62–75. doi: 10.1016/j.cytogfr.2020.06.001. - DOI - PMC - PubMed

Publication types

Supplementary concepts