. 2022 Jul 19;18(7):e1010302.
doi: 10.1371/journal.pgen.1010302. eCollection 2022 Jul.

HAP40 is a conserved central regulator of Huntingtin and a potential modulator of Huntington's disease pathogenesis

Affiliations

HAP40 is a conserved central regulator of Huntingtin and a potential modulator of Huntington's disease pathogenesis

Shiyu Xu et al. PLoS Genet. .

Abstract

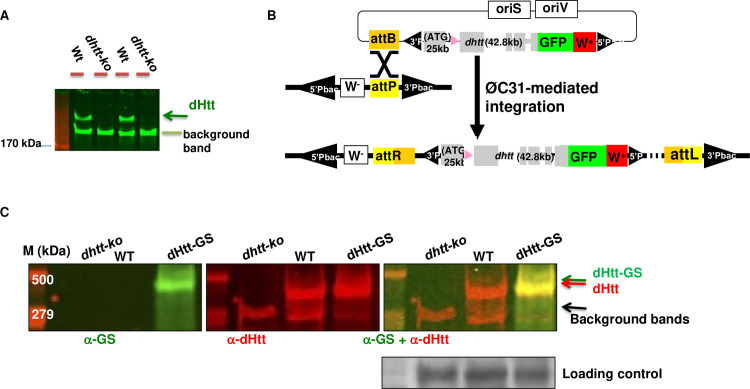
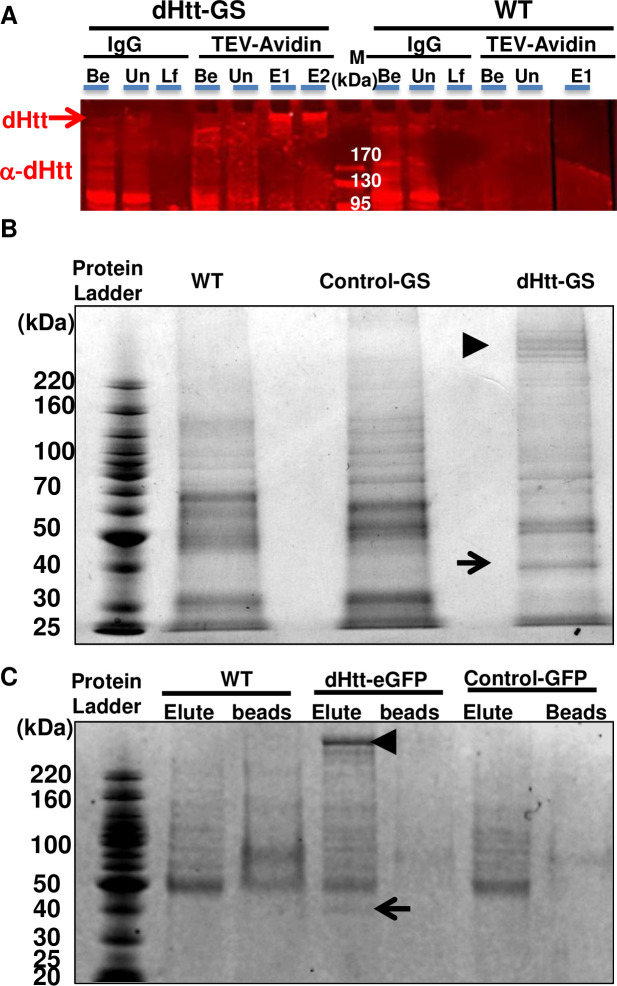
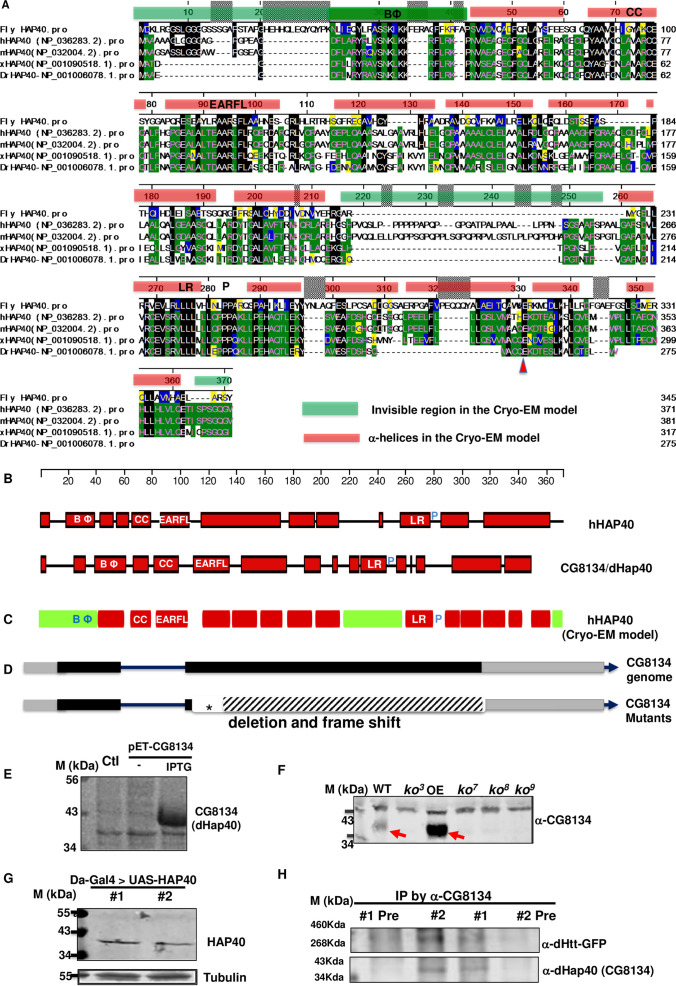
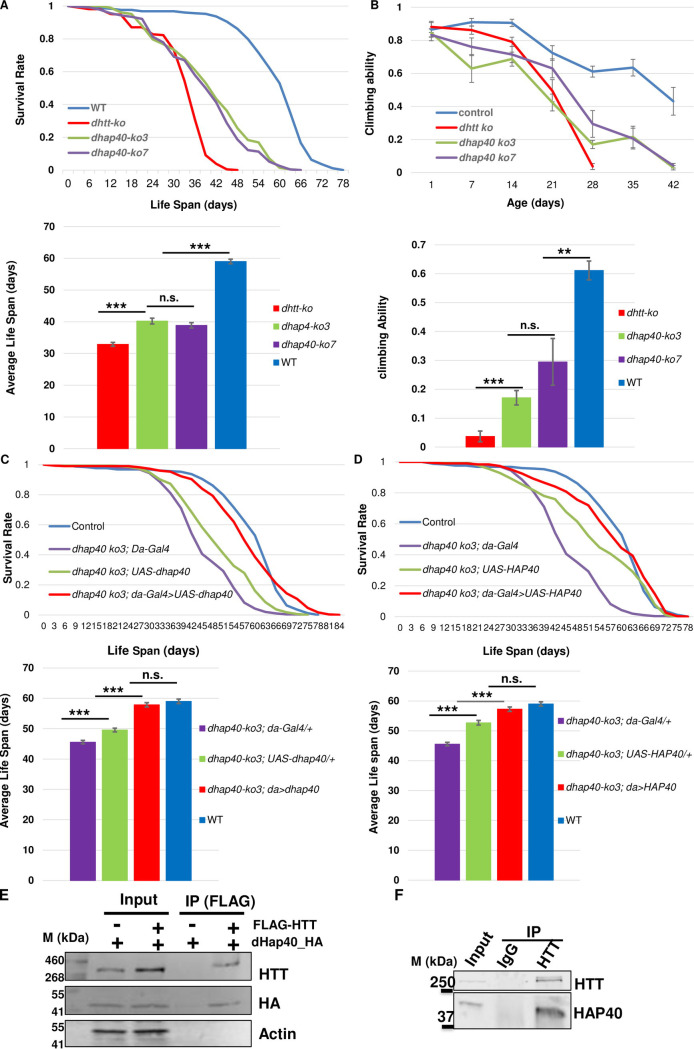
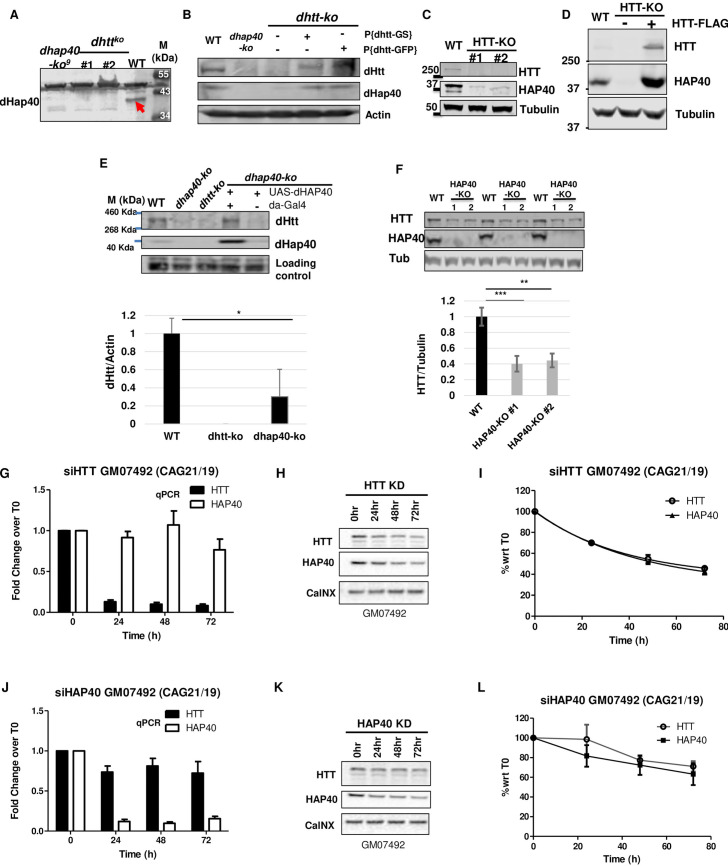
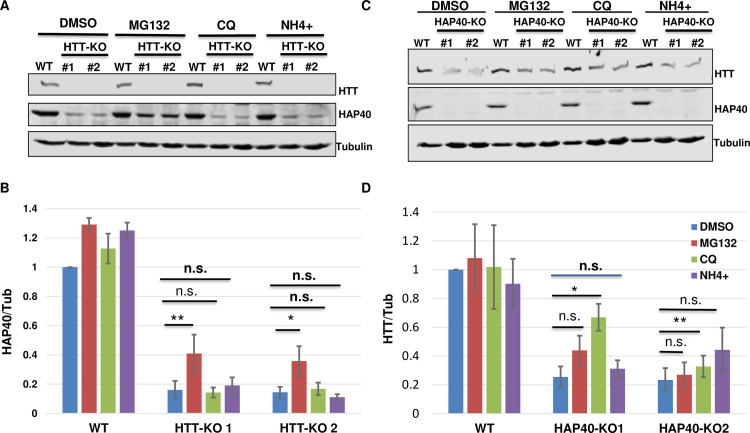
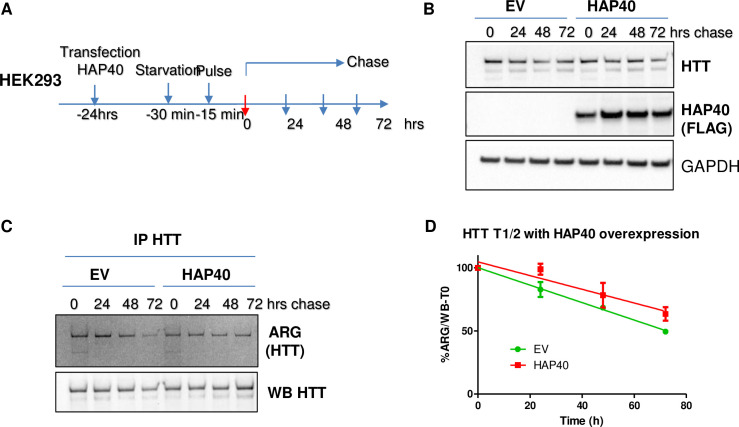
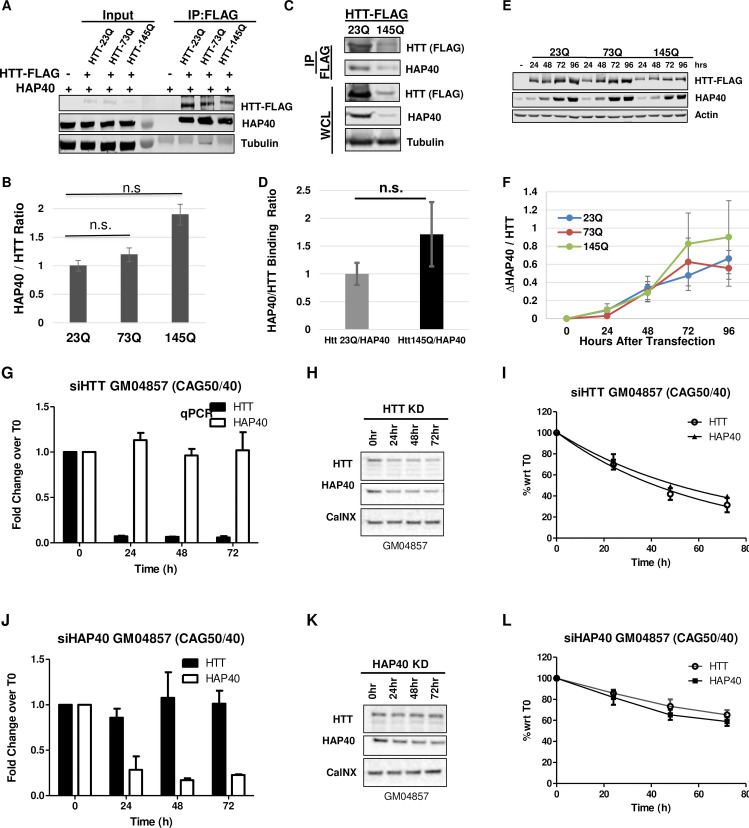
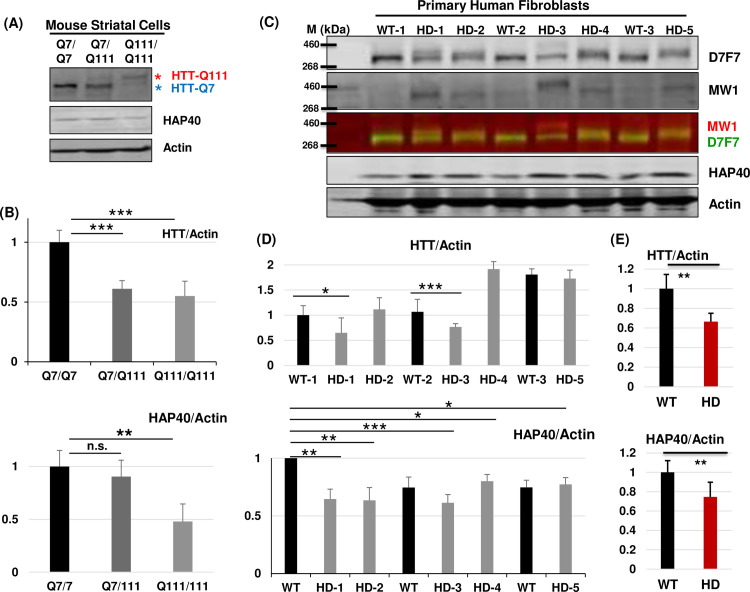
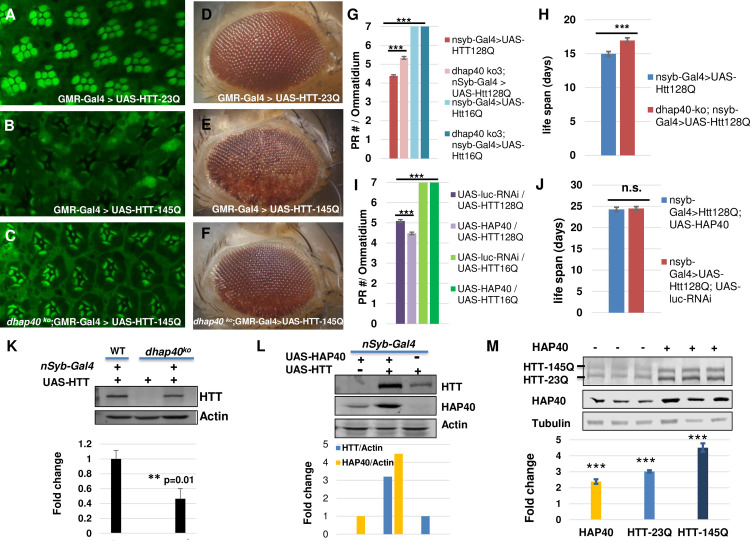
Perturbation of huntingtin (HTT)'s physiological function is one postulated pathogenic factor in Huntington's disease (HD). However, little is known how HTT is regulated in vivo. In a proteomic study, we isolated a novel ~40kDa protein as a strong binding partner of Drosophila HTT and demonstrated it was the functional ortholog of HAP40, an HTT associated protein shown recently to modulate HTT's conformation but with unclear physiological and pathologic roles. We showed that in both flies and human cells, HAP40 maintained conserved physical and functional interactions with HTT. Additionally, loss of HAP40 resulted in similar phenotypes as HTT knockout. More strikingly, HAP40 strongly affected HTT's stability, as depletion of HAP40 significantly reduced the levels of endogenous HTT protein while HAP40 overexpression markedly extended its half-life. Conversely, in the absence of HTT, the majority of HAP40 protein were degraded, likely through the proteasome. Further, the affinity between HTT and HAP40 was not significantly affected by polyglutamine expansion in HTT, and contrary to an early report, there were no abnormal accumulations of endogenous HAP40 protein in HD cells from mouse HD models or human patients. Lastly, when tested in Drosophila models of HD, HAP40 partially modulated the neurodegeneration induced by full-length mutant HTT while showed no apparent effect on the toxicity of mutant HTT exon 1 fragment. Together, our study uncovers a conserved mechanism governing the stability and in vivo functions of HTT and demonstrates that HAP40 is a central and positive regulator of endogenous HTT. Further, our results support that mutant HTT is toxic regardless of the presence of its partner HAP40, and implicate HAP40 as a potential modulator of HD pathogenesis through its multiplex effect on HTT's function, stability and the potency of mutant HTT's toxicity.


Conflict of interest statement

I have read the journal’s policy and the authors of this manuscript have the following competing interests: GM and DM are employed by CHDI Management, Inc. as advisors to CHDI Foundation, Inc., and declare no conflict of interest. CHDI Foundation is a nonprofit biomedical research organization exclusively dedicated to collaboratively developing therapeutics that substantially improve the lives of those affected by Huntington’s disease. CHDI Foundation conducts research in a number of different ways; for the purposes of this manuscript, all research was conceptualized, planned, and directed by all authors and conducted at the University of Texas Health Science Center at Houston (UTHealth) or the CHDI-supported contract research organization IRBM. This does not alter our adherence to PLOS Genetics policies on sharing data and materials.

Figures

Fig 1
Fig 1. dHtt expression and genomic tagging of dHtt.
(A) Western blot analysis of endogenous dHtt expression in Drosophila embryos, revealed with anti-dHtt antibody. A single ~400kDa dHtt band is present in wildtype embryos and absent in age-matched dhtt-ko mutants. The lower background band served as loading control, as noted. (B) Schematics for genome-tagging dhtt gene at its C-terminus with eGFP, which includes an ~80kb genome region covering dhtt gene, including about 25kb upstream of the first coding exon, 42.8 kb genome region covering all the coding exons and about 12kb 3’-untranslated region (UTR). eGFP was fused in-frame to the C-terminus of encoded dHtt protein before the stop codon and 3’ UTR. The genome fusion constructs were cloned into pacman vector through the recombineering method, and subsequently integrated into the preselected attP site in the fly genome through the phiC31-integrase mediated transgene approach (see Methods). (C) Western analysis for the expression of dHtt-GS-TAP fusion protein from pacman-dhtt-GS-TAP transgenic flies (dHtt-GS), or controls of wildtype (WT) and dhtt-ko mutants, as indicated. The GS-TAP tag contains two Protein G modules, a TEV protease cleavage site, and a streptavidin binding peptide (SBP). The whole-protein extracts from the indicated genotypes were probed simultaneously with anti-SBP (green band in left panel) to detect the GS-TAP tag and anti-dHtt (red bands in the middle panel) antibodies, followed by anti-βTubulin antibody for loading control. The dHtt-GS-TAP fusion protein was only detected in the dhtt-GS transgenic flies and absent in controls of WT (middle lane) and dhtt-ko (left lane) flies. The overlaying image (right panel) for both anti-SBP and anti-dHtt staining showed that the dHtt-GS-TAP was expressed as full-length fusion protein (orange band) with slightly larger size than endogenous dHtt.
Fig 2
Fig 2. Affinity-purification of endogenous dHtt and dHtt-associated proteins from Drosophila.
(A) Western blot analysis of sequential purification steps for dHtt-GS-TAP fusion and its associated proteins from flies. Whole embryos extracts from wildtype control (WT) or flies transgenic for pacman-dhtt-GS-TAP (dHtt-GS) were processed in parallel through the following purification steps: (1) IgG-pulldown against Protein G modules in the GS-TAP tag; (2) TEV protease cleavage of the TEV recognition site in the GS-TAP tag to release dHtt and associated proteins from IgG beads; (3) Second pull-down with Streptavidin beads against the SBP within the GS-TAP tag; (4) final elution of dHtt and dHtt-associated proteins from Streptavidin beads with biotin. When possible, equal volumes of protein extracts or agarose slurry from the following purification steps were analyzed, as annotated in the figure panel (from the left to right): Be, whole embryo extracts before incubation with IgG beads; Un, unbound protein samples after depletion of dHtt-GS with IgG-conjugated agarose beads from whole embryo extracts; Lf, leftovers on IgG beads after TEV cleavage; Be, elute from IgG beads after TEV cleavage, before incubating with Streptavidin-conjugated agarose beads; E1 and E2: final eluate 1 and 2 fractions released from Streptavidin beads with biotin solutions. Samples from each of the above purification steps were processed for SDS-PAGE analyses and probed with rabbit α-dHtt antibody. Note that the quantity of endogenous dHtt protein in the crude protein extracts from the pacman-dhtt-GS-TAP transgenic flies was barely detectable (lane 1, labeled as “Be” in left panel), and became significantly enriched in the final eluates (arrows in E1, E2). The same band was absent from WT control (right panel). M: protein ladder marker, with their sizes labeled. (B and C) SDS-PAGE analysis of affinity-purified dHtt and dHtt-associated proteins isolated from transgenic flies carrying (B) pacman-dhtt-GS-TAP (dHtt-GS), or (C) pacman-dhtt-eGFP, visualized with Coomassie blue staining. The following controls were processed in parallel: wildtype (WT) non-transgenic flies; controls for pacman flies carrying in-frame fusion with an unrelated protein of (B) GS-TAP (Control-GS) or (C) eGFP (Control-GFP) tags, as indicated. Note the co-purification of a prominent ~40kDa protein (arrows) with the ~400 kDa dHtt (arrowheads) specifically from (B) dHtt-GS or (C) dHtt-GFP flies only, but not from either of the controls. In (B), several large bands were present around the ~400 kDa range (arrowhead) specifically in dHtt-GS sample, which likely were partially degraded dHtt protein generated during multi-step TAP purification procedures. In (C), after final eluting from GFP-nanobody agarose beads with 10mM glycine (PH 2.5), both the eluates (Elute) and the post-elution agarose beads (beads) were processed for SDS-PAGE analysis.
Fig 3
Fig 3. CG8134 encodes Drosophila Hap40 homologue.
(A) Sequence alignment between CG8134/dHap40 and the following vertebrate HAP40 homologs: human (hHAP40/F8a1), mouse (mHAP40/F8a), xenopus (xHAP40) and zebra fish Danio rerio (DrHAP40). Genebank ID of these proteins were indicated. The scale bar above the alignment refers to amino acid position from human HAP40 (NP_036283). Amino acid similarities are annotated in color in the following order in the alignment: (1) black box highlights amino acids that are identical to that in CG8134/dHap40; (2) green boxes are those identical to those in human HAP40; (3) Yellow boxes are those with similar chemical property as those in human HAP40; (4) blue box highlights amino acids that are with similar chemical property as in CG8134/dHap40. The red bars above the alignment cover the sequences of the predicted 14 α-helices and the green bars those invisible in the Cryo-EM model. (B) Schematics of the predicted secondary structures in human HAP40 (top) and CG8134/dHap40 (bottom) proteins using the Garnier-Robson structure prediction module (Protean program by DNASTAR), drawn in scale (top) of human HAP40. Red boxes represent the predicted α-helices. BΦ: the N-terminal α-helices enriched with basic and hydrophobic amino acids, which is part of the N-terminal invisible region in the Cryo-EM model (see Fig 3C below); CC: the α-helices containing two conserved cysteines; EARFL: α-helices with a conserved stretch of E,A,R,F and L amino acids; LR: α-helices with leucine-repeat; P: proline linker after the LR α-helices. (C) Schematics of the secondary structures in human HAP40 protein predicted from the Cryo-EM study. Red rectangles correspond to the predicted 14 α-helices and the green rectangles are regions invisible in the Cryo-EM model. (D) Schematics of genomic structure of cg8134/dhap40 gene and the mutant alleles created in the study. dhap40 is a X-linked gene composed of one intron (solid line) and two coding exons (grey boxes: untranslated regions; black boxes: coding regions), with arrowhead indicting the orientation of the encoded protein from 5’ to 3’ ends. Star annotates the locations of the molecular lesions for each of the characterized dhap40 alleles. Blank area indicates the region of small insertions and deletions and shaded area the induced frameshift in the encoded protein. (E) SDS-PAGE and Coomassie blue staining of protein lysates from E. coli. A protein product of 40kDa size was produced only in cells transformed with a pET protein expression plasmid containing full-length cg8134 cDNA without (lane 2) or with IPTG induction (lane 3) but not in control transformed with an empty protein expression vector alone (lanes 1). (F) Western Blot analysis of CG8134/dHap40 expression in adult flies from wildtype (WT), four dhap40 mutant (ko3, ko7, ko8 and ko9) alleles, and a dHap40 overexpression line (OE) carrying a UAS-cg8134 transgene directed by a strong Actin-Gal4 driver. Note that a 40kDa band (left red arrow) corresponding to endogenous CG81344/dHap40 was detected in WT and present at significantly higher levels in the OE line (right red arrow), but was completely absent in the four dhap40 mutant lines. (G) Western Blot analysis of ectopically expressed human HAP40, detected as a 40kDa protein, from homogenates of two fly lines carrying a UAS-F8A1/HAP40 transgene direct by daughterless-Gal4 driver. (H) co-IP of endogenous dHtt by dHap40 antibodies. Fly homogenates from dHtt-eGFP flies were incubated with two independent anti-dHap40 (anti-CG8134 # 1 and #2) antibodies, or with their corresponding pre-immunization sera (#1 Pre and #2 Pre) as controls. The immunoprecipitates were probed with anti-GFP or anti-dHap40 antibodies after SGS-PAGE separation, as indicated.
Fig 4
Fig 4. dhap40 mutants show similar loss-of-functions phenotypes as dhtt null flies.
(A) Survival curves (top) and bar-chart panels on average life span (bottom) as well as (B) climbing assays (top) and bar-chart panels on climbing ability (bottom) for two dhap40 null alleles ko3 and ko7 (green and purple lines, respectively), together with wildtype control (blue line) and null dhtt-ko mutants (red line), as indicated. Note that both dhap40 mutant alleles manifested similar, albeit significant weaker, phenotypes than dhtt-ko flies. (A) dhap40-ko had an average life span of 40 days (n = 230 total), differing significantly (p<0.001, log-rank test) from both wildtype (59 days, n = 253) and null dhtt-ko mutants (33 days, n = 209). (B) Climbing assays for 28-day-old adult flies of the indicated genotypes, with dhap40 flies (n = 180) showing significant differences (** p<0.01 and *** p<0.001, t-test) from both wildtype (n = 200) and dhtt-ko mutants (n = 180). (C and D) Survival curves (top) and bar-chart panels on average life span (bottom) for rescue experiments on the longevity deficit of dhap40ko3 flies, restored by ectopically expressed (C) fly dHap40 from the UAS-dhap40 or (D) human HAP40 from UAS-HAP40 transgenes, all directed by a ubiquitous da-Gal4 driver (red lines. Genotype: “w1118, dhap40ko3; UAS-dhap40/da-Gal4” (C, n = 300) or “w1118, dhap40ko3; UAS-HAP40/da-Gal4” (D, n = 307)). The survival curves of the rescued flies in (C) and (D) were statistically indistinguishable from wildtype (blue lines, p>0.5, log-rank test n = 253. Genotype: “w1118”), but significantly different from the two controls: (1) dhap40ko3 flies carrying da-Gal4 driver alone (purple lines. *** p<0.001, log-rank test. Genotypes: “w1118, dhap40ko3; da-Gal4/+”. n = 308); and (2) dhap40ko3 flies carrying (C) UAS-dhap40 (Genotype: “w1118, dhap40ko3; UAS-dhap40/+”. n = 355) or (D) UAS-HAP40 (Genotype: “w1118, dhap40ko3; UAS-HAP40/+”. n = 337) transgene alone (green lines, *** p<0.001, log-rank test), as indicated. The same set of data from wildtype (blue lines) and “dhap40ko3; da-Gal4/+” (purple lines) were used in both (C) and (D) as shared controls. (E and F) co-IP experiments between (E) transfected HTT and dHap40 in HEK293 cells or between (F) endogenous HTT and HAP40, as indicated. Note that the pulldown efficiency by HTT was significantly higher against (F) endogenous HAP40 than (E) dHap40.
Fig 5
Fig 5. Conserved mutual dependence between HAP40 and HTT proteins on each other’s stability.
Western blot assays of HTT and HAP40 proteins in flies and human cells. (A) The 40kDa endogenous dHap40 (arrow) protein in wildtype control (WT) was absent in two independent dhtt null alleles, similar as a dhap40 null allele. Genotypes as indicated. A background band of 50kDa size present in all samples served as loading control. (B) Rescue experiment for dhtt-ko flies. Re-introduction of one copy of pacman-dhtt-GS (lane 4) or pacman-dhtt-eGFP (lane 5) transgenes into dhtt-ko flies rescued the expression of endogenous dHtt and dHap40 proteins. Genotypes as indicated. Actin served as loading control.(C) Endogenous HAP40 was significantly depleted in two independent HTT-knockout (HTT-KO) HEK293 cell lines, as compared to wildtype HEK293 control (WT). α-Tubulin serves as loading and normalization controls. (D) HAP40 was severely depleted in HTT-KO cells (lane 2) and was restored by overexpressed FLAG-HTT to a level even higher (lane 3) than in WT control (lane 1). α-Tubulin serves as loading and normalization controls. (E) Rescue experiment for dhap40-ko flies. Expression of dHtt and dHap40 proteins in WT, dhap40 ko3 and dhtt ko null adult flies, or dhap40 ko3 flies with UAS-dHap40 rescue transgene (lanes 4 and 5), as indicated. Bar chart quantification below shows an average of 70% reduction of endogenous dHtt protein in null dhap40 ko3 flies as compared to WT control (N = 4 four repeat experiments, p = 0.02, student’s t-test). dHtt expression was restored in dhap40 ko3 flies when dHap40 was overexpressed from UAS-dHap40 transgene driven by da-Gal4 driver (lane 4), but not in the control flies that lacked da-Gal4 driver (lane 5). A ~50kDa background band from anti-dHap40 antibody served as loading controls. (F) Reduced levels of endogenous HTT protein, shown in three independent Western blot assays, in two independent HAP40-KO cell lines and their quantification in the bar chart below, showing an average of ~60% reduction of normalized HTT levels as compared to WT control. α-Tubulin serves as loading and normalization controls (** p<0.01 and *** p<0.001, t-test). (G-L). Representative data on the turnover dynamics of (G-I) HAP40 or (J-L) HTT proteins after transient knockdown of endogenous (G-I) HTT or (J-L) HAP40, respectively, by siRNA in a normal human fibroblast cell line GM07492. All three independent repeats showed similar results. The knockdown efficiency and specificity of the siRNAs targeting HTT or HAP40 were evaluated (G and J) at mRNA levels by quantitative PCR (qPCR) and (I and L) at protein levels by Western blot assays. (I and L) Quantification of the relative levels of HTT and HAP40 proteins, all normalized again loading control Calcineurin (CalNX), from Western Blot assays (G and I) at indicated time points after siRNA treatment. The data were plotted with Time 0 as reference point (N = 3 independent repeats). GM07492 fibroblast cell line contains two normal HTT alleles, one with 19 and the other 21 CAG repeats.
Fig 6
Fig 6. Proteasome mediates HAP40 degradation.
Western blot assays and quantifications for endogenous HAP40 and HTT proteins in HTT-KO, HAP40-KO or wildtype (WT) HEK293 cells under different treatments, as indicated. (B and D) Normalized levels of (B) HAP40 or (D) HTT proteins from three repeat experiments, corresponding to (A) and (C), respectively. Treatment with proteasome inhibitor MG132 for 5 hours partially but significantly restored the levels of depleted HAP40 protein in HTT-KO cells (A and B, N = 5 repeats for all the experiments, p = 0.002 for HTT-KO #1 line, p = 0.018 for HTT-KO #2 line), but showed no clear effect on the levels of endogenous HTT protein in HAP40-KO cells (C and D, N = 4 repeats for all the experiments). Autophagy/lysosome inhibitor ammonium (NH4+) and CQ, also treated for 5 hours. CQ showed partially but significant rescue of HTT levels in HAP40-KO cells (N = 4 repeats for all the experiments. p = 0.016 for HAP40-KO #1 line, p = 0.002 for HAP40-KO #2 line). NH4+ behaved similarly as DMSO mock treatment in both HTT-KO and HAP40-KO cells. * p< 0.05, ** p< 0.01 (student’s t-test). n.s., no significance. α-Tubulin served as loading and normalization controls in all the experiments.
Fig 7
Fig 7. HAP40 overexpression extends the half-life of endogenous HTT proteins.
Pulse-chase experiments to measure the turnover rates of endogenous HTT proteins in HEK293 cells. (A) Schematics of pulse-chase experiments. HEK293 cells were cultured in regular medium for 24 hours after transfection with control empty vector (EV) or construct expressing FLAG-tagged HAP40, followed by standard pulse-chase experiment. After starvation in methionine-free medium for 30 minutes, cells were supplemented with medium containing 35S-methionine for another 15 minutes to label the newly synthesized proteins. After the pulse labeling, the cells were washed and then maintained in regular medium for indicated intervals before harvesting for further analysis. (B) Western blot assay to measure the total levels of endogenous HTT and transfected FALG-tagged HAP40 proteins at each indicated time points in control and HAP40-overpresssing cells. GAPDH as loading control. (C) Endogenous HTT protein were enriched by immunoprecipitation with D7F7 anti-HTT antibody and resolved by SDS-PAGE separation, followed by autoradiography (ARG) and Western blot assays to measure the amount of 35S-labeled and total HTT protein at each time point, as indicated. (D) Turnover rate of endogenous HTT protein in control and HAP40-overexpressing cells, which was quantified as the relative levels of remaining 35S-labeled HTT at each time point after the start of the chase, all normalized against total HTT from each pulldown. Half-life for endogenous HTT at ~73 ± 4hrs hours in EV control and ~103 ± 18 hours in the presence of overexpressed HAP40 (N = 3; p<0.05 (student’s t-test)).
Fig 8
Fig 8. PolyQ expansion in HTT does not significantly affect its affinity for HAP40.
(A and C) Western blot assay and (B and D) quantification of co-IP experiments between HAP40 and FLAG-tagged full-length HTT carrying 23, 73 or 145 (23Q, 73Q and 145Q) glutamine tracts expressed either from transient transfection (A and B) or stable cell lines expressing HTT-Q23 or HTT-Q145 (C and D), as indicated. (B and D) The pull-down efficiency of HAP40 by different HTT proteins were quantified as the relative ratio of co-immunoprecipitated HAP40 and HTT proteins, averaged from three independent experiments. All three HTT proteins showed comparable pulldown efficiency for endogenous HAP40. n.s., no significance. α-Tubulin serves as loading control. (E and F) Time course analyses of endogenous HAP40 and ectopically expressed HTT-23Q, 72Q or 145Q in HTT-KO HEK293 cells, hours after transfection with FLAG-tagged HTT expressing plasmids, as indicated. (F) Quantification of the time-dependent changes of HAP40 levels normalized against HTT at each time point, averaged from three repeat experiments. (G-L). Representative data on the turnover dynamics of endogenous (G-I) HAP40 or (J-L) mutant HTT proteins after transient knockdown of (G-I) HTT or (J-L) HAP40, respectively, by siRNA in a human HD fibroblast cell line GM04857. All three independent repeats showed similar results. The knockdown efficiency and specificity of the siRNAs targeting HTT or HAP40 were evaluated (G and J) at mRNA levels by quantitative PCR (qPCR) and (H and K) at protein levels by Western blot assays. (I and L) Quantification of the relative levels of HTT and HAP40 proteins, all normalized again loading control Calcineurin (CalNX), from Western Blot assays (representative images in H and K), respectively, at indicated time points after siRNA treatment, plotted with Time 0 as reference point (N = 3 independent repeats). GM04857 is a fibroblast cell line derived from a homozygote HD patient with pathogenic CAG expansion in both HTT alleles, one with 40 CAG repeats and the other 50 CAG repeats.
Fig 9
Fig 9. The levels of HAP40 protein are lower in HD cells.
Western blot assays and quantification of endogenous HTT and HAP40 proteins in normal and HD (A and B) mouse striatal precursor cells and (C-E) human fibroblast cells, as indicated. The human fibroblast cell lines are: GM04729 (WT-1), GM05539 (HD-1), GM21757 (HD-2. CAG repeats reported as 66 and 16), GM02189 (WT-2), GM09197 (HD-3. 180 CAG repeat in affected HD allele), GM04723 (HD-4), GM04787 (WT-3) and GM21756 (HD-5. CAG repeats reported as 70 and 15). (A) Note that for each mutant HD cell lines in these SDS-PAGE gels, mutant HTT proteins (HTT-Q111, indicated by red *) were reduced and migrated slower than wildtype HTT (wtHTT or HTT-Q7, indicated by blue *) in a polyQ length-dependent manner. (C) The membrane was co-probed with both anti-total HTT (D7F7,) and mutant HTT specific (MW1, red) antibodies. In both (B) and (D), N = 6 for quantification of HAP40 protein levels and N = 4 for quantification of HTT. (E) Average relative ratio of the normalized HTT and HAP40 protein levels in wildtype (WT) and HD cells, quantified from the eight wildtype and 13 mutant HD fibroblast cells lines tested in repeats experiments (see S8 Fig for additional data). *p< = 0.05, **p< = 0.01, ***p< = 0.001 (student’s t-test). n.s., no significance. β-Actin served as loading and normalization controls in all the experiments.
Fig 10
Fig 10. Mild effect of HAP40 on neurodegeneration of Drosophila HD models.
(A-F) Representative (A-C) confocal images of whole-mount retina with phalloidin staining, dissected from 1-day-old adult female flies, or (D-F) bright-field image of 30-day-old adult fly eyes with eye-specific expression of (A and D) control wildtype fl-HTT-23Q, or (B, C, E and F) human mutant fl-HTT-145Q in (B and E) normal or (C and F) dhap40ko3 background, all directed by eye-specific GMR-Gal4 driver. Compared with (A) the control of the eye expressing wildtype HTT-23Q, which showed regular composition and patterning of the seven photoreceptors within each ommatidium unit, (B) mutant HTT-145Q already caused severe degeneration phenotypes, showing prominent loss of photoreceptor cells and disintegration of ommatidia structure, while (C) in the absence of endogenous dhap40, the eye degeneration phenotypes were significantly suppressed. Similarly, the loss of eye pigmentation induced by fl-HTT-145Q (E A), indicating underlying eye degeneration, was suppressed by the absence of dhap40 (F). Genotypes: (A and D) GMR-Gal4/+ >UAS-hHTT-23Q/+. (B and E) GMR-Gal4/+ >UAS-hHTT-145Q/+. (C and F) dhap40ko3/dhap40ko3; GMR-Gal4/+ >UAS-hHTT = 145Q/+. Flies with the same genotype showed relatively similar phenotypes at the same age (examples in S9B–S9D Fig). More than 4 fly eyes were examined and imaged in (A-C) and 30 flies were examined in (D-F) for each of the genotypes. (G-J) Quantification of photoreceptor cell degeneration and viability phenotypes of flies with neuronal-specific expression of fl-HTT-128Q either (G and H) in dhap40 null background or (I and J) with co-expression of human HAP40, all directed by pan-neuronal nsyb-Gal4 and with respective controls, as indicated. (G and I) Bar chart presentation of the average number of intact photoreceptor cells (PRC) per ommatidium in 7-day-old flies of the following designated genotypes. (G)“nsyb-Gal4/UAS-fl-HTT-128Q”: 4.4 PRC/ommatidium (n = 360 ommatidia from 20 flies); “dhap40 ko3; nsyb-Gal4/UAS-fl-HTT-128Q”: 5.3 PRC/ommatidium (n = 360 ommatidia from 20 flies); The difference between the two was significance (p<0.001, Mann-Whitney rank-sum test). Control flies expressing Fl-HTT-16Q in both normal and dhap40-ko backgrounds showed normal seven photoreceptor cells (blue bars). (I) “UAS-HAP40; nsyb-Gal4 >UAS-fl-HTT-128Q” flies: 5.1 PRC/ommatidium (n = 331 ommatidia from 20 flies); control “UAS-Luciferase-dsRNA; nsyb-Gal4 >UAS-fl-HTT-128Q” flies: 4.5 PRC/ommatidium (n = 320 ommatidia from 20 flies). The difference between the two is significance (p<0.001 by Mann-Whitney rank-sum test). Control flies co-expressing HTT-16Q with HAP40 or with luciferase (green bars) all had seven intact photoreceptor cells. (H and J) Bar chart presentation of the average life spans of the adult flies expressing fl-HTT-128Q. (H) Average life span was 17 days for “dhap40 ko3; nsyb-Gal4/UAS-fl-HTT-128Q” flies (n = 179) and 15 days for control “nsyb-Gal4/UAS-fl-HTT-128Q” flies (n = 229). The difference between the two is significance (p<0.001. Log-rank test). (J) Average life span was 24.3 days for flies co-expressing HTT-Q128 with HAP40 (genotype: “nsyb-Gal4>UAS-HAP40/+; UAS-HTT-128Q/+”. n = 141), and 24.5 days for control flies co-expressing HTT-Q128 with luciferase-dsRNA (“nsyb-Gal4> UAS-luciferase-RNAi/+; UAS-HTT-128Q/+”, n = 174), with no significant difference between the two genotypes (p = 0.9 by Log-rank test). (K-M) Western blot assays for the ectopically expressed human HTT protein in (K and L) flies and (M) human cells, and quantifications from three independent repeat experiments show in bar charts below. (K) The levels of human HTT expressed from the same UAS-HTT transgene was ~60% lower (** p< = 0.01 (student’s t-test), N = 5 repeats) in dhap40-ko (lane 3) than in normal (WT, lane 1) background, and was absent in control flies lacking nSyb-Gal4 driver (lane 2). (L) The levels of HTT were about four times higher and HAP40 about three times higher in flies co-expressing HTT and HAP40 (lane 2) than flies expressing HTT (lane 3) or HAP40 (lane 1) alone, all driven by nSyb-Gal4. (M) Western blot assays for HTT and HAP40 levels in HEK293T cells with simultaneous co-expression of FLAG-tagged HTT-23Q and HTT-145Q, ran as three repeat experiments (N = 3) probed with anti-FLAG and anti-HAP40 antibodies, as indicated. Co-transfection with HAP40 led to an average of about two-fold increase of HAP40 and three- to five-fold increase of HTT-23Q and HTT-145Q (compare lane 4–6 with lanes 1–3). *** p< 0.001 (student’s t-test), which were calculated as the fold changes in HAP40 and HTT levels after co-transfection with HAP40 as compared to before HAP40 transfection.

References

    1. The Huntington’s Disease Collaborative Research Group (1993). A novel gene containing a trinucleotide repeat that is expanded and unstable on Huntington’s disease chromosomes. Cell. 72(6):971–83. doi: 10.1016/0092-8674(93)90585-e - DOI - PubMed
    1. Bates GP, Dorsey R, Gusella JF, Hayden MR, Kay C, Leavitt BR, et al.. Huntington disease. Nat Rev Dis Primers. 2015;1:15005. doi: 10.1038/nrdp.2015.5 . - DOI - PubMed
    1. Ross CA, Aylward EH, Wild EJ, Langbehn DR, Long JD, Warner JH, et al.. Huntington disease: natural history, biomarkers and prospects for therapeutics. Nat Rev Neurol. 2014;10(4):204–16. doi: 10.1038/nrneurol.2014.24 . - DOI - PubMed
    1. Gutekunst CA, Levey AI, Heilman CJ, Whaley WL, Yi H, Nash NR, et al.. Identification and localization of huntingtin in brain and human lymphoblastoid cell lines with anti-fusion protein antibodies. Proc Natl Acad Sci U S A. 1995;92(19):8710–4. doi: 10.1073/pnas.92.19.8710 - DOI - PMC - PubMed
    1. Li SH, Schilling G, Young WS 3rd, Li XJ, Margolis RL, Stine OC, et al.. Huntington’s disease gene (IT15) is widely expressed in human and rat tissues. Neuron. 1993;11(5):985–93. doi: 10.1016/0896-6273(93)90127-d - DOI - PubMed

Publication types

MeSH terms

Substances