. 2022 Sep:106:102631.
doi: 10.1016/j.ceca.2022.102631. Epub 2022 Jul 11.

LIPID transfer proteins regulate store-operated calcium entry via control of plasma membrane phosphoinositides

Affiliations

LIPID transfer proteins regulate store-operated calcium entry via control of plasma membrane phosphoinositides

Gergo Gulyas et al. Cell Calcium. 2022 Sep.

Abstract

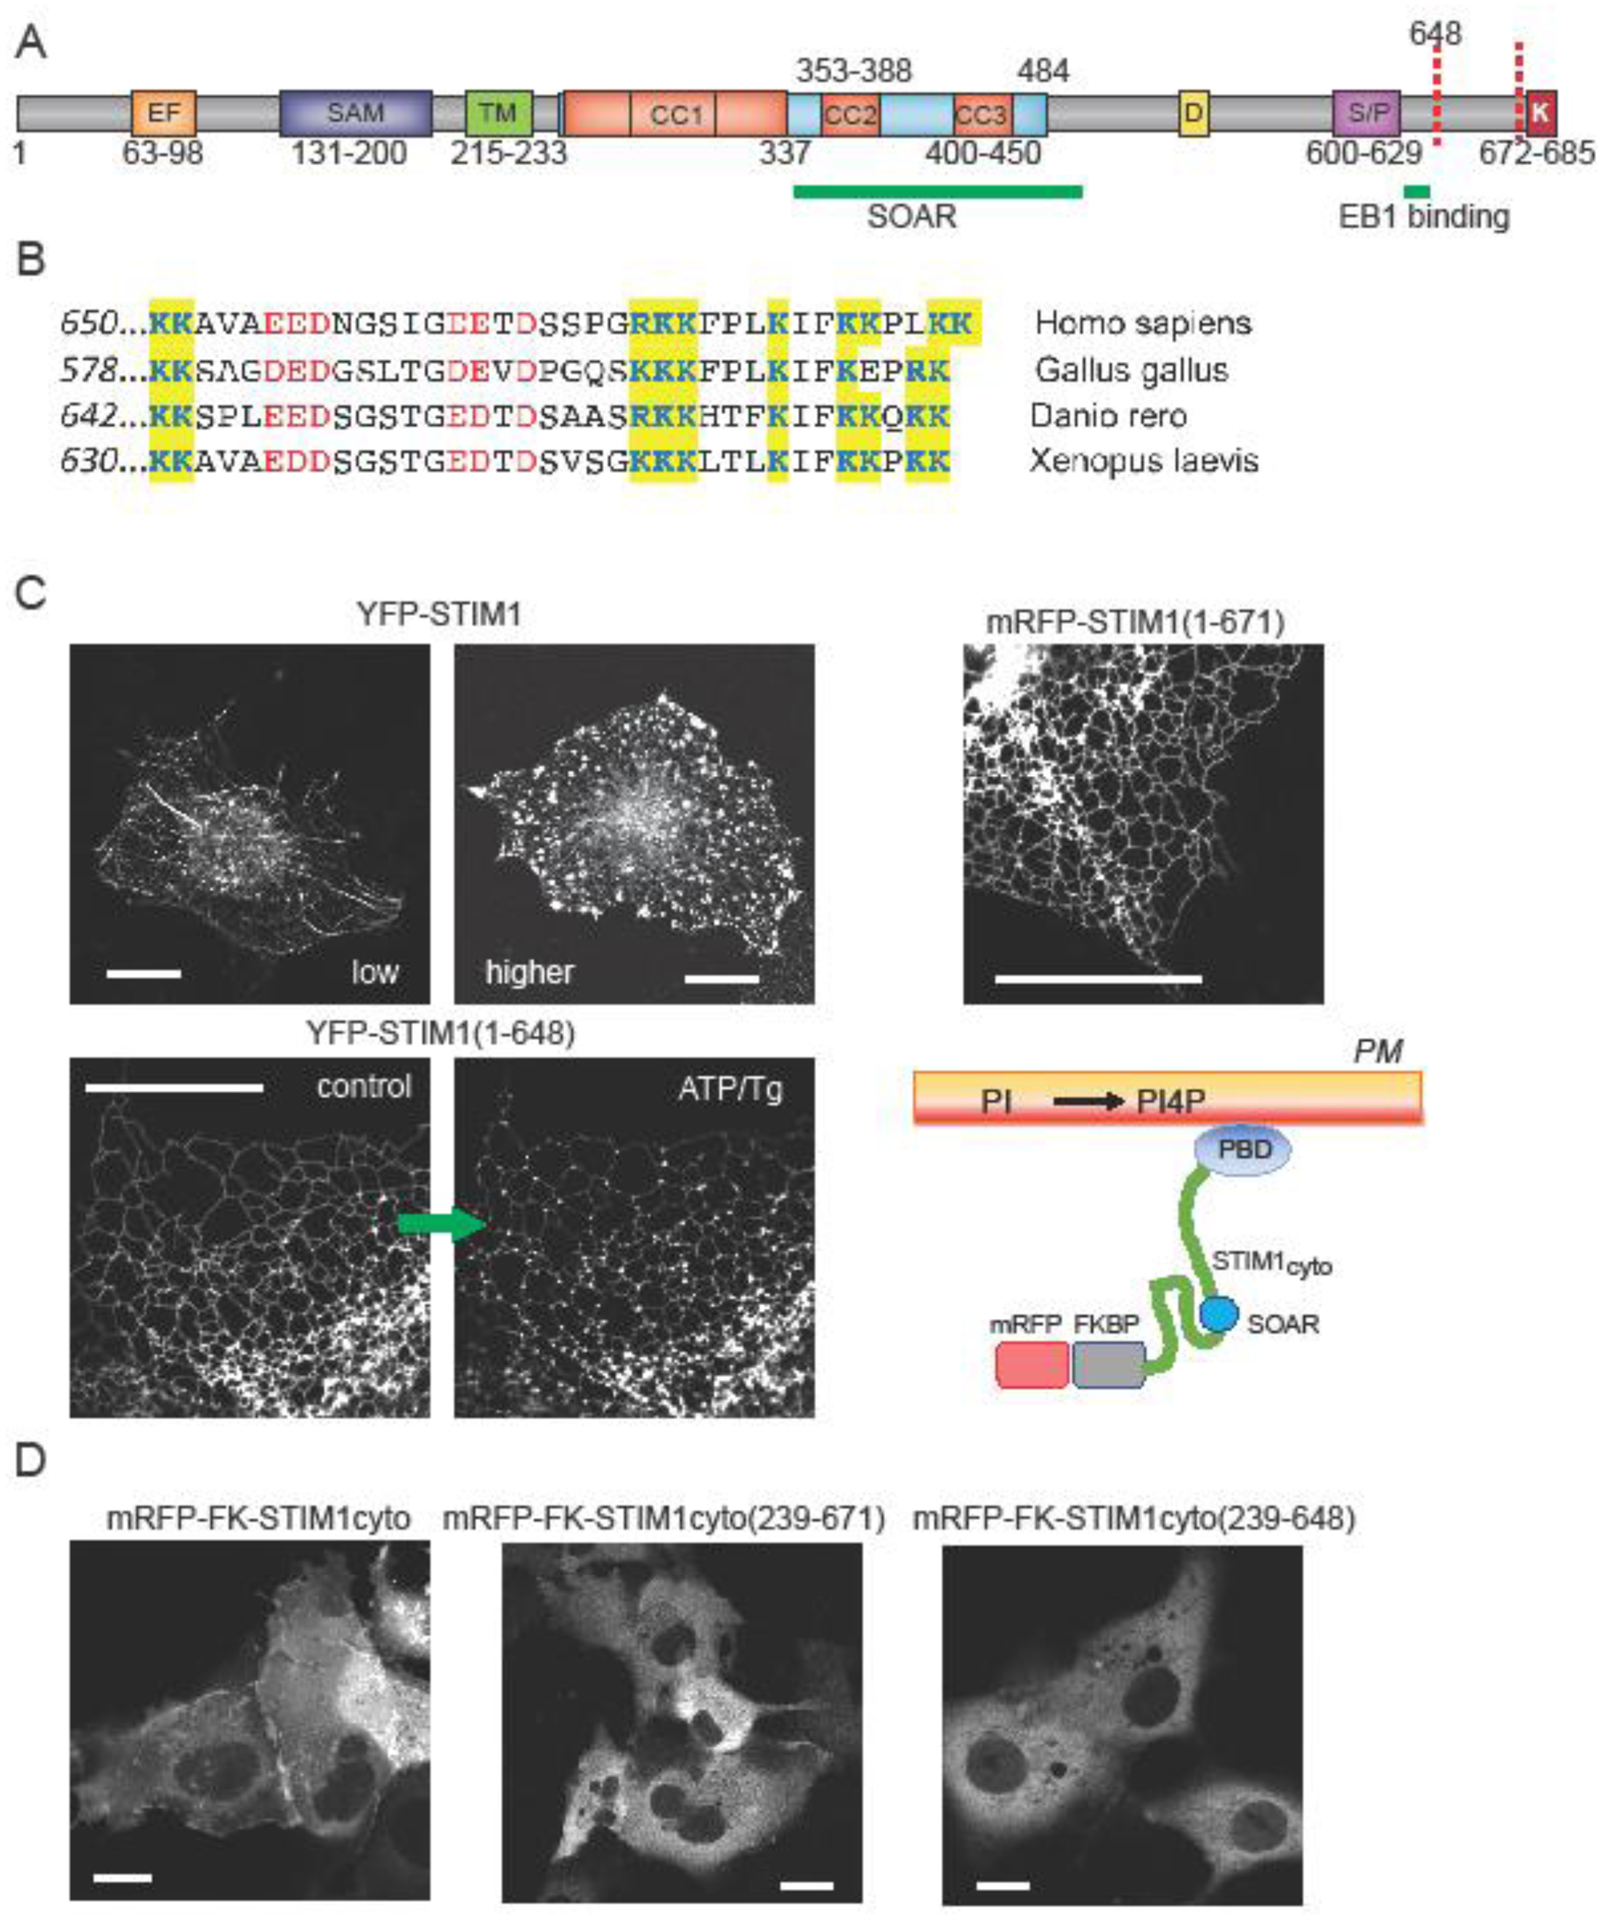
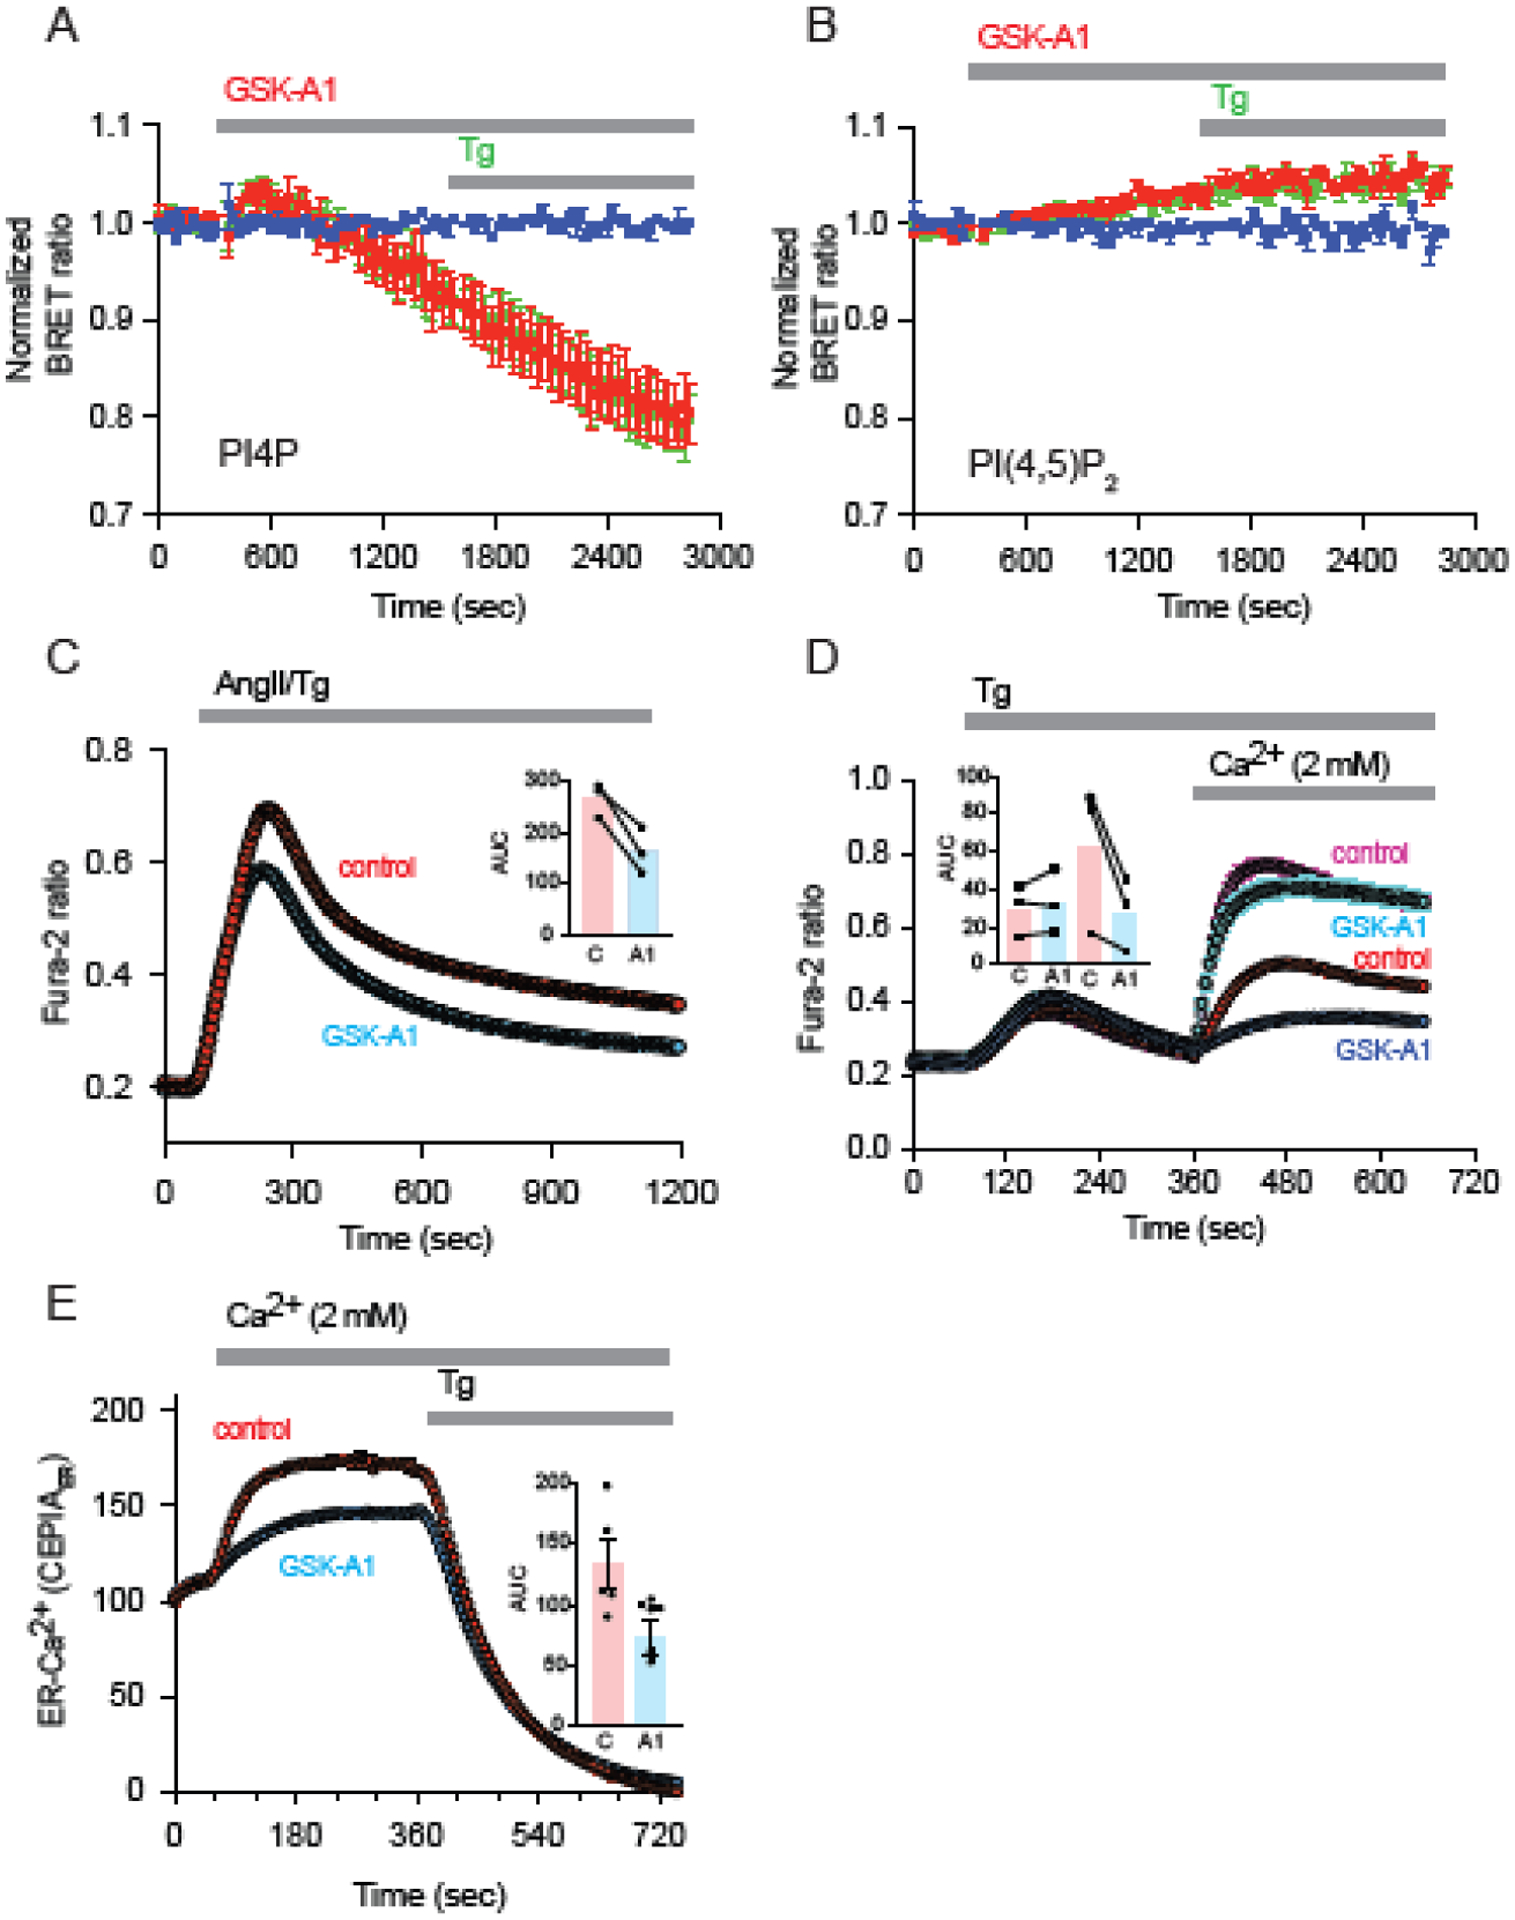
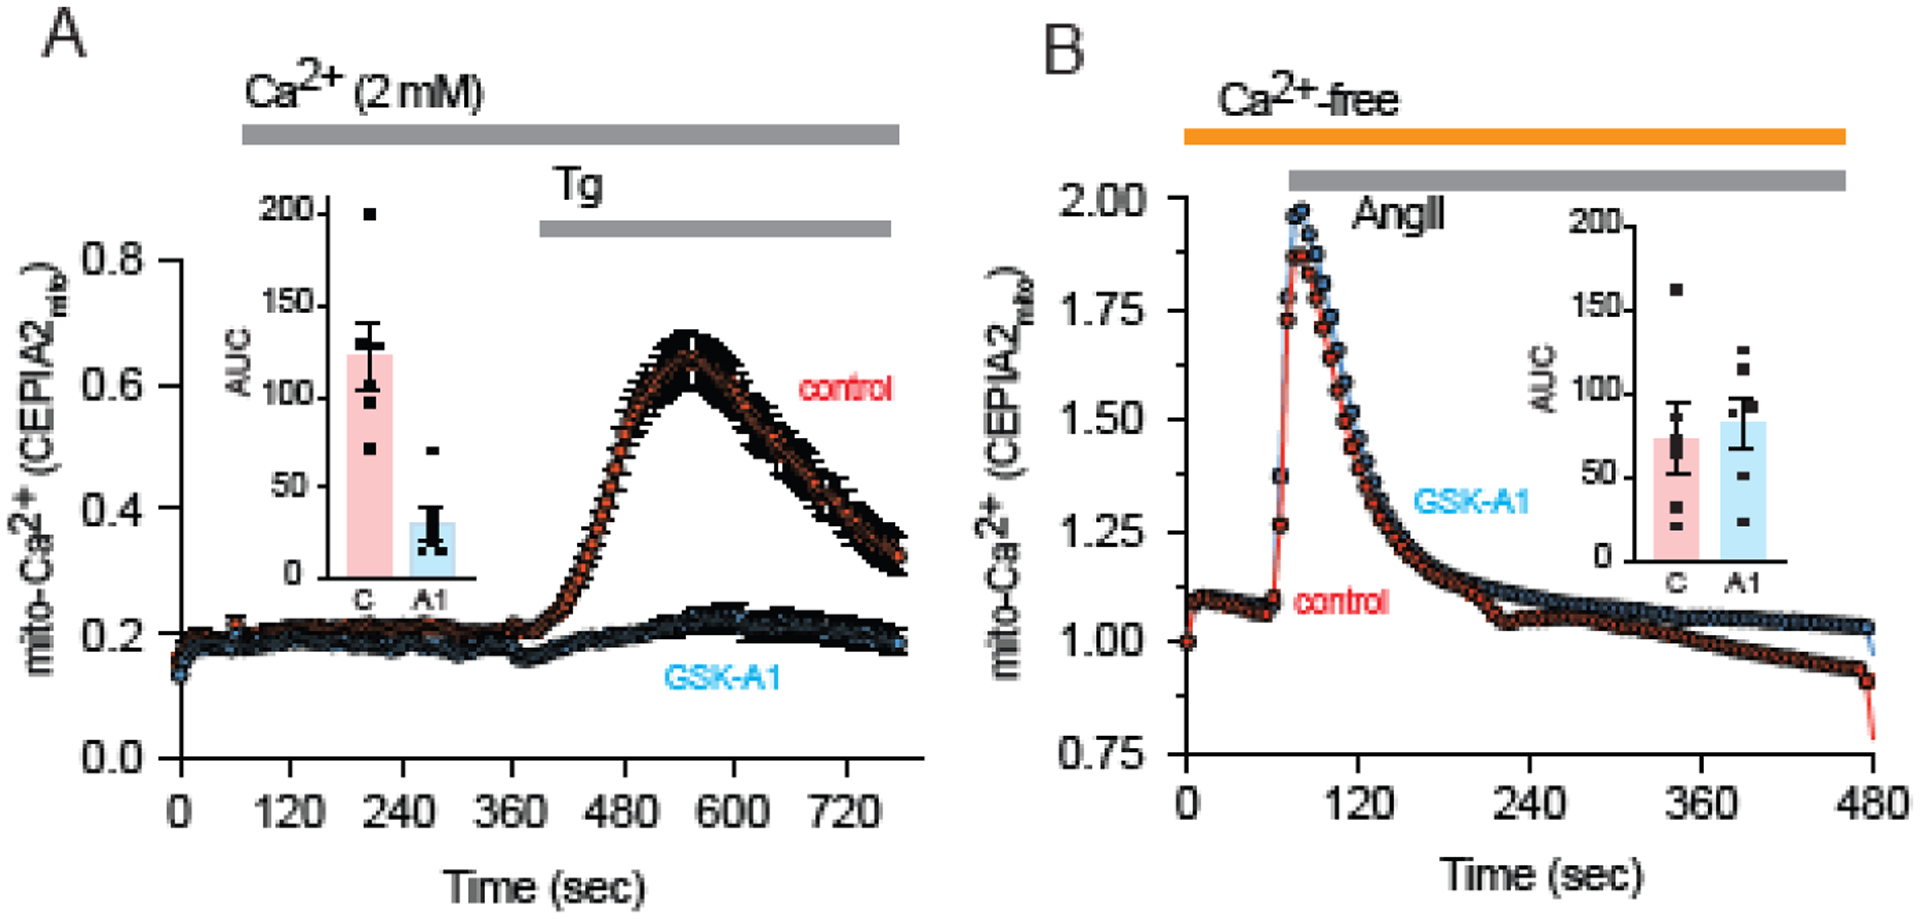
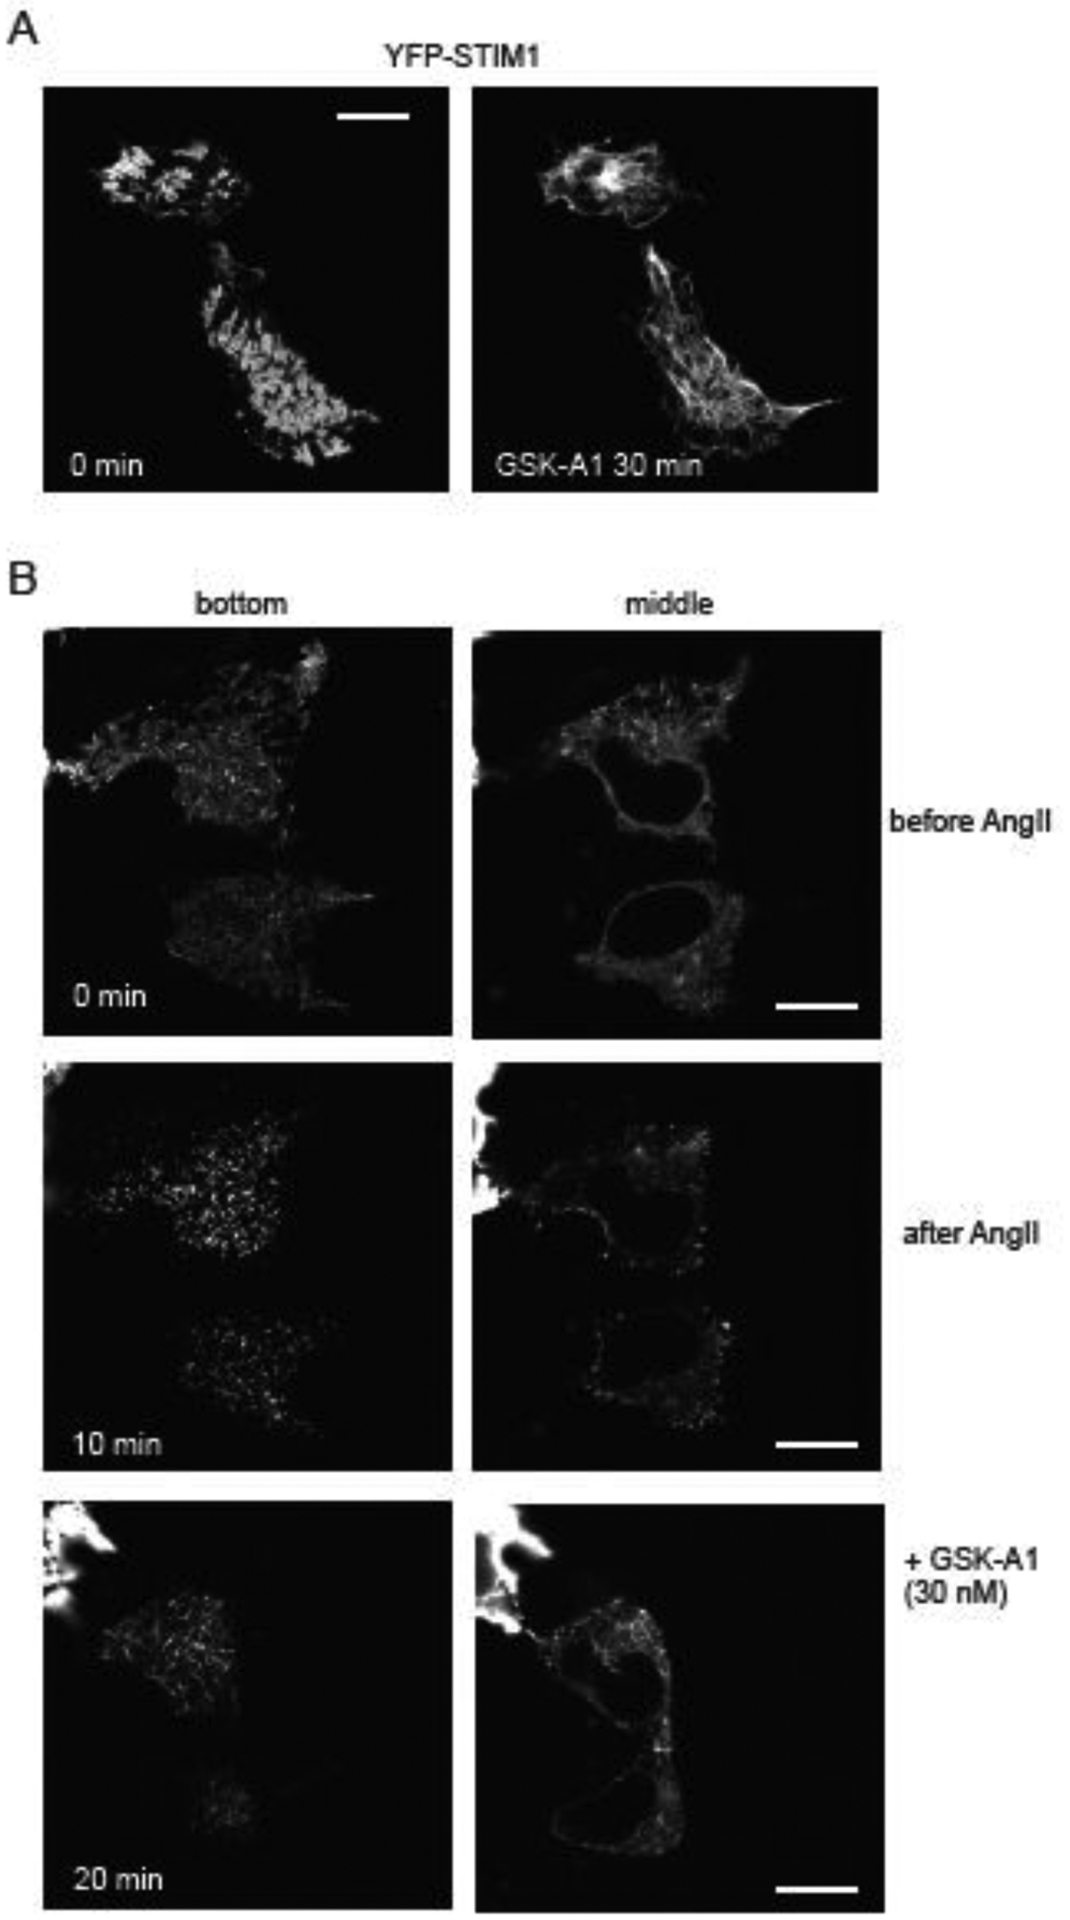
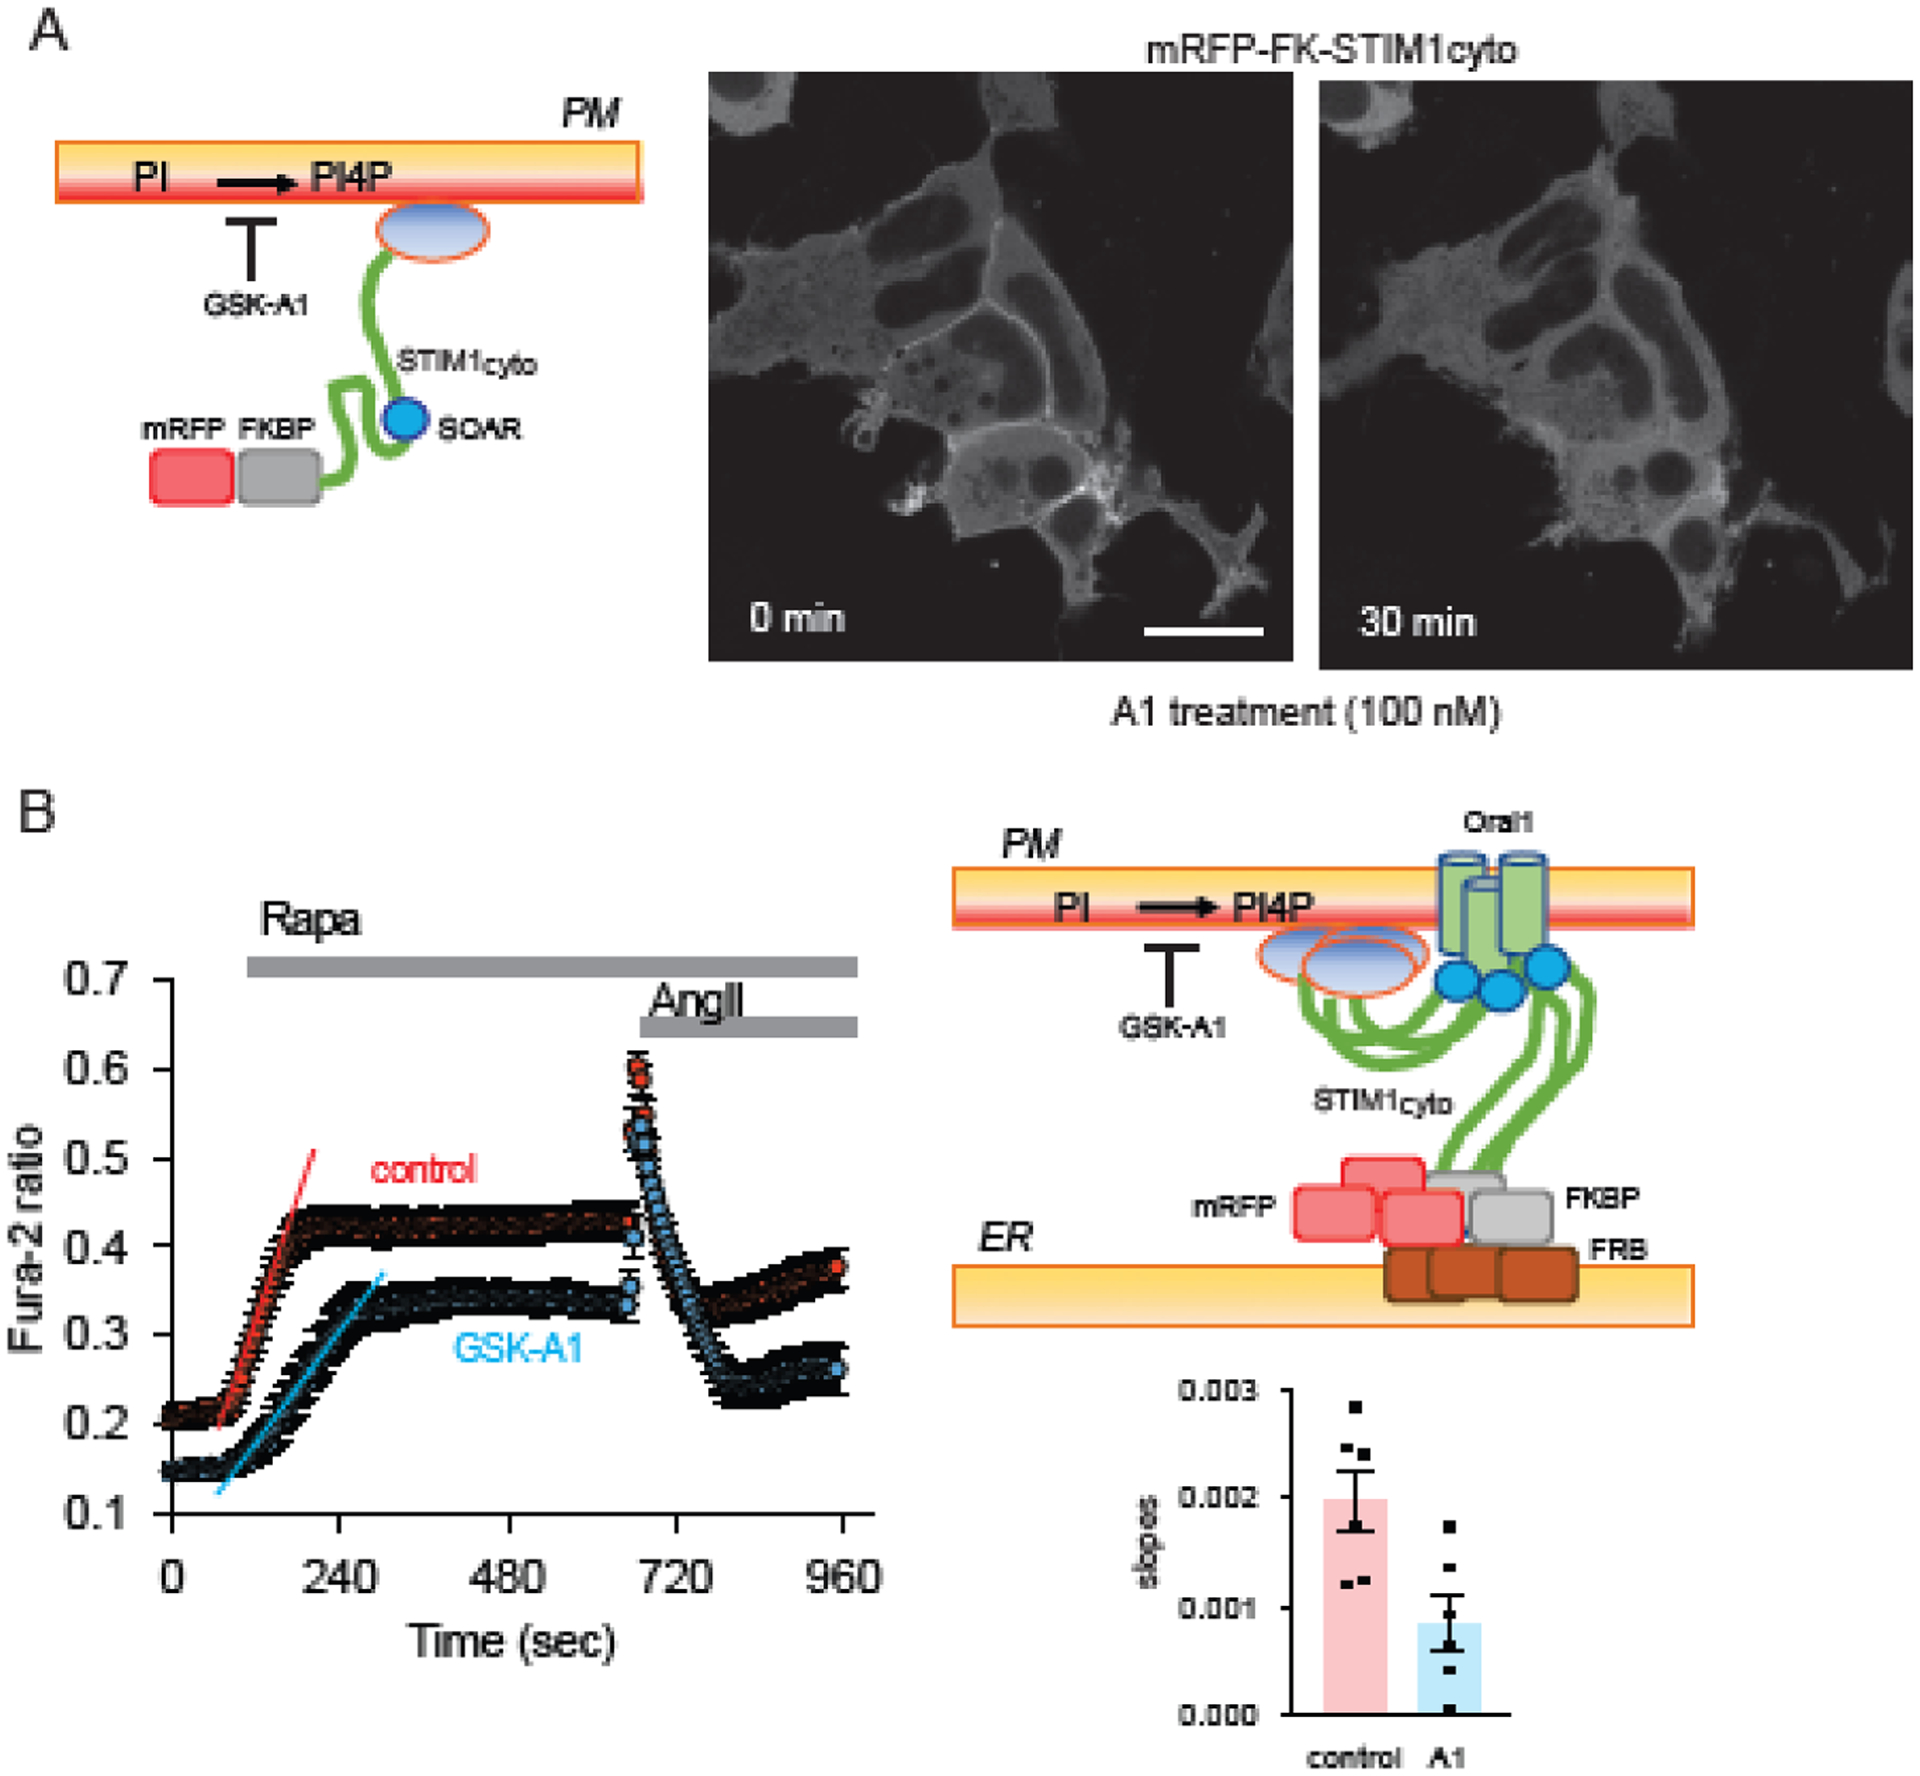
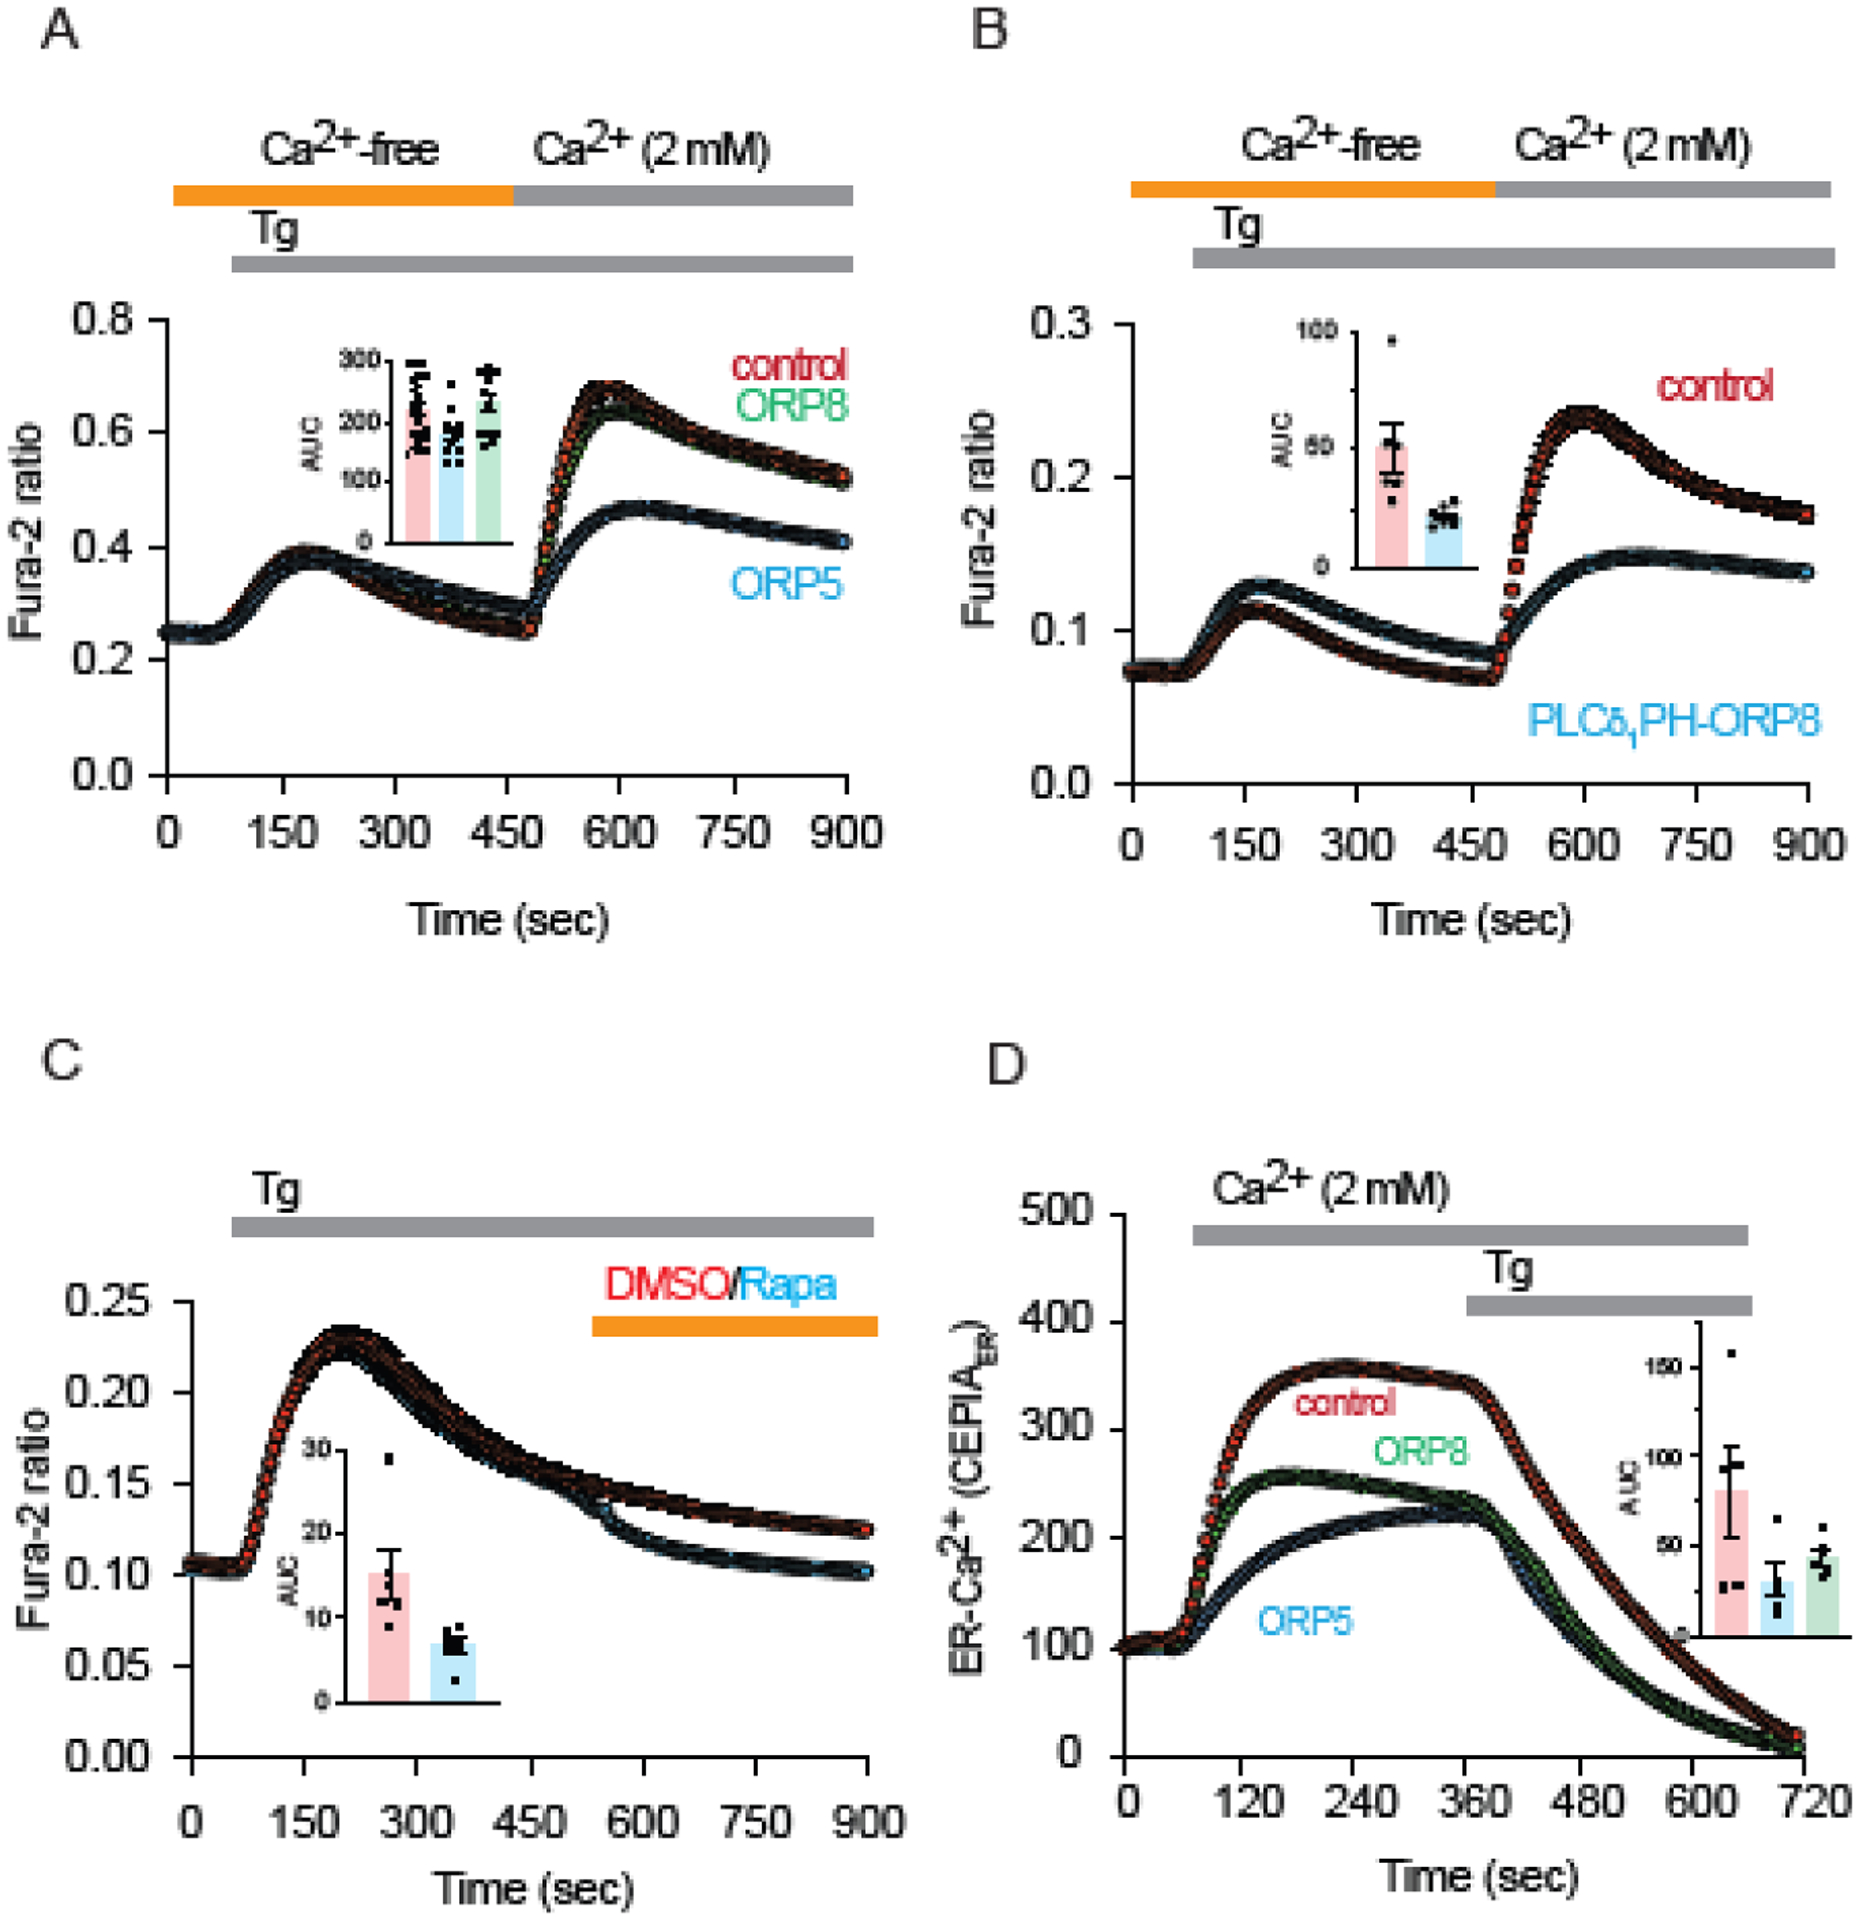
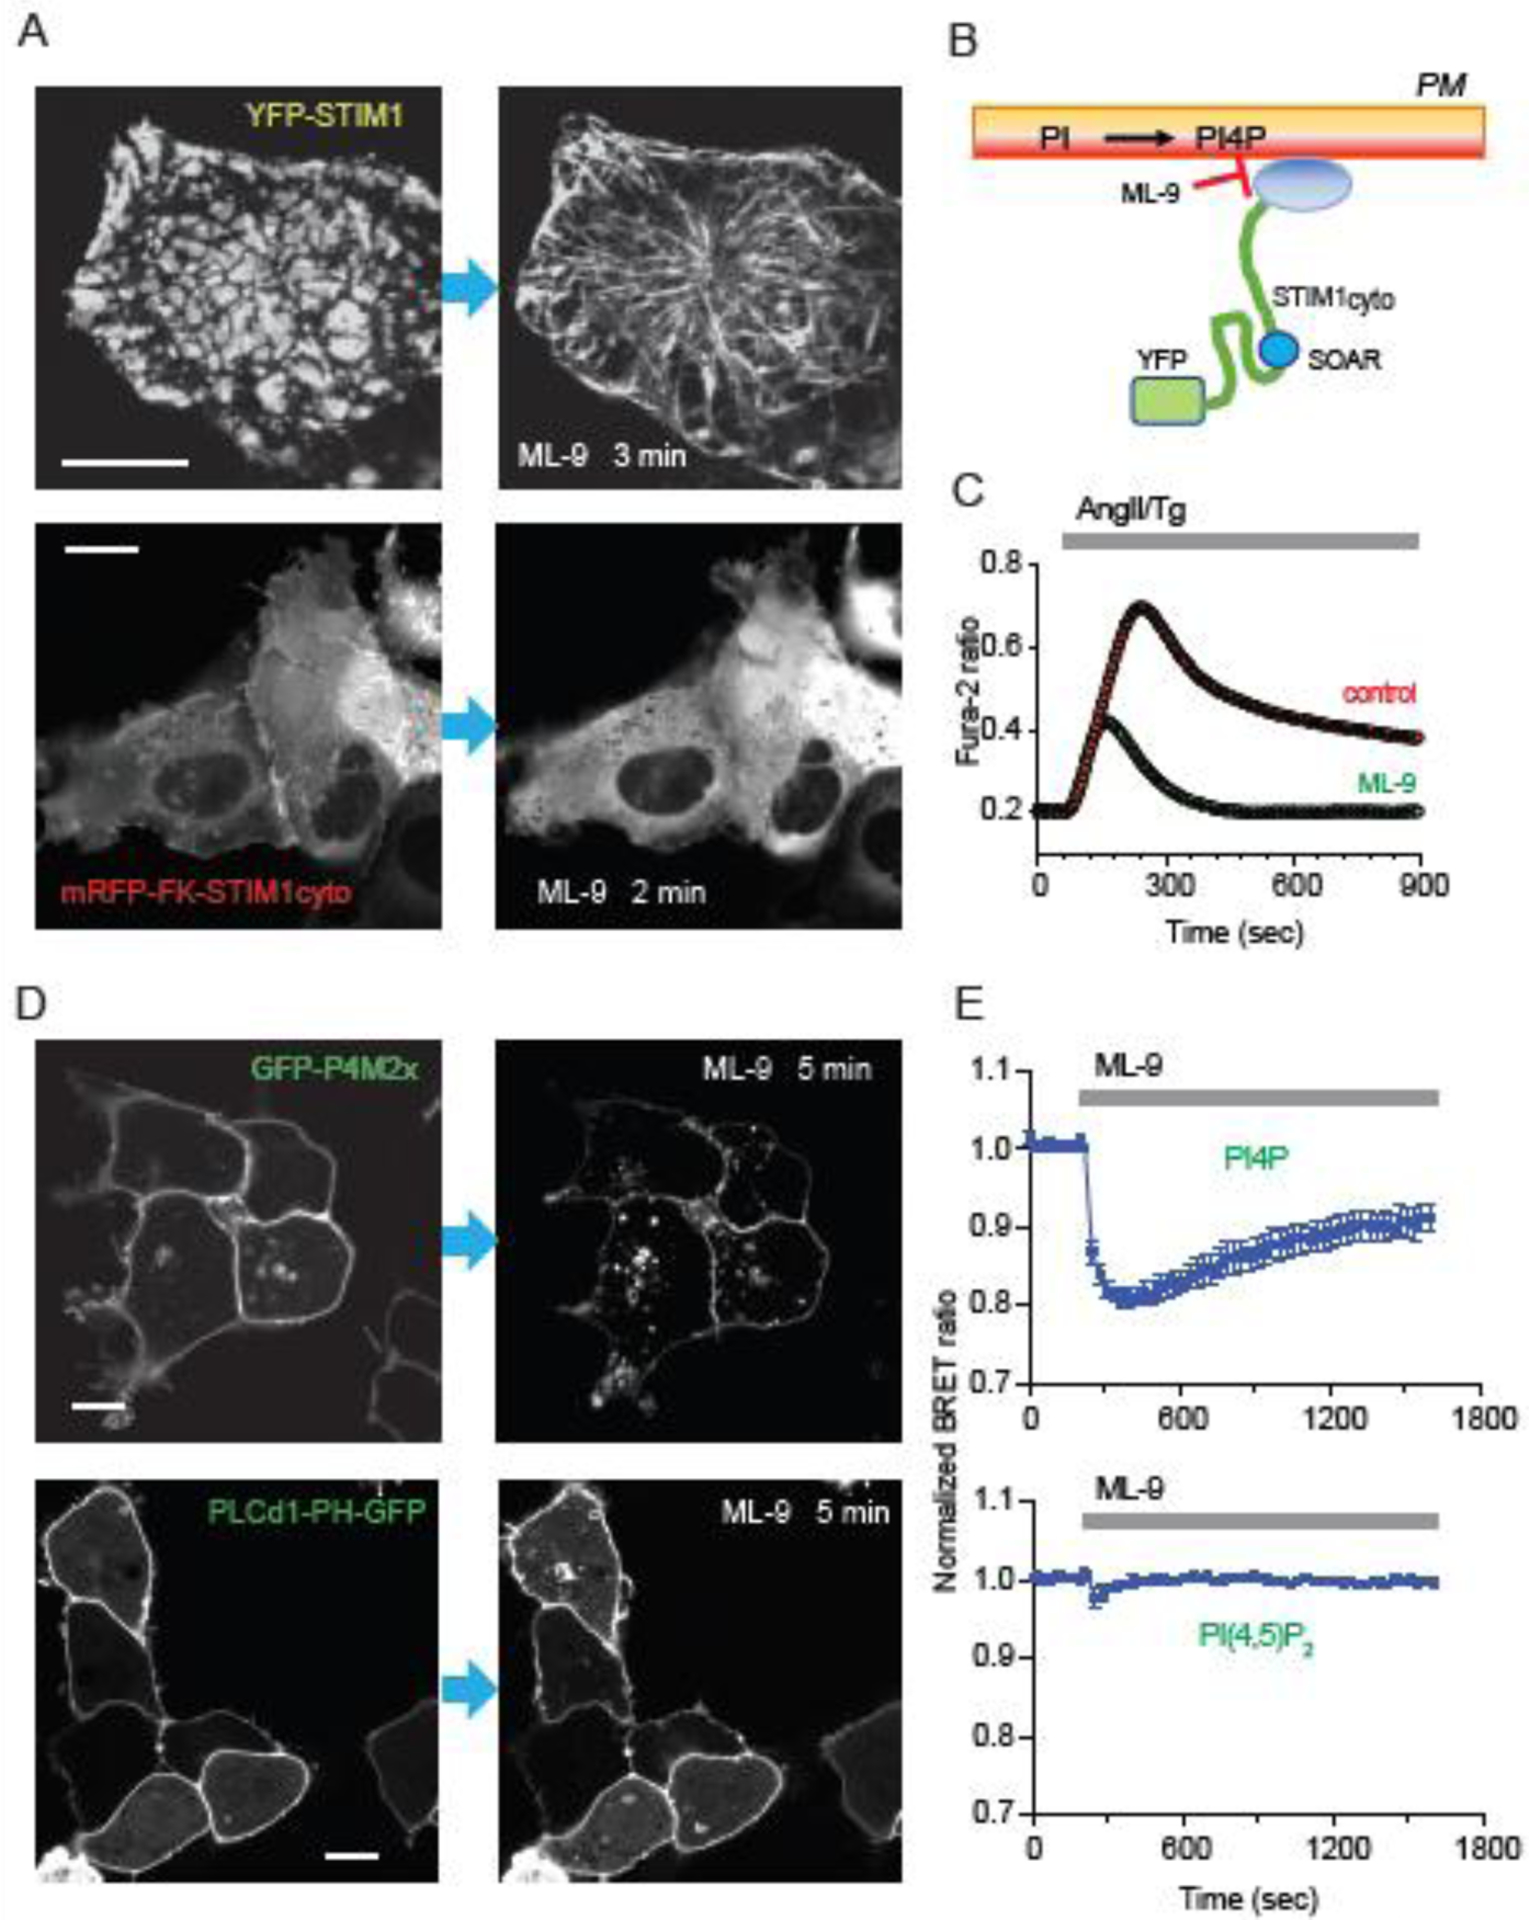
The ER-resident proteins STIM1 together with the plasma membrane (PM)-localized Orai1 channels constitute the molecular components of the store-operated Ca2+ entry (SOCE) pathway. Prepositioning of STIM1 to the peripheral ER close to the PM ensures its efficient interaction with Orai1 upon a decrease in the ER luminal Ca2+ concentration. The C-terminal polybasic domain of STIM1 has been identified as mediating the interaction with PM phosphoinositides and hence positions the molecule to ER-PM contact sites. Here we show that STIM1 requires PM phosphatidylinositol 4-phosphate (PI4P) for efficient PM interaction. Accordingly, oxysterol binding protein related proteins (ORPs) that work at ER-PM junctions and consume PI4P gradients exert important control over the Ca2+ entry process. These studies reveal an important connection between non-vesicular lipid transport at ER-PM contact sites and regulation of ER Ca2+store refilling.

Keywords: Calcium; ER; Lipid transfer proteins; Membrane contact sites; Phosphatidylinositol; Phosphoinositides; Plasma membrane.


Conflict of interest statement

Declaration of Competing Interest

The authors declare that they have no conflict of interest pertinent to this study.

Figures

Figure 1:
Figure 1:. Association of STIM1 with the plasma membrane (PM) depends on the C-terminal polybasic domain.
(A) Domain structure on a liner representation of STIM1. (EF, Ca2+ binding EF hand domain; SAM, sterile alpha motif; TM, transmembrane domain; CC1/2/3, coiled-coil domains; SOAR, Stim-Orai activation region, also called CAD; D, acidic stretch; S/P, serine-proline rich region; K, polybasic domain). (B) sequence alignment of the STIM1 C-terminus. (C) Confocal images of YFP-tagged STIM1 or its indicated mutants expressed in COS-7 cells. Note that with increased expression, STIM1 generates more ER-PM appositions even without expression of Orai1. Removal of the polybasic domain prevents the formation of such appositions, but the protein still can cluster upon depletion of ER-luminal Ca2+by the addition of ATP (50 μM) to stimulate P2y purinergic receptors and thapsigargin (Tg, 200 nM) to block the ER-localized SERCA pump. The small cartoon depicts that even the isolated entire cytoplasmic sequence of STIM1 shows PM localization that is eliminated when the polybasic domain (PBD) is removed as shown in panels in (D). Scale bars: 10 μm.
Figure 2:
Figure 2:. Plasma membrane PI4P levels affect store-operated Ca2+ entry.
(A,B) Bioluminescence energy transfer (BRET) measurements of PI4P (A) and PI(4,5)P2 (B) in HEK293 cells that stably express AT1 angiotensin II receptors (HEK293-AT1 cells). Pharmacological inhibition of the PI4KA enzyme that is responsible for the production of PI4P in the PM by the GSK-A1 compound (100 nM) [37] leads to a slow decrease in PM PI4P the rate of which does not depend on the addition of Tg (200 nM) (red and green traces, respectively). GSK-A1 treatment, does not decrease PI(4,5)P2 levels, which show a slight elevation. Addition of Tg does not cause significant activation of PLC even though it elevates cytoplasmic Ca2+. BRET ratios were normalized to the values determined in cells treated with DMSO only. (Means ± S.E.M of three experiments are shown performed in triplicates). (C,D) Cytoplasmic Ca2+ changes in Fura-2-loaded HEK293-AT1 cells. GSK-A1 (100 nM) pre-incubation for 45 min strongly inhibits the plateau-phase of Ca2+ increase in cells stimulated by angiotensin II (AngII, 100 nM) together with Tg (200 nM) (C) (Means ± SEM from 376 control and 565 GSK-A1 cells are shown obtained in 1 pair of dishes obtained in three separate experiments). Paired t-test was performed on areas under the curve (AUC) calculated for the individual experiments and is shown in the insert (P=0.0290). (D) Cells were treated with Tg in nominally Ca2+-free (containing 0.1 mM EGTA) medium, followed by the addition of Ca2+ (2 mM). Cells were also co-transfected with a TK-promoter driven STIM1 and Orai1 (teal and pink traces) or were non-transfected (red and blue traces). GSK-A1 (teal and blue traces) or DMSO (red and pink traces) were added 45 min before stimulation. Means ± SEM from 194 (red), 149 (pink) and 234 (blue) and 137 (teal) cells are shown obtained in paired dishes in three separate experiments. Paired t-test was performed on the areas under the curve (AUC) calculated for all individual dishes in each separate experiments for the Ca2+ free period (insert left columns, P=0.3422) and for the period after Ca2+ addition (insert right columns, P=0.0091). Note that the inhibitory effect of GSK-A1 can be overcome by overexpression of the STIM1/Orai proteins. (E) Monitoring the ER luminal Ca2+ changes with G-CEPIA1er expression in HEK293-AT1 cells. [43]. Cells were transfected with the plasmid coding for G-CEPIA1er for 24 h and kept in Ca2+-free medium containing 0.1 mM EGTA for 10 minutes before starting the recordings. Ca2+ (2 mM) was then added back at the indicated time followed by the addition of Tg (200 nM). GSK-A1 (100 nM) treatment started 45 min before incubation in Ca2+-containing medium. Fluorescence of individual cells were normalized using the formula of [Fcorr =(F-Fmin)/F0-Fmin]. (Means ± SEM are shown from 70 and 76 cells for control and GSK-A1-treted cells, respectively, obtained in 5–6 dishes in two independent experiments). Student t-test was performed on the area under the curve (AUC) values calculated for the time-period between Ca2+ and Tg additions for the individual dishes as shown in the insert (P=0.0293).
Figure 3:
Figure 3:. Effect of PI4KA inhibition on mitochondrial Ca2+ uptake
Experiments monitoring mitochondrial Ca2+ using expressed G-CEPIA2mito [43]. (A) One day after transfection with the G-CEPIA2mito construct, HEK293-AT1 cells were incubated with or without GSK-1A (100 nM) for 20–25 min before switching to a Ca2+-free medium containing 0.1 mM EGTA for 10 minutes. Ca2+ (2 mM) was then added back at the indicated time, followed by the addition of Tg (200 nM). Fluorescence values were then normalized [Fcorr =(F-Fmin)/Fmin]; Means ± SEM are shown from 277 and 334 cells for control and GSK-A1-treted cells, respectively, obtained in 6 dishes each in three independent experiments). Student t-test was performed on the areas under the curve (AUC) values calculated for the time period after Tg addition for each individual dish in each group (P=0.001). (B) In similar experiments the effect of GSK-A1 treatment on mitochondrial Ca2+ uptake after AngII stimulation was studied. Here, the cells were pretreated with GSK-A1 or DMSO as described for panel A and switched to a Ca2+-free medium containing 0.1 mM EGTA immediately before mounting and addition of AngII (100 nM) (~1.5–2 min). At the end of the AngII stimulation (at the 8 min time point) FCCP (5 μM) was added (not shown in the trace). Fluorescence of individual cells were normalized using the formula of [Fcorr =(F-Fmin)/F0-Fmin]. Means ± SEM are shown from 184 and 182 cells for control and GSK-A1-treted cells, respectively, obtained in 6 dishes obtained in three independent experiments. Student t-test was performed on the area under the curve (AUC) values calculated for the individual dishes shown in the insert (NS, P=0.726). (Note that FCCP was not used in the studies shown in panel A that is why the scales differ between panels A and B).
Figure 4:
Figure 4:. Effect of PI4KA inhibition on STIM1 PM association I.
Confocal images of HEK293-AT1 cells transfected with YFP-STIM1. (A) Cells expressing higher amount of STIM1 show the characteristic ER-PM appositions. These appositions are eliminated after treatment of the cells with the PI4KA inhibitor, GSK-A1 (30 nM). (B) Cells expressing low levels of STIM1 show the characteristic microtubule plus end enrichment before stimulation and respond by moving into ER-PM contacts upon stimulation with AngII (100 nM). Treatment with GSK-A1 reverses the localization of STIM1. Note that both the bottom planes and the middle planes of the cells are shown in the left and right panels, respectively. Scale bar: 10 μm.
Figure 5:
Figure 5:. Effect of PI4KA inhibition on STIM1 PM association II.
(A) Confocal pictures of HEK293-AT1 cells expressing the full cytoplasmic segment of STIM1 fused to an mRFP-FKBP tag at the N-terminus as shown in the cartoon. Note that the PM association of the protein is eliminated after treatment of the cells with GSK-A1 (100 nM). (Scale bar: 10 μm) (B) As reported in our previous study, co-expression of this STIM1 construct with Orai1 and an ER-targeted FRB fragment can generate a cytoplasmic Ca2+ increase upon clustering the STIM1-Orai complex by the addition of rapamycin (100 nM) that generates ER-PM contacts with the clustered STIM1-Orai1 [6] (see cartoon on the right). As shown in the left panel in Fura-2 loaded HEK293-AT1 cells, preincubation with GSK-A1 (100 nM, 45 min) decreases the basal Ca2+ as well as the slope and plateau of rapamycin-induced Ca2+ rise. (Means ± SEM are shown from 38 (red) and 15 (blue) cells, from 2 dishes each, in 3 independent experiments). Slopes of Ca2+ increase after rapamycin were calculated for responding cells in each individual dish (see inset) and the difference was analyzed by Student’s t-test (P=0.0138).
Figure 6:
Figure 6:. Effects of ORP5 and ORP8 overexpression on store-operated Ca2+ entry.
(A) HEK293-AT1 cells were transfected with mCherry-tagged ORP5 (blue) or ORP8 (green) or with mCherry (red) as control for 24 h and their Ca2+ responses were monitored by Fura-2 as described in Fig. 2D. (Means ± SEM are shown from 694 (red), 377 (blue) and 434 (green) cells from 24, 11 and 13 dishes, respectively, obtained in 5 independent experiments). Areas under the curve (AUC) were calculated for the period following Ca2+ addition for each individual dish (shown in the inset) and differences were assessed by Student’s t-test (P=0.019). (B) Similar experiments were performed using mCherry-tagged ORP8 in which the PH domain of PLCδ1 was inserted in place of the ORP8 PH domain [28]. (Mean ± SEM for 245 (red) and 224 (blue) cells are shown from 6 and 7 dishes, respectively, obtained in three separate experiments. Area under the curve (AUC) was calculated for the period following Ca2+ addition for each individual dish (shown in the inset) and differences were analyzed with Student’s t-test with Welch’s correction (P=0.0355). (C) Cytoplasmic Ca2+ changes in HEK293-AT1 cells transfected with a plasma membrane targeted FRB construct and an mCherry-tagged ORP5 in which the PH domain was replaced with an FKBP12 module [28]. Addition of Rapamycin to such transfected cells causes the ORP5 to engage with the PM and extract PI4P thereby acutely decreasing PM PI4P but not PI(4,5)P2 levels [28]. Here, rapamycin addition decreases the cytoplasmic Ca2+ elevations evoked by Tg treatment. (Means ± S.E.M of 189 and 206 cells for DMSO and rapamycin-treated cells, respectively, from 6 dishes each obtained in three experiments. Statistical difference was evaluated by comparing the areas under the curve (AUC) that were calculated for the rapamycin/DMSO-treatment period in each individual dish and analyzed by t-test with Welch’s correction (P=0.0339). (D) ER-luminal Ca2+ changes in cells expressing mCherry-ORP5 (blue) or mCherry-ORP8 (green) or mCherry alone (red) as described in the legend to Fig. 2E. (Means ± SEM are shown from 216 (red), 194 (blue) and 203 (green) cells from 5 separate dishes obtained in three independent experiments). AUC values were calculated for each of the individual dishes (shown in the insert) and analyzed with 2-way ANOVA due to the unusually big variations in the magnitude of the Tg responses in the mCherry control group. (Control vs. ORP5: P=0.0235; control vs. ORP8 P=0.770). Note that the scales of panels B and C differ from those of the rest of Fura-2 Ca2+ measurements as these recent experiments were performed using a different hardware (see Materials and Methods).
Figure 7:
Figure 7:. Effect of ML-9 on STIM1 plasma membrane association and phosphoinositide measurements.
(A) Confocal images of COS-7 cells expressing full-length YFP-STIM1 (upper) or the mRFP-tagged entire cytoplasmic STIM1 fragment (lower) as shown in the cartoon in (B). ML-9 (50 μM) rapidly reverses the PM association of either the full-length STIM1 or its cytoplasmic fragment (right panels). (C) ML-9 pretreatment (10 min) has a strong inhibitory effect on the Ca2+-increase measured in Fura-2-loaded HEK293-AT1 cells as described by Smyth et al [48]. (D) Confocal images of HEK293-AT1 cells expressing the PI4P reporter, P4M2x-GFP before and after ML-9 treatment (upper). Note the decrease in the fraction of PM-associated reporter and its re-localization to the PI4P-rich endosomes. Similar experiment showing the behavior of the PI(4,5)P2 reporter, PLCδ1PH-GFP (lower). Note that this reporter does not respond to ML-9 treatment with similar reorganization. (E) BRET measurements of PI4P (upper) and PI(4,5)P2 (lower) changes in the PM using the reporters shown in panels D and E, respectively. Note the rapid drop in the PM-association of the PI4P but not the PI(4,5)P2 reporter construct. (Means ± SEM, n=3, each performed in triplicates). (Scale: 10 μm)

Similar articles

Cited by

References

    1. Putney JW Jr., A model for receptor-regulated calcium entry, Cell calcium, 7 (1986) 1–12. - PubMed
    1. Liou J, Kim ML, Heo WD, Jones JT, Myers JW, Ferrell JE Jr., Meyer T, STIM is a Ca2+ sensor essential for Ca2+-store-depletion-triggered Ca2+ influx, Curr.Biol, 15 (2005) 1235–1241. - PMC - PubMed
    1. Roos J, DiGregorio PJ, Yeromin AV, Ohlsen K, Lioudyno M, Zhang S, Safrina O, Kozak JA, Wagner SL, Cahalan MD, Velicelebi G, Stauderman KA, STIM1, an essential and conserved component of store-operated Ca2+ channel function, J.Cell Biol, 169 (2005) 435–445. - PMC - PubMed
    1. Vig M, Peinelt C, Beck A, Koomoa DL, Rabah D, Koblan-Huberson M, Kraft S, Turner H, Fleig A, Penner R, Kinet JP, CRACM1 is a plasma membrane protein essential for store-operated Ca2+ entry, Science, 312 (2006) 1220–1223. - PMC - PubMed
    1. Prakriya M, Feske S, Gwack Y, Srikanth S, Rao A, Hogan PG, Orai1 is an essential pore subunit of the CRAC channel, Nature, 443 (2006) 230–233. - PubMed

Publication types

MeSH terms