. 2022 Aug 18;29(8):1288-1302.e7.
doi: 10.1016/j.chembiol.2022.06.010. Epub 2022 Jul 18.

Allosteric HSP70 inhibitors perturb mitochondrial proteostasis and overcome proteasome inhibitor resistance in multiple myeloma

Affiliations

Allosteric HSP70 inhibitors perturb mitochondrial proteostasis and overcome proteasome inhibitor resistance in multiple myeloma

Ian D Ferguson et al. Cell Chem Biol. .

Abstract

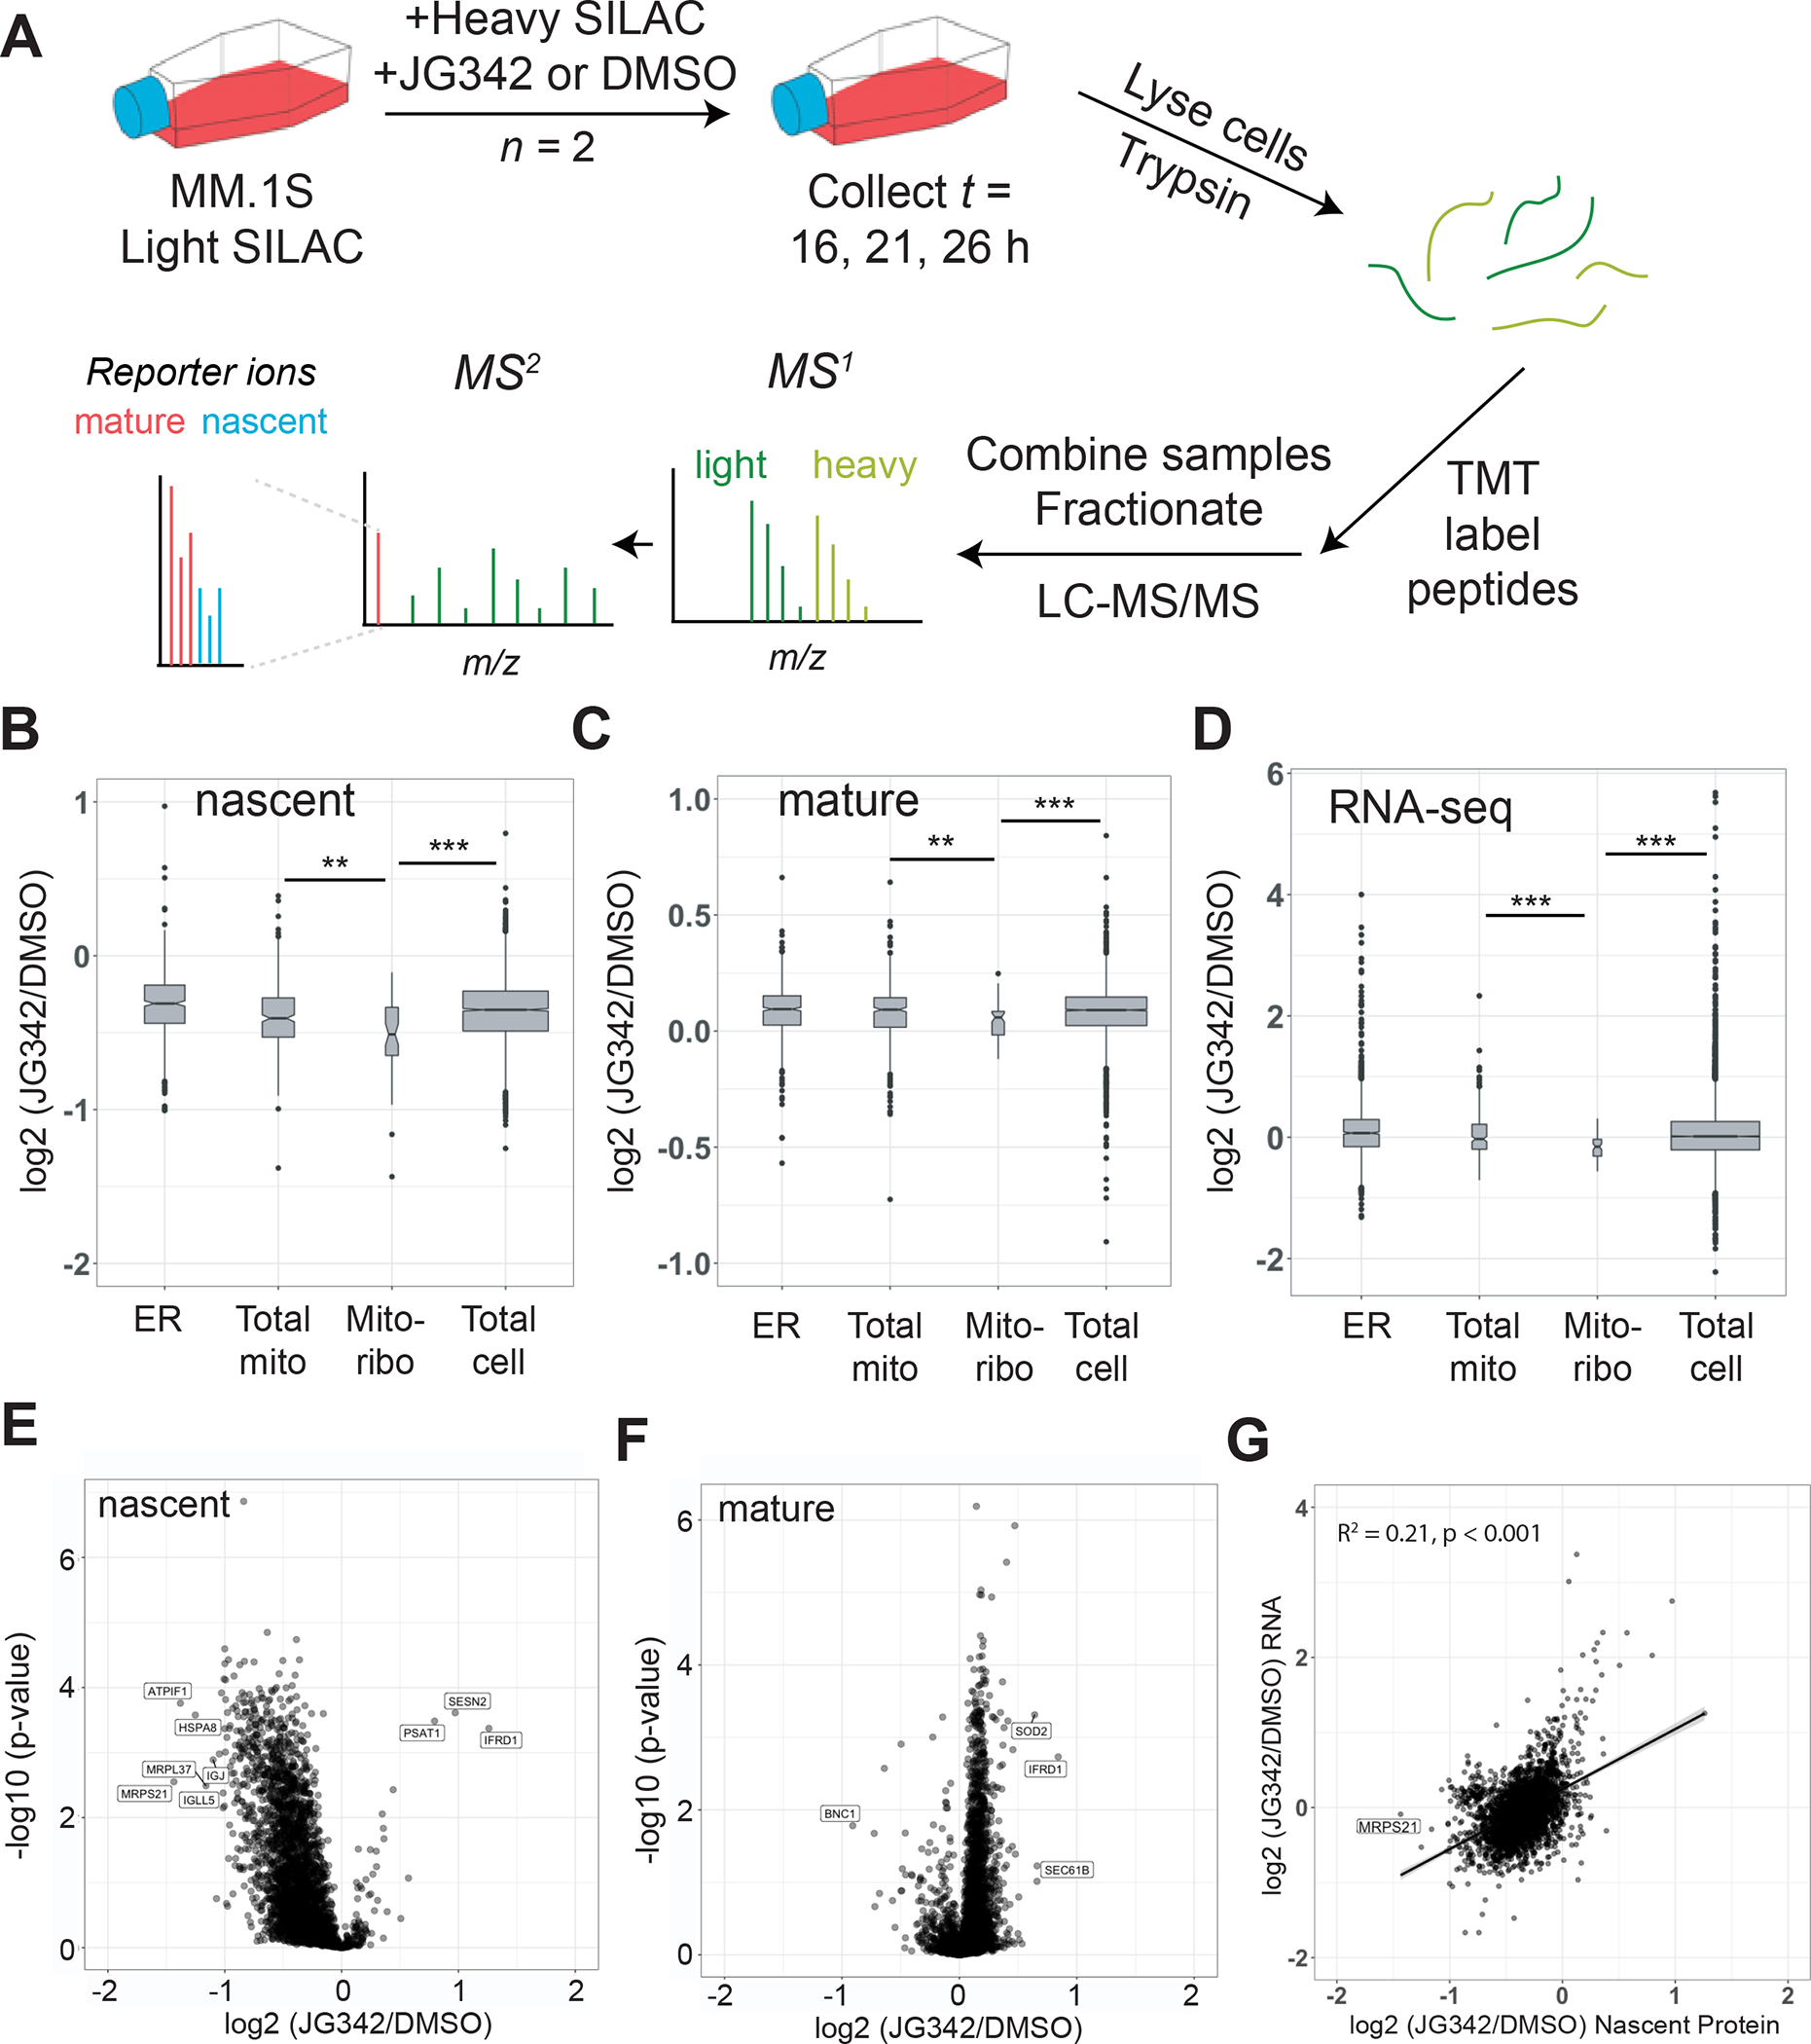
Proteasome inhibitor (PI) resistance remains a central challenge in multiple myeloma. To identify pathways mediating resistance, we first mapped proteasome-associated genetic co-dependencies. We identified heat shock protein 70 (HSP70) chaperones as potential targets, consistent with proposed mechanisms of myeloma cells overcoming PI-induced stress. We therefore explored allosteric HSP70 inhibitors (JG compounds) as myeloma therapeutics. JG compounds exhibited increased efficacy against acquired and intrinsic PI-resistant myeloma models, unlike HSP90 inhibition. Shotgun and pulsed SILAC mass spectrometry demonstrated that JGs unexpectedly impact myeloma proteostasis by destabilizing the 55S mitoribosome. Our data suggest JGs have the most pronounced anti-myeloma effect not through inhibiting cytosolic HSP70 proteins but instead through mitochondrial-localized HSP70, HSPA9/mortalin. Analysis of myeloma patient data further supports strong effects of global proteostasis capacity, and particularly HSPA9 expression, on PI response. Our results characterize myeloma proteostasis networks under therapeutic pressure while motivating further investigation of HSPA9 as a specific vulnerability in PI-resistant disease.

Keywords: HSP70; bortezomib; mitochondria; mitoribosome; myeloma; proteasome inhibitor; proteomics; proteostasis; resistance.


Conflict of interest statement

Declaration of interests J.E.G. and H.S. have filed a patent related to the structures of the JG compounds. A.P.W. is an equity holder and scientific advisory board member of Indapta Therapeutics and Protocol Intelligence. The other authors declare no competing interests.

Figures

Figure 1.
Figure 1.. Cytosolic HSP70 shows strongest genetic co-dependency with proteasome subunits in genome-wide CRISPR screen data.
A. 406 genes involved in protein homeostasis were used in a Pearson Correlation clustering analysis of genome-wide pan-cancer CRISPR knockout dependency screen dataset downloaded from the DepMap portal (19Q1 release). Remaining 35 genes from curated list (Dataset S1) not present in DepMap CRISPR screen data. B. The most prominent co-dependency cluster includes cytosolic HSP70s (red) and proteasome subunits. Additional clusters highlighted in white squares in A. analyzed in Fig. S1.
Figure 2.
Figure 2.. PI-resistant MM models show increased sensitivity to allosteric HSP70 inhibitors.
A-B. AMO-1 bortezomib resistant (BtzR) cells are more sensitive than WT cells to an example JG compound, JG194. C. A larger panel of JG compounds (n =16) also show increased potency against AMO-1 BtzR MM model than WT. D-F. JG342 exhibits increased potency against MM cell lines resistant to Bortezomib. HSP90 inhibitor 17-DMAG does not show the same phenotype. Bortezomib sensitive cell lines - KMM1, MM1144, KMS18. Bortezomib resistant cell lines – ANBL6-BtzR, LP-1, MMM1, JIM-3, U226-BtzR, RPMI-8226 BtzR, KMS12BM. G. JG342 exhibits LC50’s in the nM range against a panel of MM cell lines (AMO1, AMO1-BtzR, AMO1-CfzR JJN3, KMS11, KMS34, L363, MM.1S, RPMI8226) and exhibits a therapeutic index against both immortalized (HS5, HS27A) and patient-derived bone marrow stromal lines. All measurements in A-G. performed as n = 4 in 384 well plates, with viability measured using CellTiterGlo at 48 hours. H-I. NSG mice (n = 3 per arm) were implanted with luciferase labeled RPMI-8226 MM cell line and dosed for two weeks with 3 mg/kg JG342 three times per week starting at day 14. JG342 exhibits in-vivo anti-MM activity, quantified in (I.). All error bars indicate +/− S.D. p-value by two-sided t-test.
Figure 3.
Figure 3.. JG98 destabilizes the mitochondrial ribosome.
A. Experimental schematic. KMS34, MM1.S, and RPMI-8226 MM lines were treated for 22 hr with Bortezomib (Proteasome), 17-DMAG (HSP90), CB-5083 (p97/VCP), JG98 (HSP70), or DMSO. Two biological replicates combined into TMT-10plex for each cell line. B. JG98 leads to selective depletion of 55S mitochondrial ribosome subunits; data aggregated across three cell lines. C. Log2-fold changes for mitochondrial ribosome subunits vs. all other mitochondrial proteins; data aggregated across three cell lines. D. AMO-1 WT and BtzR cells were treated with 1μM JG342, JG98, or JG258 prior to mitochondrial isolation and flow cytometry of isolated mitochondria. JG compounds were visualized by FITC fluorescence (see Fig. S2G). Data is representative of two biological replicates. E. AMO1 WT, AMO1 BtzR, and HS-5 cells were treated with Bortezomib, JG98, JG342, or JG258 and Oxidative Consumption Rate (OCR) was measured by seahorse respirometry (n = 4 wells per treatment, performed 3 times). Asterisks represent two-sided t-test p-values vs. DMSO, NS = not significant, * = <0.05, ** = <0.01,*** = <0.001; **** = <0.0001. F. RPMI-8226 MM cells with stable integration of the CRISPR interference dCas9-KRAB construct (Ramkumar et al., 2020b) were transduced with a non-targeting guide RNA or two independent guide RNAs targeting HSPA9. Western blotting was performed for HSPA9, MRPL11, and RPS6. G. Quantification of results in (F.) versus beta-actin loading control and with relative fold-change of two HSPA9 sgRNAs vs. scramble sgRNA, in two independent replicates, demonstrates significant depletion of MRPL11 but not RPS6. p-value by two-sided t-test. H. Increased HSPA9 gene expression by qPCR in AMO1 BtzR cells transduced with HSPA9 expressing lentivirus vs empty vector (EV) lentivirus control. I. Overexpression of HSPA9 increases LC50 of JG342 in AMO1 BtzR cells using same assay conditions as in Fig. 2A–G. All error bars indicate +/− S.D.
Figure 4.
Figure 4.. JG342 destabilizes nascent and mature mitochondrial ribosome subunits in the context of global translational slowdown.
A. Pulsed-SILAC experimental schematic. Briefly, MM1.S cells grown in Light SILAC media are switched to Heavy SILAC media containing 350 nM JG342 or DMSO at t = 0 hr. Cells are collected at 16, 21, 26 hours, lysed, and proteins digested with trypsin, followed by TMT labeling. Samples are combined in 7-plex experiments, fractionated by HPLC and analyzed by MS/MS on Orbitrap Fusion Lumos. B-C. Log2-fold changes across timepoints for JG342 treated vs. DMSO for nascent (B) and mature (C) proteins in endoplasmic reticulum (ER), mitochondria (Total mito), mitochondrial ribosome (Mito-ribo), and rest of the proteome (Total cell category excludes proteins included in previous three categories). D. RNA-seq TPM log2-fold changes between JG342 and DMSO treated samples from 26 hr timepoint. E-F. Log2-fold changes under 350 nM JG342 vs. DMSO across timepoints separating heavy-labeled nascent (E) and light-labeled mature (F) protein indicate MRPS21 and MRPL37 are among most prominently depleted nascent proteins after JG342. G. Log2-fold changes for RNA at 26 hr time point and nascent protein across 16, 21, and 26 hr timepoints. ** = two-sided t-test p-value < 0.01, *** < 0.001.
Figure 5.
Figure 5.. JG compounds activate a non-canonical UPR without compensatory chaperone upregulation in myeloma cells.
A. RNA-seq log2-fold changes for JG342 vs. DMSO treated MM.1S cells from 26-hour timepoint (as in Fig. 4D). B-C. JG98 (B) and JG342 (C) activate some canonical markers of the UPR in MM.1S cells. Cells were treated with 3 μM compound and UPR marker proteins were analyzed by Western blot. D. JG342 (2 μM) leads to translational slowdown without upregulation of major HSP70 isoforms HSPA5 (BiP, endoplasmic reticulum), HSPA9 (mitochondria), or HSPA8 (cytosolic). Puromycin incorporation performed by 1 hr incubation of 1μM puromycin at each designated time point, and protein levels analyzed by western blot. E. TMT-proteomics (data from experiment outlined in Fig 3A) identifies relative lack of compensatory chaperone upregulation in JG98-treated cells. Analysis here shows 244 proteins out of 441 curated proteostasis genes quantified in TMT mass spectrometry experiments across three cell lines. F. Translational slowdown via puromycin incorporation and total HSP70 levels analyzed by western blot in KMS34 cells treated with 2μM JG98, 7.5nM Bortezomib, 1μM CB-5083, 500nM 17-DMAG, or DMSO for 22 hours and 1 μM Puromycin for 1 hour. Consistent with proteomic data, only Btz and 17-DMAG show an increase in total HSP70, while all drugs lead to translational slowdown, potentially due to the Integrated Stress Response.
Figure 6.
Figure 6.. High baseline expression of proteostasis genes, especially HSPA9 and mitoribosome subunits, lead to poorer outcomes in MM patients treated with PIs.
A-D. Kaplan-Meier curves for overall survival stratified by top and bottom 20 percent of patients for RNA-expression of HSPA9 (mitochondrial HSP70), HSPA8 (cytosolic HSP70), HSPA5 (ER HSP70), and an aggregate 60 gene score of mitoribosome subunits. All RNA-seq (in TPM, from CD138+ enriched tumor cells at MM diagnosis) and overall survival data from 773 patients in the Multiple Myeloma Research Foundation CoMMpass study release IA14. E. Volcano plot of proteostasis genes using p-values for predictions of relative progression-free survival (PFS) for top and bottom 20% of patients by gene expression (in TPM). 241 genes from 441 from curated proteostasis gene list are included. Genes were included if expressed at TPM >1 across all MM samples and had reached median PFS value in both the top- and bottom-quintiles of expression. Difference in median PFS in days shown along x-axis. HSPA9 is one of the strongest predictors of poor PFS when highly expressed. HSP70 isoforms are colored in blue, 20S proteasome beta subunits colored in green, 20S proteasome alpha subunits colored in red, and 19S proteasome cap subunits colored in purple. F. Kaplan-Meier curves for RNA-expression of PSMD2 shows decreased overall survival in patients with high PSMD2 at baseline. All p-values by log-rank test.

Similar articles

Cited by

References

    1. Acosta-Alvear D, Cho MY, Wild T, Buchholz TJ, Lerner AG, Simakova O, Hahn J, Korde N, Landgren O, Maric I, et al. (2015). Paradoxical resistance of multiple myeloma to proteasome inhibitors by decreased levels of 19S proteasomal subunits. eLife 4, e08153. - PMC - PubMed
    1. Anderson DJ, Le Moigne R, Djakovic S, Kumar B, Rice J, Wong S, Wang J, Yao B, Valle E, Kiss von Soly S, et al. (2015). Targeting the AAA ATPase p97 as an Approach to Treat Cancer through Disruption of Protein Homeostasis. Cancer Cell 28, 653–665. - PMC - PubMed
    1. Barretina J, Caponigro G, Stransky N, Venkatesan K, Margolin AA, Kim S, Wilson CJ, Lehar J, Kryukov GV, Sonkin D, et al. (2012). The Cancer Cell Line Encyclopedia enables predictive modelling of anticancer drug sensitivity. Nature 483, 603–607. - PMC - PubMed
    1. Barrio S, Stuhmer T, Da-Via M, Barrio-Garcia C, Lehners N, Besse A, Cuenca I, Garitano-Trojaola A, Fink S, Leich E, et al. (2019). Spectrum and functional validation of PSMB5 mutations in multiple myeloma. Leukemia 33, 447–456. - PubMed
    1. Besse A, Stolze SC, Rasche L, Weinhold N, Morgan GJ, Kraus M, Bader J, Overkleeft HS, Besse L, and Driessen C (2018). Carfilzomib resistance due to ABCB1/MDR1 overexpression is overcome by nelfinavir and lopinavir in multiple myeloma. Leukemia 32, 391–401. - PMC - PubMed

Publication types

MeSH terms

Substances