. 2022 Jul 19;10(1):50.
doi: 10.1038/s41413-022-00220-1.

GsαR201C and estrogen reveal different subsets of bone marrow adiponectin expressing osteogenic cells

Affiliations

GsαR201C and estrogen reveal different subsets of bone marrow adiponectin expressing osteogenic cells

Biagio Palmisano et al. Bone Res. .

Abstract

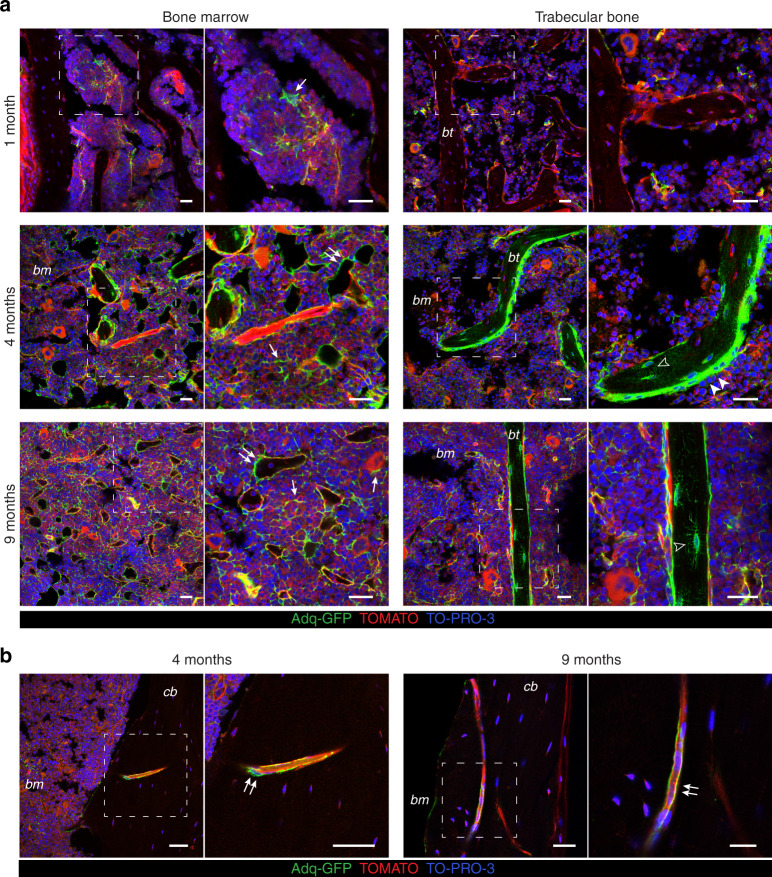
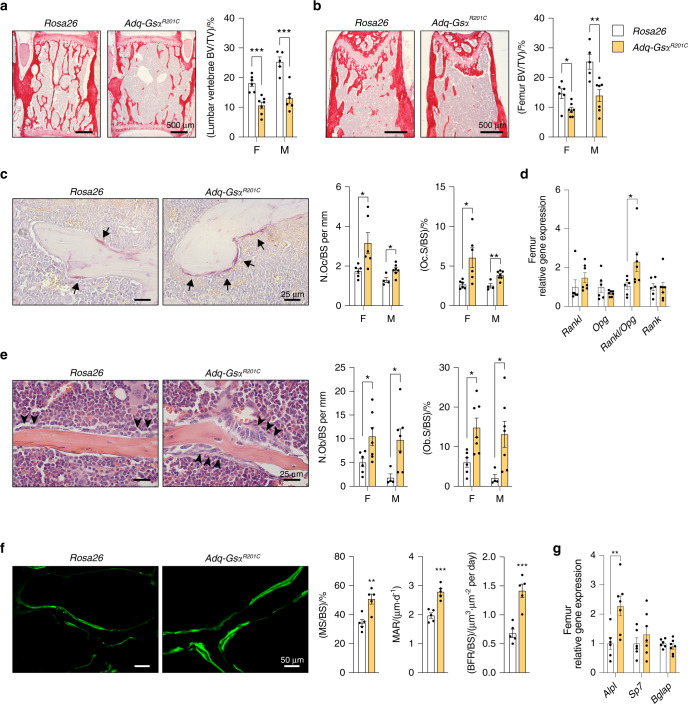
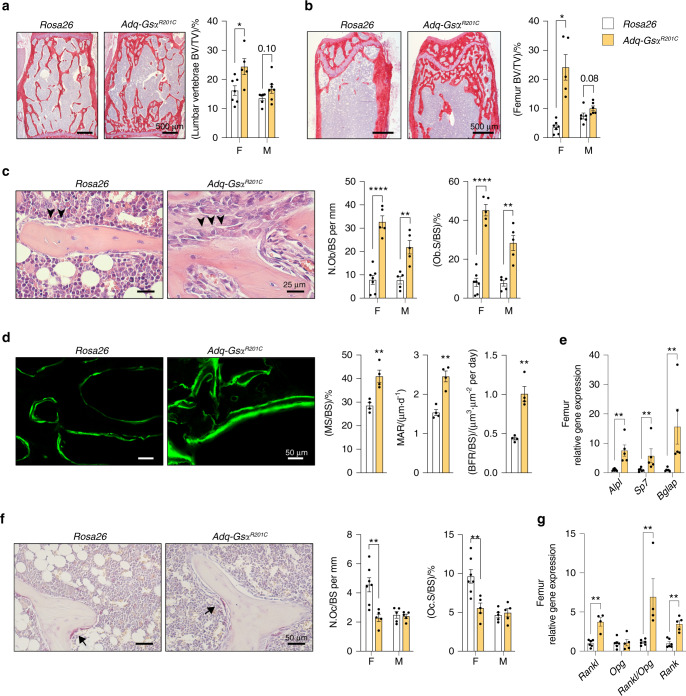
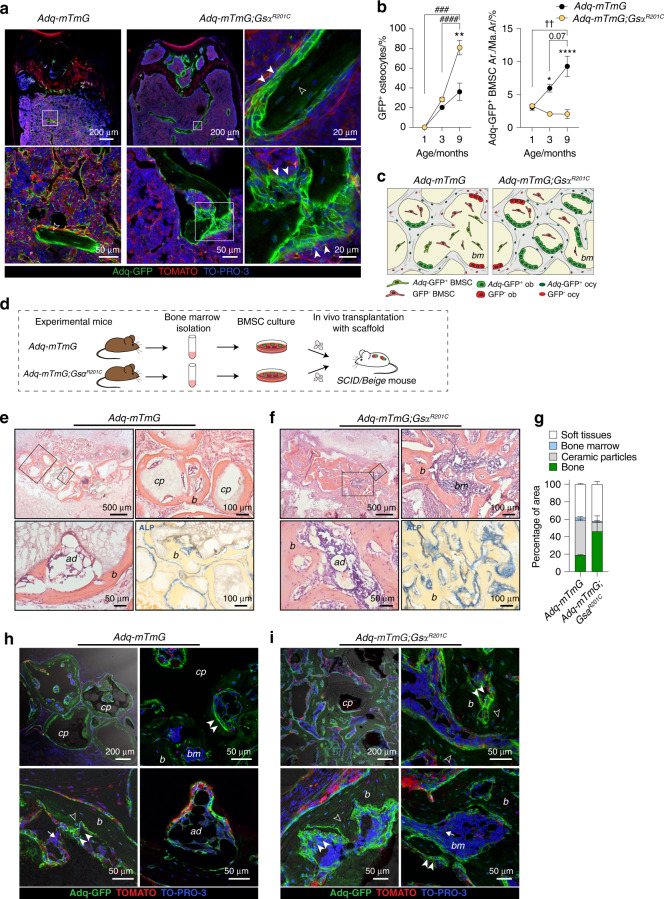
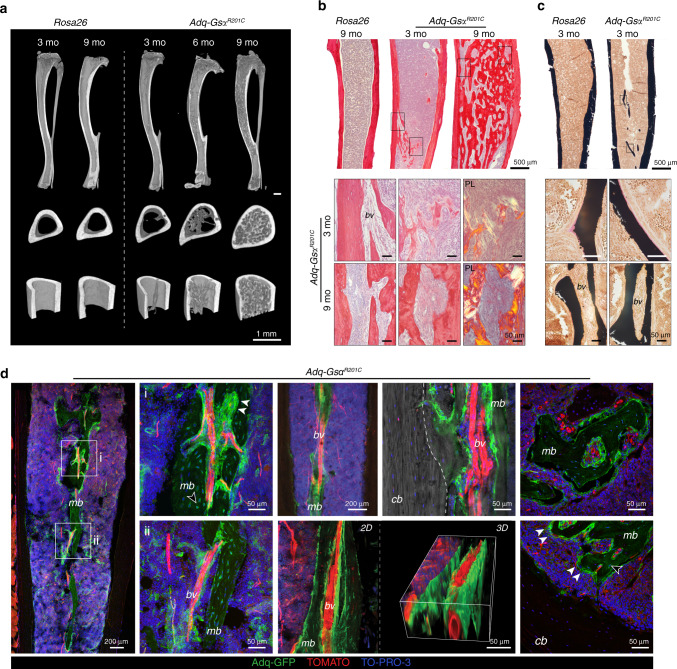
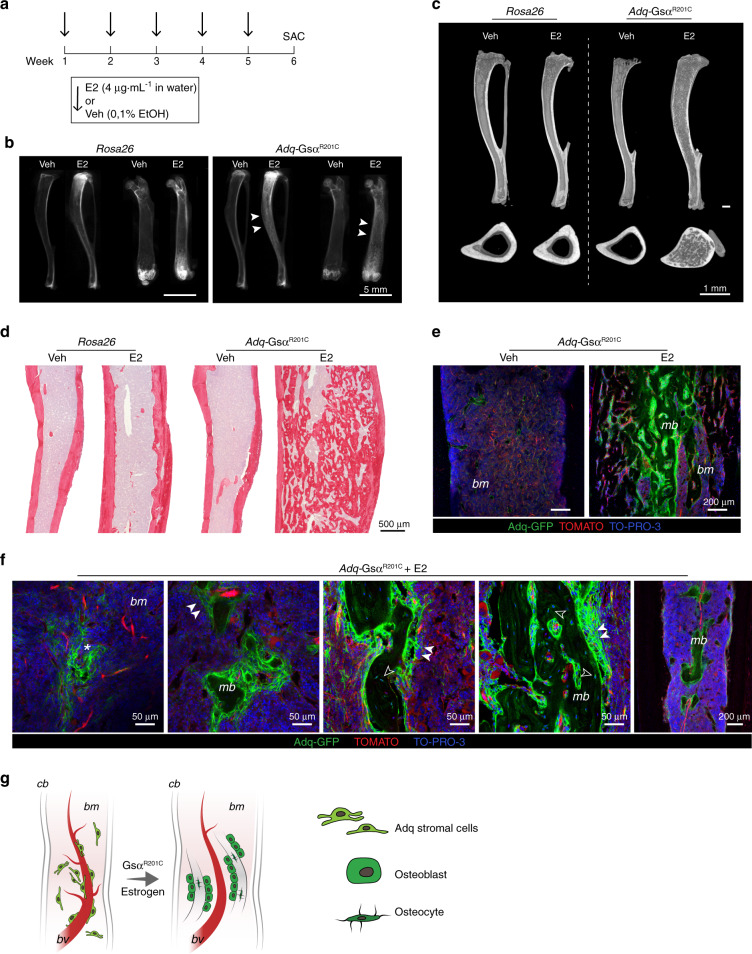
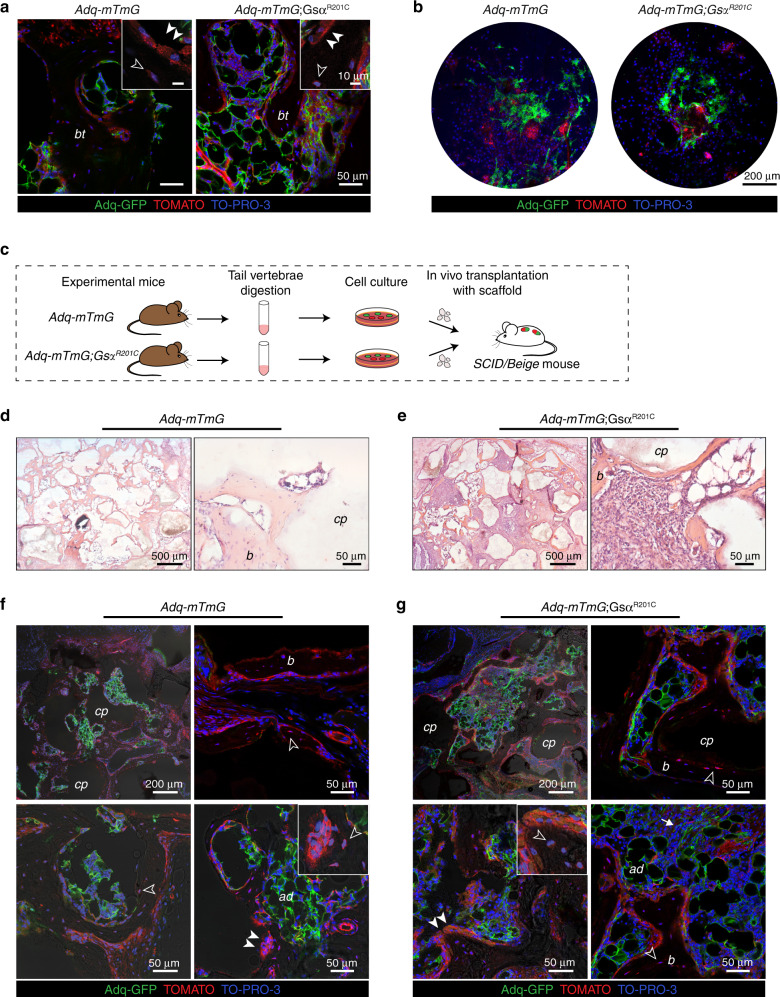
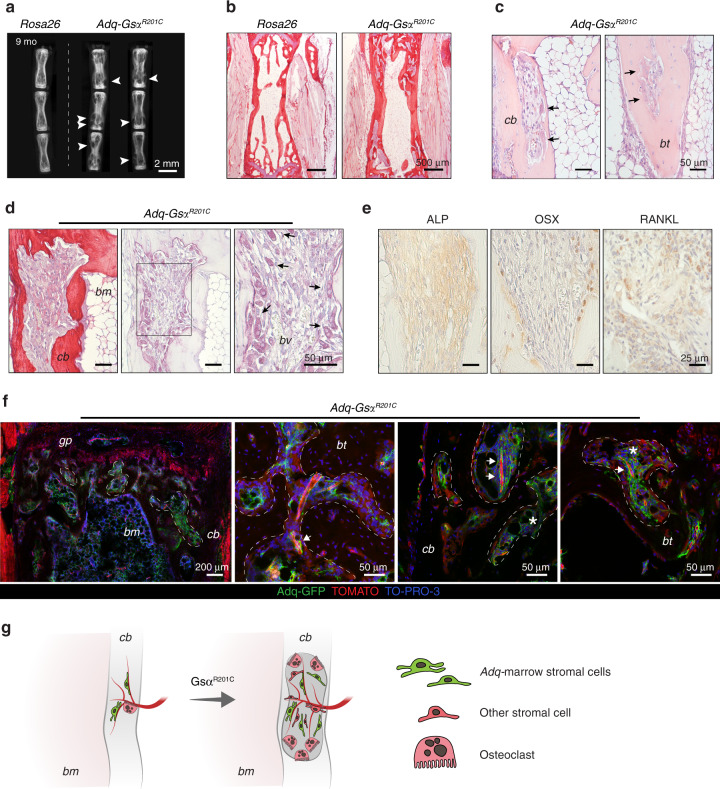
The Gsα/cAMP signaling pathway mediates the effect of a variety of hormones and factors that regulate the homeostasis of the post-natal skeleton. Hence, the dysregulated activity of Gsα due to gain-of-function mutations (R201C/R201H) results in severe architectural and functional derangements of the entire bone/bone marrow organ. While the consequences of gain-of-function mutations of Gsα have been extensively investigated in osteoblasts and in bone marrow osteoprogenitor cells at various differentiation stages, their effect in adipogenically-committed bone marrow stromal cells has remained unaddressed. We generated a mouse model with expression of GsαR201C driven by the Adiponectin (Adq) promoter. Adq-GsαR201C mice developed a complex combination of metaphyseal, diaphyseal and cortical bone changes. In the metaphysis, GsαR201C caused an early phase of bone resorption followed by bone deposition. Metaphyseal bone formation was sustained by cells that were traced by Adq-Cre and eventually resulted in a high trabecular bone mass phenotype. In the diaphysis, GsαR201C, in combination with estrogen, triggered the osteogenic activity of Adq-Cre-targeted perivascular bone marrow stromal cells leading to intramedullary bone formation. Finally, consistent with the previously unnoticed presence of Adq-Cre-marked pericytes in intraosseous blood vessels, GsαR201C caused the development of a lytic phenotype that affected both cortical (increased porosity) and trabecular (tunneling resorption) bone. These results provide the first evidence that the Adq-cell network in the skeleton not only regulates bone resorption but also contributes to bone formation, and that the Gsα/cAMP pathway is a major modulator of both functions.


Conflict of interest statement

The authors declare no competing interests.

Figures

Fig. 1
Fig. 1
Adipoq-Cre-targeted cell population in bone marrow and bone. a Representative confocal images of bone marrow and trabecular bone from 1-, 4- and 9-month-old Adq-mTmG mice. GFP labeling was restricted to a small number of stromal cells at 1 month of age (arrow), while at 4 and 9 months it highlighted numerous marrow stromal (arrow) and perivascular (double arrow) cells, the majority of osteoblasts (arrowhead) and osteocytes (hollow arrowhead). b Representative fluorescent images of GFP-labelled intracortical perivascular cells (double arrow) in 4- and 9-month-old mice. bm Bone marrow, bt Bone trabecula, cb Cortical bone. Scale bars 25 μm
Fig. 2
Fig. 2
Enhanced trabecular bone resorption in 3-month-old Adq-GsαR201C mice. a, b Representative histological pictures from Sirius red-stained sections and histomorphometric analysis of trabecular bone of lumbar vertebrae (a) and femora (b). BV/TV: bone volume per tissue volume. c TRAP histochemistry highlighting cells of the osteoclastic lineage (arrow) and histomorphometry of osteoclast parameters. N.Oc/BS: number of osteoclasts per bone surface. Oc.S/BS: osteoclast surface per bone surface. d Relative gene expression of Rankl, Opg, Rankl/Opg ratio and Rank in femora from female mice. e Representative images from H&E-stained sections showing osteoblasts (arrowhead) and histomorphometry of osteoblast parameters. N.Ob/BS: number of osteoblasts per bone surface. Ob.S/BS: osteoblast surface per bone surface. f Representative pictures of calcein labeling in trabecular bone of female mice and dynamic histomorphometry for bone formation parameters. MS/BS: mineralizing surface per bone surface. MAR: mineral apposition rate. BFR/BS: bone formation rate. g Relative gene expression of Alpl, Sp7 and Bglap in femora from female mice. F Females. M Males. Data are presented as mean ± SEM. Statistical analysis was performed using Student t-test; *P < 0.05, **P < 0.01, ***P < 0.001
Fig. 3
Fig. 3
Enhanced metaphyseal bone formation in 9-month-old Adq-GsαR201C mice. a, b Representative histological pictures from Sirius red-stained sections and histomorphometric analysis of trabecular bone of lumbar vertebrae (a) and femora (b). BV/TV: bone volume per tissue volume. c Representative images from H&E-stained sections showing osteoblasts (arrowhead) and quantitative histomorphometry of osteoblast parameters. N.Ob/BS: number of osteoblasts per bone surface. Ob.S/BS: osteoblast surface per bone surface. d Representative pictures of calcein labeling in trabecular bone of female mice and dynamic bone formation parameters. MS/BS: mineralizing surface per bone surface. MAR Mineral apposition rate. BFR/BS Bone formation rate. e Relative gene expression of Alpl, Sp7 and Bglap in femora from female mice. f TRAP histochemistry highlighting cells of the osteoclastic lineage (arrow) and quantitative histomorphometry of osteoclast parameters. N.Oc/BS: number of osteoclasts per bone surface. Oc.S/BS: osteoclast surface per bone surface. g Relative gene expression of Rankl, Opg, Rankl/Opg ratio and Rank in femora from female mice. F Females. M Males. Data are presented as the mean ± SEM. Statistical analysis was performed using Student t-test; *P < 0.05, **P < 0.01, ****P < 0.000 1. The exact P-value was reported on male column bars in a and b
Fig. 4
Fig. 4
Osteogenic activity of Adq-marrow stromal cells in situ and in heterotopic transplants. a Representative images of trabecular bone from 9-month-old Adq-mTmG and Adq-mTmG;GsαR201C mice showing GFP-marked osteoblasts (arrowhead) and osteocytes (hollow arrowhead). b Quantification of the fraction of GFP-labeled osteocytes and the GFP-labeled stromal cells area in Adq-mTmG and Adq-mTmG;GsαR201C mice at different ages. Statistical analysis performed using Two-way ANOVA followed by Sidak’s multiple comparison test. *P < 0.05, **P < 0.01, ****P < 0.000 1 for comparison between Adq-mTmG and Adq-mTmG;GsαR201C mice. ###P < 0.001, ####P < 0.000 1 for comparison of different ages in Adq-mTmG;GsαR201C mice. ††P < 0.01, for comparison of different ages in Adq-mTmG mice. The exact P-value was reported for the comparison between 3 and 9 months in Adq-mTmG mice. c Scheme of changes in the trabecular bone mass and GFP-labeled osteoblasts, osteocytes and stromal cells in Adq-mTmG and Adq-mTmG;GsαR201C mice. d Experimental design for the heterotopic transplantation of BMSCs in SCID/beige mice. e, f H&E-stained section of transplants made with BMSCs derived from Adq-mTmG (e) and Adq-mTmG;GsαR201C (f) mice, showing newly generated bone (b), bone marrow (bm) and adipocytes (ad). Carrier particles (cp) were easily recognized only in Adq-mTmG samples. Numerous ALP positive stromal cells were detected in transplants generated with cells from Adq-mTmG;GsαR201C mice. g Quantification of fraction of transplant area occupied by soft tissue, bone marrow, ceramic particles and bone. h, i Representative confocal images of the same transplants showing GFP labeling in the majority of osteoblasts (arrowhead) and osteocytes (hollow arrowhead), in adipocytes (ad) and in stromal cells (arrow)
Fig. 5
Fig. 5
Diaphyseal intramedullary bone formation in female Adq-GsαR201C mice. a Representative micro-computed tomography images of mice at different ages, showing the appearance and progression of the diaphyseal intramedullary bone. Transverse images were taken 2 mm above the tibia-fibular junction. b Transmitted and polarized (PL) light microscopy views of Sirius red stained sections of the tibial midshafts showing the appearance of the intramedullary bone in Adq-GsαR201C mice at 3 months of age and its subsequent expansion with obliteration of the medullary canal at older ages. PL shows the mixed woven and lamellar bone structure. c Von Kossa/Van Gieson stained MMA sections of undecalcified tibial midshafts showing mineralized intramedullary bone with a thin layer of osteoid rimmed with osteoblasts. d Representative images from confocal microscopy, showing medullary bone (mb) distributed around marrow blood vessels (bv) and its focal connection with cortical bone (cb, dotted line). GFP expression was observed in osteoblasts (arrowhead) and osteocytes (hollow arrowhead). 3D reconstruction was performed on a 50 μm-thick section using ImageJ software
Fig. 6
Fig. 6
Diaphyseal intramedullary bone formation is reproduced in Adq-GsαR201C male mice by 17β-estradiol (E2) treatment. a Experimental scheme of E2 treatment started at 5 months of age. b Radiographs of dissected tibiae and femora at the end of E2 treatment. Arrowheads indicate the increased density in the diaphyseal region of E2-treated bone segments from Adq-GsαR201C mice. c Representative longitudinal and transverse micro-CT images of Veh- and E2-treated mice, showing the diaphyseal intramedullary bone in E2-treated Adq-GsαR201C male mice. Transversal images were taken 2 mm above the tibia-fibular junction. d Sirius red stained sections of the tibial midshafts showing intramedullary bone in Adq-GsαR201C male mice after 6 weeks of E2 treatment. e Representative confocal images showing GFP-labeled intramedullary bone in E2-treated Adq-GsαR201C male mice. No bone is observed in Veh-treated mice. f Cluster of perivascular GFP-labeled stromal cells (asterisk) preceding the appearance of bone with GFP-labeled osteoblasts (arrowhead) and osteocytes (hollow arrowhead) in the marrow cavity of E2-treated Adq-GsαR201C mice. g Schematic representation of GFP-labeled medullary bone formation by Adq-GsαR201C marrow perivascular/stromal cells. mb Medullary bone, bm Bone marrow, cb Cortical bone, bv Blood vessel
Fig. 7
Fig. 7
Adq-marrow stromal cells from tail vertebrae are not osteogenic. a, Representative confocal microscopy images of bone trabeculae (bt) in the tail vertebrae of Adq-mTmG and Adq-mTmG;GsαR201C mice showing only Tomato positive osteoblasts (arrowhead) and osteocytes (hollow arrowhead). b GFP-labeled adherent cells in BMSC cultures isolated from tail vertebrae of 2-month-old mice. c Experimental design for the heterotopic transplantation of bone marrow stromal cells isolated from tail vertebrae. d, e Representative transmitted light microscopy images of Adq-mTmG and Adq-mTmG;GsαR201C transplants showing newly formed bone on the surfaces of carrier particles and inter-particle spaces occupied by bone marrow and adipocytes. f, g Representative confocal microscopy images of the same transplants showing GFP labeling in adipocytes (ad) and stromal cells (arrow) within the inter-particle spaces. Only Tomato positive osteoblasts (arrowhead) and osteocytes (hollow arrowhead) were found in these transplants. b Bone, cp Carrier particles
Fig. 8
Fig. 8
Adq-intraosseous pericytes associate with lytic lesions in cortical and trabecular bone in Adq-GsαR201C mice. a Radiographic analysis of dissected tail vertebrae from 9-month-old Rosa26 and Adq-GsαR201C mice showing several osteolytic lesions (arrowhead). b Representative Sirius red stained sections of tail vertebrae from 9-month-old mice. c H&E-stained sections showing dissecting and tunneling resorption in tail vertebrae. Note the massive presence of osteoclasts (black arrow). d Sirius red and TRAP-stained sections showing intracortical bone resorption in tail vertebrae. Resorption areas progressed over time and were enriched in osteoclasts (black arrow) in close association with blood vessels (bv). e Immunolocalization of ALP, OSX and RANKL in a tail vertebra lytic lesion of Adq-GsαR201C mice. f Representative confocal images from Adq-mTmG;GsαR201C mice tail vertebrae showing areas of osteolysis (dashed line) filled with GFP-positive perivascular cells (arrow) and stromal cells (asterisk). g Schematic representation of lytic lesions associated with intracortical Gsα-mutated Adq-pericytes. cb: cortical bone, bt: bone trabecula, bm: bone marrow, gp: growth plate

Similar articles

Cited by

References

    1. Weinstein LS, Yu S, Warner DR, Liu J. Endocrine manifestations of stimulatory G protein α-subunit mutations and the role of genomic imprinting. Endocr. Rev. 2001;22:675–705. - PubMed
    1. Donsante S, et al. From stem cells to bone-forming cells. Int. J. Mol. Sci. 2021;22:3989. doi: 10.3390/ijms22083989. - DOI - PMC - PubMed
    1. Sakamoto A, et al. Deficiency of the G-protein α-Subunit Gsα in osteoblasts leads to differential effects on trabecular and cortical bone. J. Biol. Chem. 2005;280:21369–21375. doi: 10.1074/jbc.M500346200. - DOI - PubMed
    1. Cong Q, Xu R, Yang Y. Gαs signaling in skeletal development, homeostasis and diseases. in. Curr. Top. Dev. Biol. 2019;133:281–307. doi: 10.1016/bs.ctdb.2018.11.019. - DOI - PubMed
    1. Weinstein LS, et al. Activating mutations of the stimulatory G protein in the McCune–Albright syndrome. N. Engl. J. Med. 1991;325:1688–1695. doi: 10.1056/NEJM199112123252403. - DOI - PubMed