. 2022 Jul 19;13(1):3912.
doi: 10.1038/s41467-022-31508-9.

Genomic insights into the secondary aquatic transition of penguins

Affiliations

Genomic insights into the secondary aquatic transition of penguins

Theresa L Cole et al. Nat Commun. .

Abstract

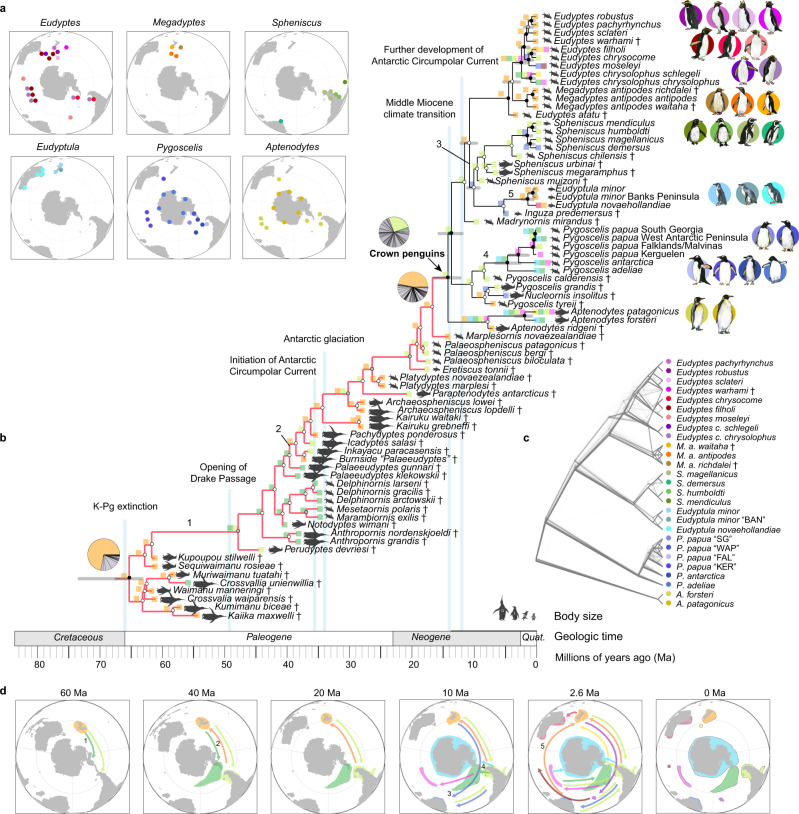
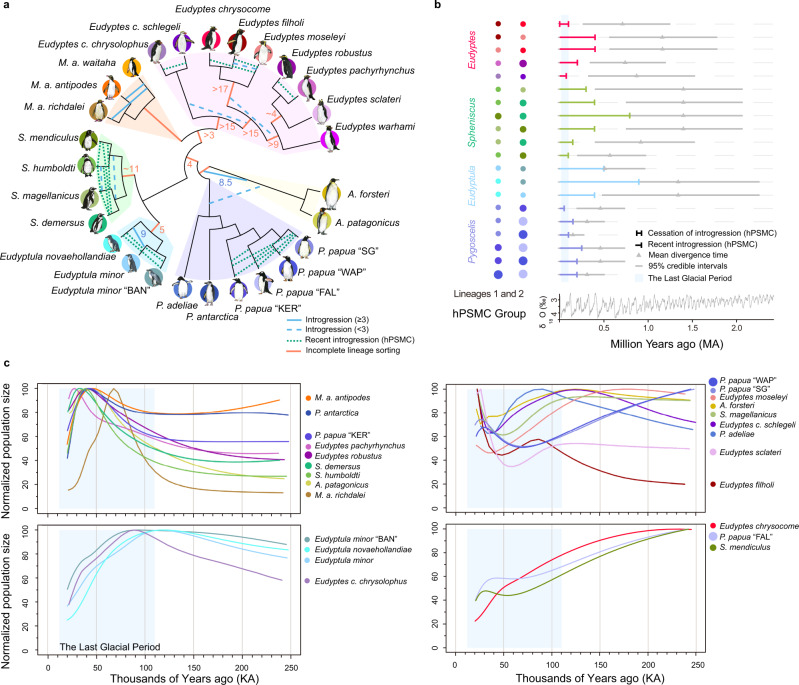
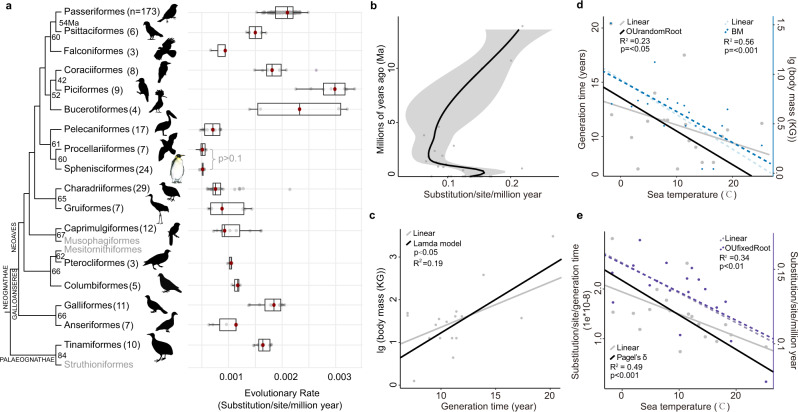
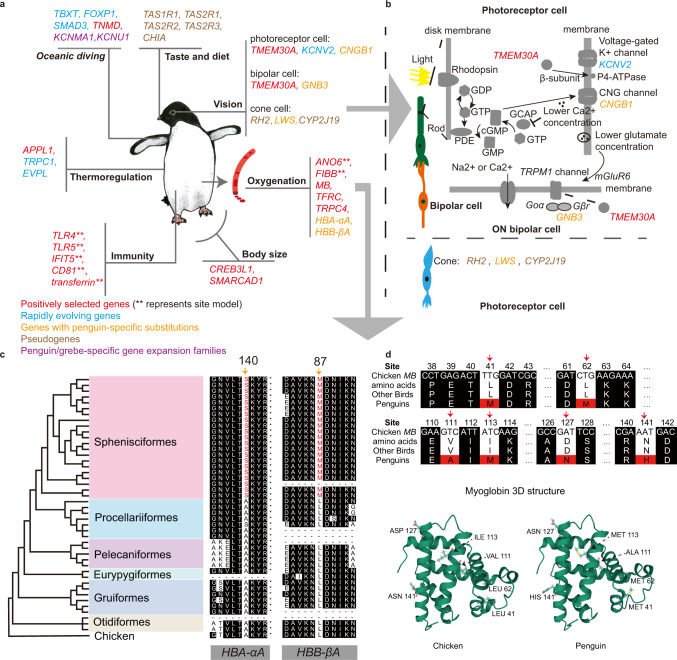
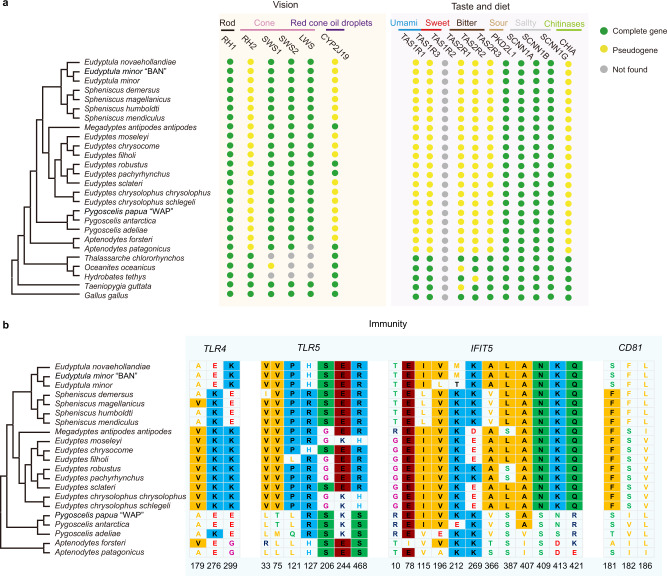
Penguins lost the ability to fly more than 60 million years ago, subsequently evolving a hyper-specialized marine body plan. Within the framework of a genome-scale, fossil-inclusive phylogeny, we identify key geological events that shaped penguin diversification and genomic signatures consistent with widespread refugia/recolonization during major climate oscillations. We further identify a suite of genes potentially underpinning adaptations related to thermoregulation, oxygenation, diving, vision, diet, immunity and body size, which might have facilitated their remarkable secondary transition to an aquatic ecology. Our analyses indicate that penguins and their sister group (Procellariiformes) have the lowest evolutionary rates yet detected in birds. Together, these findings help improve our understanding of how penguins have transitioned to the marine environment, successfully colonizing some of the most extreme environments on Earth.


Conflict of interest statement

The authors declare no competing interests.

Figures

Fig. 1
Fig. 1. Phylogeny and biogeography of penguins.
a Breeding range of extant/recently-extinct penguins. Colors of circles correspond to species identities shown in subplot b, c. Note, Eudyptula novaehollandiae and Megadyptes antipodes antipodes colonized New Zealand <800 years ago, so those expanded ranges are not shown. b Total-evidence maximum clade credibility tree incorporating ancestral range estimation from BioGeoBEARS under the best-fitting model (DEC+J+X). † indicates extinct taxa. Silhouettes in cladogram indicate approximate body size. The gray rectangles at the nodes among extant penguins represent 95% confidence intervals of the corresponding estimated divergence times. Circles at the nodes are colored to indicate posterior probability: black (>0.95), gray (0.75–0.95), white (<0.75). The single most probable ancestral range is indicated at each node using squares (colors represent the ranges in d) with the exception of three key nodes (pie charts, gray represents multiple ranges). Nodes are marked with a number corresponding to potential dispersal events. Major geological events are indicated. c Densitree of 500 random RAxML gene trees, summarizing gene discordance. d Paleomaps showing major inferred dispersal vectors for penguins across the Cenozoic. Arrows show one possible biogeographic scenario interpreted from the ancestral area reconstructions. Numbers correspond to numbered nodes in b. Source data is provided as a Source Data file.
Fig. 2
Fig. 2. Incomplete lineage sorting, introgression events, and demographic history among penguins.
a Model of incomplete lineage sorting (ILS) and introgression events estimated from QuIBL and hybrid pairwise sequentially Markovian coalescent (hPSMC) results. hPSMC was only run for 20 species pairs (see b). Numbers on branches represent the proportion (%) of ILS (orange branches) or introgression (blue lines, blue dashed lines, and blue dotted lines) detected by QuIBL. Proportions <3% were marked with blue dashed lines. Aqua dotted lines represent the ongoing gene flow detected by hPSMC. b Estimated divergence times and time intervals during which gene flow ceased between closely related lineages (see Supplementary Data 2 for details). Each circle represents one species in plot a. Gray lines represent the 95% credible intervals for the divergence times from the Bayesian total-evidence dating tree. Composite oxygen stable isotope (δ18O) data were modified from to show the climate fluctuations. c Normalized inferred population size (as a percentage of the maximum population size for each species between 20 and 250 Kya) trends for four groups of species showing similar patterns during the LGP based on PSMC results (full PSMC results shown in Supplementary Fig. 11). WAP = West Antarctic Peninsula, SG = South Georgia, KER = Kerguelen, FAL = Falkland/Malvinas and BAN = Banks Peninsula. Source data is provided as a Source Data file.
Fig. 3
Fig. 3. Evolutionary rates in birds.
a Evolutionary rate in avian orders based on a ~19 Mbp alignment of highly conserved genome regions. Sphenisciformes and Procellariiformes have the lowest evolutionary rate among modern bird orders (One-sided Wilcoxon Rank sum test, P values < 0.05 for all pairs except for Sphenisciformes and Procellariiformes (P-values > 0.1)). Numbers at the tips represent the sample size in each group. Numbers at nodes represent the divergence times (Ma) between each order and its sister taxon and red dots within the boxplots indicate average values. We did not attempt to estimate the evolutionary rates for orders containing less than three sampled species (gray font; Musophagiformes, Mesitornithiformes, and Struthioniformes). Boxplots show the median with hinges at the 25th and 75th percentile and whiskers extending 1.5 times the interquartile range. Some bird images were downloaded from phylopic.org and were licensed under the Creative Commons (CC0) 1.0 Universal Public Domain Dedication. b Evolutionary rates inferred for extant penguin lineages at internal nodes from the maximum clade credibility tree, calculated using a 500 Mbp genome alignment. Gray shadows represent the 95% credible intervals. ce Correlations between c, body mass and generation time (P value < 0.05), d generation time (gray dots, solid lines, P value < 0.001) or body mass (blue dots, dashed lines P value < 0.05) and average sea surface temperature, e substitution per site per generation time (gray dots, solid lines, P value < 0.001) or substitution per site per million years (purple dots, dashed lines P value < 0.01) and body mass among 18 penguins, estimated using phylogenetic correlation - Phylogenetic Generalized Least Squares Regression with the best-fitting model identified by Akaike Information Criterion. Correlations with linear models were shown with black lines. Source data is provided as a Source Data file.
Fig. 4
Fig. 4. Adaptive genes in extant penguin lineages.
a Genes with unique evolutionary signals in penguins and their putative adaptive function. b Gene regulatory pathways related to light transmission. c Phylogenetic tree of 45 avian species showing two mutation sites (HBA-αA, A140S, and HBB-βA, L87M) of hemoglobin genes in penguins (marked in red) and outgroups. d Positive selection at multiple sites (41, 62, 111, 113, 127, 141) on the bLCA of extant penguins for MB gene and the structural effects of amino acid substitutions in the chicken MB gene. Molecular models of the chicken MB gene and the MB gene with penguin-specific substitutions may affect the stabilization of MB. Source data is provided as a Source Data file.
Fig. 5
Fig. 5. Pseudogenes and site alignments for vision, taste, diet, and immunity genes.
a Presence/absence of vision, taste, and dietary genes in penguins. Phylogenetic tree of penguins and select outgroups indicate which species have complete or pseudogenes, related to vision (opsins; RH1, RH2, SWS1, SWS2, LWS, and CYP2J19), taste (umami; TAS1R1, TAS1R3, sweet; TAS1R2, bitter; TAS2R1, TAS2R2, TAS2R3, sour; PKD211, salty; SCNN1A, SCNN1B, SCNN1G) and diet (chitinase; CHIA). “Not found” indicates genes that could not be assembled. b Phylogenetic tree of penguins showing alignments of positively selected sites for four genes related to immunity (TLR4, TLR5, IFIT5, and CD81). Sites are shown below the alignment. The background colors are displayed for sites that have 50% conservation. Source data is provided as a Source Data file.

Similar articles

  • High-coverage genomes to elucidate the evolution of penguins.
    Pan H, Cole TL, Bi X, Fang M, Zhou C, Yang Z, Ksepka DT, Hart T, Bouzat JL, Argilla LS, Bertelsen MF, Boersma PD, Bost CA, Cherel Y, Dann P, Fiddaman SR, Howard P, Labuschagne K, Mattern T, Miller G, Parker P, Phillips RA, Quillfeldt P, Ryan PG, Taylor H, Thompson DR, Young MJ, Ellegaard MR, Gilbert MTP, Sinding MS, Pacheco G, Shepherd LD, Tennyson AJD, Grosser S, Kay E, Nupen LJ, Ellenberg U, Houston DM, Reeve AH, Johnson K, Masello JF, Stracke T, McKinlay B, Borboroglu PG, Zhang DX, Zhang G. Pan H, et al. Gigascience. 2019 Sep 1;8(9):giz117. doi: 10.1093/gigascience/giz117. Gigascience. 2019. PMID: 31531675 Free PMC article.
  • Evidence for a recent origin of penguins.
    Subramanian S, Beans-Picón G, Swaminathan SK, Millar CD, Lambert DM. Subramanian S, et al. Biol Lett. 2013 Nov 13;9(6):20130748. doi: 10.1098/rsbl.2013.0748. Print 2013. Biol Lett. 2013. PMID: 24227045 Free PMC article.
  • Genome-wide analyses reveal drivers of penguin diversification.
    Vianna JA, Fernandes FAN, Frugone MJ, Figueiró HV, Pertierra LR, Noll D, Bi K, Wang-Claypool CY, Lowther A, Parker P, Le Bohec C, Bonadonna F, Wienecke B, Pistorius P, Steinfurth A, Burridge CP, Dantas GPM, Poulin E, Simison WB, Henderson J, Eizirik E, Nery MF, Bowie RCK. Vianna JA, et al. Proc Natl Acad Sci U S A. 2020 Sep 8;117(36):22303-22310. doi: 10.1073/pnas.2006659117. Epub 2020 Aug 17. Proc Natl Acad Sci U S A. 2020. PMID: 32817535 Free PMC article.
  • Ancient population genomics and the study of evolution.
    Parks M, Subramanian S, Baroni C, Salvatore MC, Zhang G, Millar CD, Lambert DM. Parks M, et al. Philos Trans R Soc Lond B Biol Sci. 2015 Jan 19;370(1660):20130381. doi: 10.1098/rstb.2013.0381. Philos Trans R Soc Lond B Biol Sci. 2015. PMID: 25487332 Free PMC article. Review.
  • Adélie penguins and temperature changes in Antarctica: a long-term view.
    Millar CD, Subramanian S, Heupink TH, Swaminathan S, Baroni C, Lambert DM. Millar CD, et al. Integr Zool. 2012 Jun;7(2):113-20. doi: 10.1111/j.1749-4877.2012.00288.x. Integr Zool. 2012. PMID: 22691195 Review.

Cited by

References

    1. Boersma PD. Penguins as marine sentinels. BioScience. 2008;58:597–607. doi: 10.1641/B580707. - DOI
    1. Slack KE, et al. Early penguin fossils, plus mitochondrial genomes, calibrate avian evolution. Mol. Biol. Evol. 2006;23:1144–1155. doi: 10.1093/molbev/msj124. - DOI - PubMed
    1. Ksepka DT, Bertelli S, Giannini NP. The phylogeny of the living and fossil Sphenisciformes (penguins) Cladistics. 2006;22:412–441. doi: 10.1111/j.1096-0031.2006.00116.x. - DOI
    1. Gavryushkina A, et al. Bayesian total-evidence dating reveals the recent crown radiation of penguins. Syst. Biol. 2017;66:57–73. - PMC - PubMed
    1. Cole TL, et al. Mitogenomes uncover extinct penguin taxa and reveal island formation as a key driver of speciation. Mol. Biol. Evol. 2019;36:784–797. doi: 10.1093/molbev/msz017. - DOI - PubMed

Publication types