. 2022 Jul 19;13(1):4060.
doi: 10.1038/s41467-022-31787-2.

α-Synuclein fibril-specific nanobody reduces prion-like α-synuclein spreading in mice

Affiliations

α-Synuclein fibril-specific nanobody reduces prion-like α-synuclein spreading in mice

Yemima R Butler et al. Nat Commun. .

Abstract

Pathogenic α-synuclein (α-syn) is a prion-like protein that drives the pathogenesis of Lewy Body Dementia (LBD) and Parkinson's Disease (PD). To target pathogenic α-syn preformed fibrils (PFF), here we designed extracellular disulfide bond-free synthetic nanobody libraries in yeast. Following selection, we identified a nanobody, PFFNB2, that can specifically recognize α-syn PFF over α-syn monomers. PFFNB2 cannot inhibit the aggregation of α-syn monomer, but can significantly dissociate α-syn fibrils. Furthermore, adeno-associated virus (AAV)-encoding EGFP fused to PFFNB2 (AAV-EGFP-PFFNB2) can inhibit PFF-induced α-syn serine 129 phosphorylation (pS129) in mouse primary cortical neurons, and prevent α-syn pathology spreading to the cortex in the transgenic mice expressing human wild type (WT) α-syn by intrastriatal-PFF injection. The pS129 immunoreactivity is negatively correlated with the expression of AAV-EGFP-PFFNB2. In conclusion, PFFNB2 holds a promise for mechanistic exploration and therapeutic development in α-syn-related pathogenesis.


Conflict of interest statement

The authors declare the following competing interests: patent application filed by W.W., X.M., Y.B., Y.L., and R.K. with title ‘Compositions and methods for treating alpha-synucleinopathies.’ U.S. Provisional Patent Application No. 63/222,141, filed Jul 15, 2021. Applicants: The Regents of the University of Michigan and The Johns Hopkins University. Patent pending. Some aspects of this paper is included in the patent such as disulfide-bond free PFFNB, AAV delivery of PFFNB2 to treat Parkinson’s Disease. All other authors declare no competing interests.

Figures

Fig. 1
Fig. 1. Nanobody selection against α-syn PFF.
a Nanobody crystal structure (based on PDB: 4LDE). Conserved disulfide bond (orange) was removed in our libraries. b Nanobody selection schematics. Nanobodies were expressed on the yeast surface by fusion to the C-terminus of Aga2p protein, followed by the FLAG tag. Yeast cells that bind to α-syn PFF were selected using MACS and FACS. Red trapezoid, a representative selection gate. c FACS analysis of nanobody libraries before and after selection. After 6 rounds of selection, the selected nanobodies showed a higher PFF-binding signal, compared to the original libraries and negative control (without α-syn PFF). The numbers in the upper right Q2 indicate the yeast population ratio of Q2/Q4.
Fig. 2
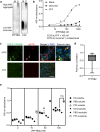
Fig. 2. In vitro characterization of PFFNB2 binding to α-syn PFF and aggregates.
a Native-PAGE immunoblot of human α-syn monomers and PFF with PFFNB2 and anti-α-syn monoclonal antibody (mAb). PFFNB2 binds selectively to the high molecular weight (MW) α-syn but not to the low MW α-syn. Anti-α-syn mAb binds to both the high and low MW α-syn forms. M, α-syn monomers. P, α-syn PFF. mAb, anti-α-syn monoclonal antibody. The experiment was replicated three times with similar results. b ELISA result of PFFNB2 binding to α-syn PFF, monomers, and control (blank). Wells were coated with 3 ng/μl of α-syn PFF or monomers, and then titrated with 3.3, 33.3, 66.7, 133.3, 266.7, 666.7, and, 1333.3 nM of PFFNB2. Three data points were collected for each concentration and shown as mean ± SEM. The experiment was replicated once with similar result. c AAV-transduced EGFP-PFFNB2 (green) signal co-localized with the immunostaining of anti-pS129 in HEK293T cells stably expressing α-syn(A53T) induced by α-syn PFF. Green, EGFP-PFFNB2 signal. Red, anti-pS129 immunofluorescence signal. White arrows indicated the co-localization between EGFP-PFFNB2 and pS129 α-syn. Scale bar, 40 μm. d Quantification of co-localization between pS129 α-syn signal to PFFNB2 using Pearson correlation. Data were analyzed from 103 puncta. The box ranges from the first to the third quartile of the distribution with median indicated as line across the box. The whiskers are the minimum and maxima of the data. e ELISA analysis of PFFNB2 binding to mouse brain lysate. KO, Snca knock-out mouse; PBS, transgenic mouse expressing human α-syn with striatal-PBS injection; PFF, transgenic mouse expressing human α-syn with striatal-PFF injection. Wells were coated with 3 ng/μl of each brain lysate, and then detected with 2, 15, 50, 100 nM of PFFNB2. Two data points were collected for each concentration. The experiment was replicated once with similar result. Source data are provided as a Source Data file.
Fig. 3
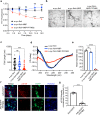
Fig. 3. PFFNB2 dissociates α-syn fibrils and inhibits α-syn pathology induced by PFF in vitro.
a Disaggregation of α-syn fibrils monitored by ThT fluorescence assay. α-syn PFF was incubated alone (black), with MBP-PFFNB2 (red), or with MBP (blue). Quantification data are the means ± SEM, n = 3 independent experimental replicates, two-way ANOVA with Tukey correction. (α-syn fibrils vs. α-syn fibrils + MBP-PFFNB2, P values are Day5 = 0.0388, Day8 = 0.0199, Day12 = 0.0005, Day15 = 0.0001) *P < 0.05, **P < 0.01, ***P < 0.001, ns, not significant. b TEM images of α-syn fibrils with MBP-PFFNB2 or MBP. Scale bar, 100 nm. c Quantification of fibril length from (b). Quantification data are the means ± SEM, n = 50 datapoints per group, one-way ANOVA with Tukey correction. (α-syn fibrils vs. α-syn fibrils+MBP-PFFNB2, P = 0.0001) ***P < 0.001, ns, not significant (d) Circular dichroism (CD) spectra for α-syn PFF with MBP-PFFNB2 or MBP. e Dynamic light scattering (DLS) analysis for α-syn fibrils with MBP-PFFNB2 or MBP. Quantification data are the means ± SEM, n = 3 independent experiments, P values were determined by one-way ANOVA with Tukey correction. (α-syn fibrils vs. α-syn fibrils+MBP-PFFNB2, P = 0.0001). ****P < 0.0001, ns, not significant. f WT mouse primary cortical neurons were transduced with AAV encoding EGFP (control group) or EGFP-PFFNB2 (PFFNB2 group) at day 5 in vitro and α-syn PFF at day 7 in vitro. The α-syn pathology level was assessed with anti-phosphorylated serine129 (pS129) immunostaining 7 days after α-syn PFF treatment. Scale bar, 50 μm. g Quantification of the pS129 immunoreactivity normalized by Hoechst. Quantification data are the means ± SEM, n = 6 independent experiments, P values were determined by two-sided Student’s t test. (AAV-EGFP vs. AAV-EGFP-PFFNB2 P = 0.0001). ****P < 0.0001. Source data are provided as a Source Data file.
Fig. 4
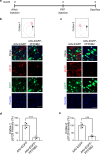
Fig. 4. AAV-EGFP-PFFNB2 reduces α-syn pathology induced by PFF in vivo.
a Timeline of in vivo experiments. Intraventricular injection of AAV was performed in neonatal mouse brains. These mice were then stereotactically injected with α-syn PFF at 2-months old, and then sacrificed 1 month after α-syn PFF injection. b, c Immunostaining of pS129 (red) normalized by Hoechst (blue). The green signal indicates the expression level of EGFP or EGFP-PFFNB2 fusion protein in the cortex. Scale bars, 50 μm. d, e Quantification of pS129 immunostaining in the cortex. Data are the means ± SEM, n = 4 mice per group, P values were determined by two-sided Student’s t test. (AAV-EGFP vs. AAV-EGFP-PFFNB2, P = 0.0004). ***P < 0.001. Source data are provided as a Source Data file.
Fig. 5
Fig. 5. Lower magnification of striatal-PFF injected mice brain section with AAV-EGFP and AAV-EGFP-PFFNB2 transduction.
Both EGFP and EGFP-PFFNB2 expression (green) were mainly expressed in the motor cortex and somatosensory cortical regions. a Schematics representing the PFF injection site (yellow box) and site of analyses (red box) (b) The ×4 magnification images of the motor cortical region (top panel) and marked regions R1, R2, and R3 (white boxes) are shown in the bottom panel. Scale bars, 100 μm. c The ×4 magnification images of the somatosensory cortical region (top panel) and marked area (white box) is shown in the bottom panel. All experiments were replicated in three mice per group with similar results. Scale bars, 100 μm. d Correlation between EGFP intensity to pS129 intensity plot in the AAV-EGFP and AAV-EGFP-PFFNB2 groups. Areas with low to high degrees of EGFP expression were selected for quantification. There is a negative correlation between EGFP intensity and pS129 intensity in the AAV-EGFP-PFFNB2 group, with the Pearson correlation coefficient r = −0.8490. There is no correlation between EGFP and pS129 in the AAV-EGFP group with r = 0.3414. Source data are provided as a Source Data file.

References

    1. Baba M, et al. Aggregation of alpha-synuclein in Lewy bodies of sporadic Parkinson’s disease and dementia with Lewy bodies. Am. J. Pathol. 1998;152:879–884. - PMC - PubMed
    1. Dodel R, et al. Lewy body dementia and Parkinson’s disease with dementia. J. Neurol. 2008;255:39–47. doi: 10.1007/s00415-008-5007-0. - DOI - PubMed
    1. Arnaoutoglou NA, O’Brien JT, Underwood BR. Dementia with Lewy bodies — from scientific knowledge to clinical insights. Nat. Rev. Neurol. 2019;15:103–112. doi: 10.1038/s41582-018-0107-7. - DOI - PubMed
    1. Olichney JM, et al. Cognitive decline is faster in Lewy body variant than in Alzheimer’s disease. Neurology. 1998;51:351–357. doi: 10.1212/WNL.51.2.351. - DOI - PubMed
    1. Braak H, Braak E. Pathoanatomy of Parkinson’s disease. J. Neurol. 2000;247:II3–II10. doi: 10.1007/PL00007758. - DOI - PubMed

Publication types