

A model for network-based identification and pharmacological targeting of aberrant, replication-permissive transcriptional programs induced by viral infection
- PMID: 35854100
- PMCID: PMC9296638
- DOI: 10.1038/s42003-022-03663-8
A model for network-based identification and pharmacological targeting of aberrant, replication-permissive transcriptional programs induced by viral infection
Abstract
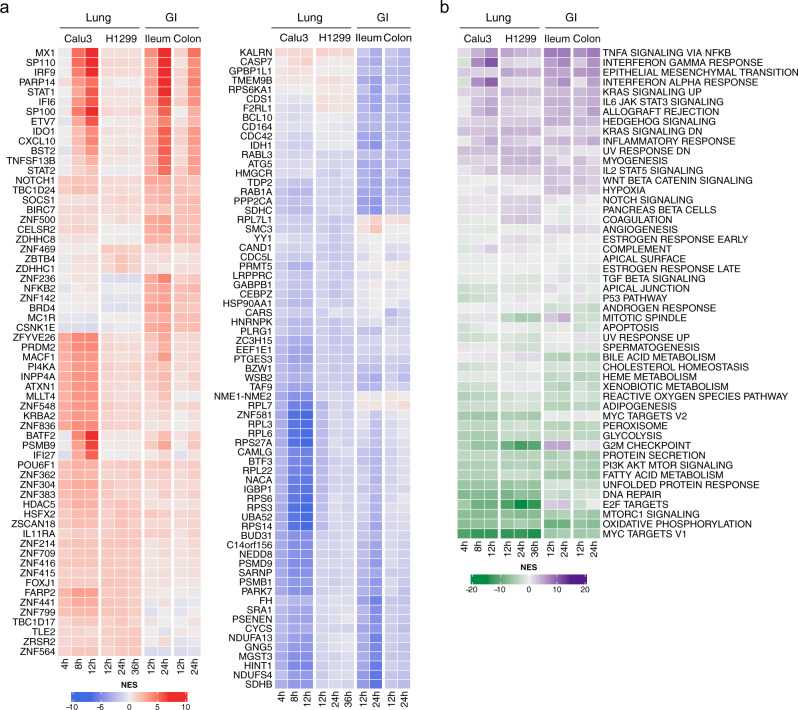
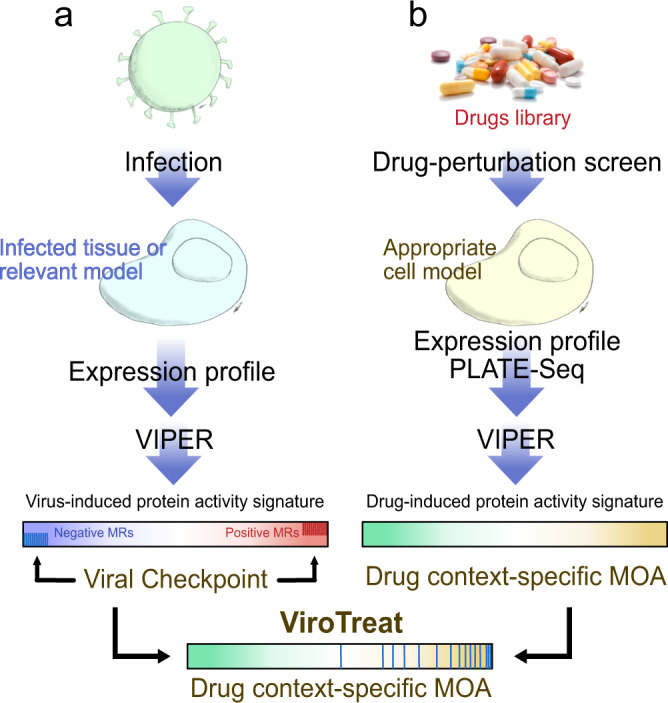
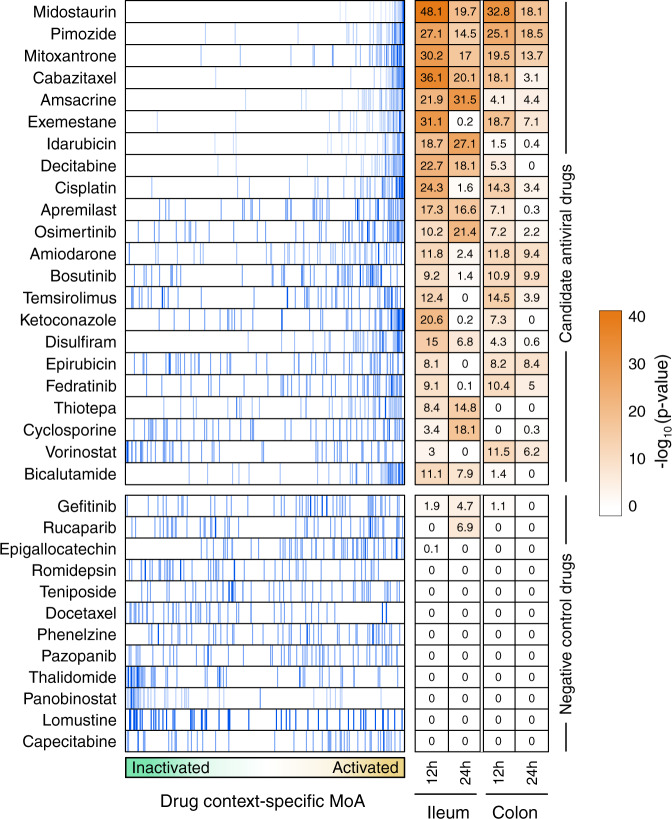
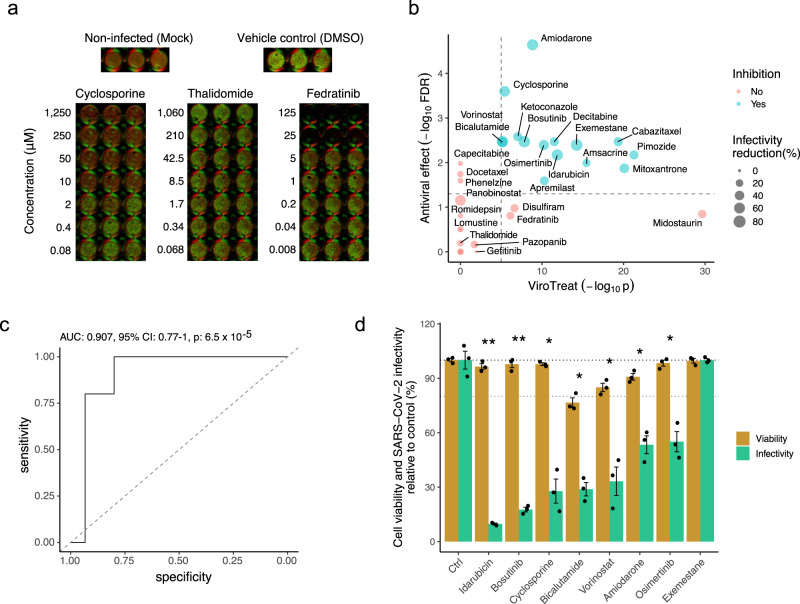
SARS-CoV-2 hijacks the host cell transcriptional machinery to induce a phenotypic state amenable to its replication. Here we show that analysis of Master Regulator proteins representing mechanistic determinants of the gene expression signature induced by SARS-CoV-2 in infected cells revealed coordinated inactivation of Master Regulators enriched in physical interactions with SARS-CoV-2 proteins, suggesting their mechanistic role in maintaining a host cell state refractory to virus replication. To test their functional relevance, we measured SARS-CoV-2 replication in epithelial cells treated with drugs predicted to activate the entire repertoire of repressed Master Regulators, based on their experimentally elucidated, context-specific mechanism of action. Overall, 15 of the 18 drugs predicted to be effective by this methodology induced significant reduction of SARS-CoV-2 replication, without affecting cell viability. This model for host-directed pharmacological therapy is fully generalizable and can be deployed to identify drugs targeting host cell-based Master Regulator signatures induced by virtually any pathogen.
© 2022. The Author(s).
Conflict of interest statement
The authors declare the following competing interests: P.L. is Director of Single-Cell Systems Biology at DarwinHealth, Inc., a company that has licensed some of the algorithms used in this manuscript from Columbia University. G.B. is founder, CEO and equity holder of DarwinHealth, Inc. X.S. is Senior Computational Biologist at DarwinHealth, Inc. A.C. is founder, equity holder, and consultant of DarwinHealth Inc. M.J.A. is CSO and equity holder of DarwinHealth, Inc. Columbia University is also an equity holder in DarwinHealth Inc. The remaining authors declare no competing interests.
Figures
Update of
-
A Model for Network-Based Identification and Pharmacological Targeting of Aberrant, Replication-Permissive Transcriptional Programs Induced by Viral Infection.Res Sq [Preprint]. 2022 Feb 4:rs.3.rs-1287631. doi: 10.21203/rs.3.rs-1287631/v1. Res Sq. 2022. Update in: Commun Biol. 2022 Jul 19;5(1):714. doi: 10.1038/s42003-022-03663-8. PMID: 35132404 Free PMC article. Updated. Preprint.
Similar articles
-
A Model for Network-Based Identification and Pharmacological Targeting of Aberrant, Replication-Permissive Transcriptional Programs Induced by Viral Infection.Res Sq [Preprint]. 2022 Feb 4:rs.3.rs-1287631. doi: 10.21203/rs.3.rs-1287631/v1. Res Sq. 2022. Update in: Commun Biol. 2022 Jul 19;5(1):714. doi: 10.1038/s42003-022-03663-8. PMID: 35132404 Free PMC article. Updated. Preprint.
-
The Host Cell ViroCheckpoint: Identification and Pharmacologic Targeting of Novel Mechanistic Determinants of Coronavirus-Mediated Hijacked Cell States.bioRxiv [Preprint]. 2020 May 17:2020.05.12.091256. doi: 10.1101/2020.05.12.091256. bioRxiv. 2020. PMID: 32511361 Free PMC article. Preprint.
-
Differential interferon-α subtype induced immune signatures are associated with suppression of SARS-CoV-2 infection.Proc Natl Acad Sci U S A. 2022 Feb 22;119(8):e2111600119. doi: 10.1073/pnas.2111600119. Proc Natl Acad Sci U S A. 2022. PMID: 35131898 Free PMC article.
-
B-cell lymphoma-2 family proteins-activated proteases as potential therapeutic targets for influenza A virus and severe acute respiratory syndrome coronavirus-2: Killing two birds with one stone?Rev Med Virol. 2023 Mar;33(2):e2411. doi: 10.1002/rmv.2411. Epub 2022 Nov 30. Rev Med Virol. 2023. PMID: 36451345 Free PMC article. Review.
-
Targeting Virus-Induced Reprogrammed Cell Metabolism via Glycolytic Inhibitors: An Effective Therapeutic Approach Against SARS-CoV-2.Mini Rev Med Chem. 2023;23(2):120-130. doi: 10.2174/1389557522666220616112042. Mini Rev Med Chem. 2023. PMID: 35713132 Review.
Cited by
-
Identification and Targeting of Regulators of SARS-CoV-2-Host Interactions in the Airway Epithelium.bioRxiv [Preprint]. 2024 Dec 9:2024.10.11.617898. doi: 10.1101/2024.10.11.617898. bioRxiv. 2024. Update in: Sci Adv. 2025 May 16;11(20):eadu2079. doi: 10.1126/sciadv.adu2079. PMID: 39464067 Free PMC article. Updated. Preprint.
-
Identification and targeting of regulators of SARS-CoV-2-host interactions in the airway epithelium.Sci Adv. 2025 May 16;11(20):eadu2079. doi: 10.1126/sciadv.adu2079. Epub 2025 May 16. Sci Adv. 2025. PMID: 40378209 Free PMC article.
References
Publication types
MeSH terms
Grants and funding
LinkOut - more resources
Full Text Sources
Medical
Miscellaneous
