. 2022 Jul 19;5(1):101.
doi: 10.1038/s41746-022-00650-5.

Effectiveness of automated alerting system compared to usual care for the management of sepsis

Affiliations

Effectiveness of automated alerting system compared to usual care for the management of sepsis

Zhongheng Zhang et al. NPJ Digit Med. .

Abstract

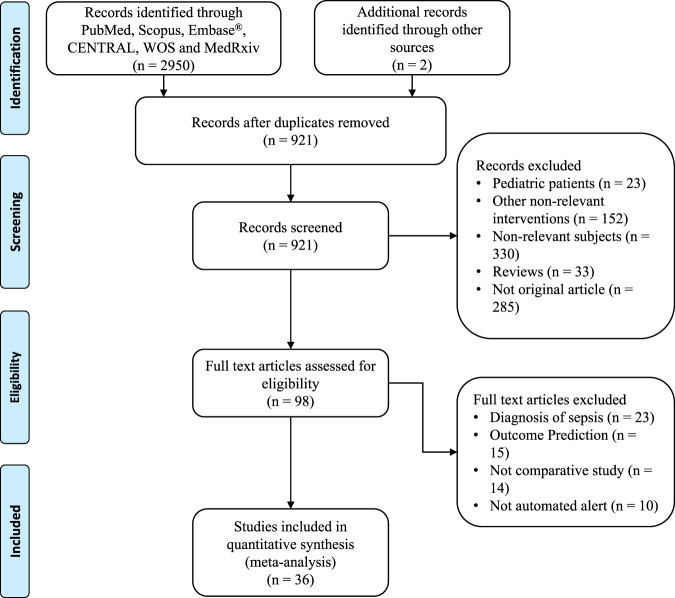
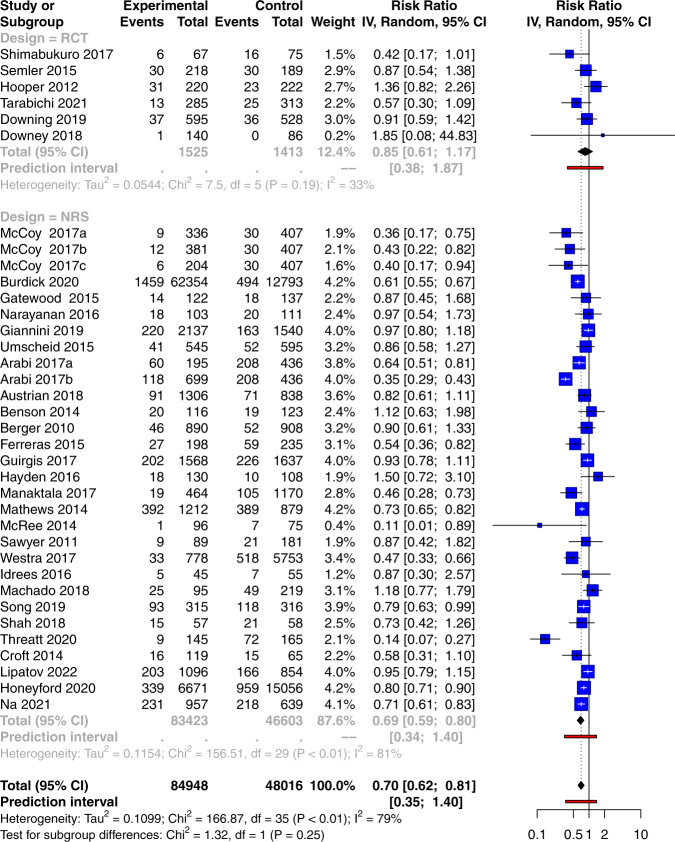
There is a large body of evidence showing that delayed initiation of sepsis bundle is associated with adverse clinical outcomes in patients with sepsis. However, it is controversial whether electronic automated alerts can help improve clinical outcomes of sepsis. Electronic databases are searched from inception to December 2021 for comparative effectiveness studies comparing automated alerts versus usual care for the management of sepsis. A total of 36 studies are eligible for analysis, including 6 randomized controlled trials and 30 non-randomized studies. There is significant heterogeneity in these studies concerning the study setting, design, and alerting methods. The Bayesian meta-analysis by using pooled effects of non-randomized studies as priors shows a beneficial effect of the alerting system (relative risk [RR]: 0.71; 95% credible interval: 0.62 to 0.81) in reducing mortality. The automated alerting system shows less beneficial effects in the intensive care unit (RR: 0.90; 95% CI: 0.73-1.11) than that in the emergency department (RR: 0.68; 95% CI: 0.51-0.90) and ward (RR: 0.71; 95% CI: 0.61-0.82). Furthermore, machine learning-based prediction methods can reduce mortality by a larger magnitude (RR: 0.56; 95% CI: 0.39-0.80) than rule-based methods (RR: 0.73; 95% CI: 0.63-0.85). The study shows a statistically significant beneficial effect of using the automated alerting system in the management of sepsis. Interestingly, machine learning monitoring systems coupled with better early interventions show promise, especially for patients outside of the intensive care unit.


Conflict of interest statement

The authors declare no competing interests.

Figures

Fig. 1
Fig. 1. Flowchart of study selection.
WOS web of science, CENTRAL Cochrane Central Register of Controlled Trials.
Fig. 2
Fig. 2. Risk of bias assessment for randomized controlled trials.
a Summary statistics for the risk of bias assessment for RCT. b Risk of bias assessment for each RCT. RCT randomized controlled trial.
Fig. 3
Fig. 3. Risk of bias assessment for each of the non-randomized studies.
The rows represent the individual study and the columns represent the quality items as annotated at the bottom.
Fig. 4
Fig. 4. Summary of the risk of bias assessment for non-randomized studies.
The bars show the percentage of studies with different levels of quality as indicated by colors.
Fig. 5
Fig. 5. Forest plot for pooled effects of the automated alerting system in mortality outcome.
The size of the blue square indicates the weight of each study. The black diamond represents the pooled effect size for each subgroup as well as for the overall effect. The red bars represent the prediction interval. IV inverse variance, RCT randomized controlled trial, CI confidence interval.
Fig. 6
Fig. 6. Assessment of publication bias.
a Visual inspection of the p-curve plot shows a right-skewed distribution with 73% of the p-values between 0 and 0.01 and only 20% of p-values between 0.03 and 0.05. The statistical tests against the null hypothesis that all of the significant p-values are false positives are highly significant. Thus, at least some of the p-values are likely to be true positives. Finally, the power estimate is very high, 99%, with a tight confidence interval ranging from 96% to 99%. Somewhat redundant with this information, the p-curve also provides a significant test for the hypothesis that power is less than 33%. This test is not significant, which is not surprising given the estimated power of 99%. The contour-enhanced funnel plots showed significant levels area at 0.1, 0.05, and 0.01 for b mortality, c ICU length of stay, and d hospital length of stay. Some studies appeared to be missing in areas of high statistical significance, thus it is possible that the asymmetry is not due to publication bias. ICU intensive care unit.

Similar articles

Cited by

References

    1. Herrán-Monge R, et al. Epidemiology and changes in mortality of sepsis after the implementation of surviving sepsis campaign guidelines. J. Intensive Care Med. 2019;34:740–750. doi: 10.1177/0885066617711882. - DOI - PubMed
    1. Yu Y, et al. Effectiveness of anisodamine for the treatment of critically ill patients with septic shock: a multicentre randomized controlled trial. Crit. Care. 2021;25:349. doi: 10.1186/s13054-021-03774-4. - DOI - PMC - PubMed
    1. Han X, et al. Identifying high-risk subphenotypes and associated harms from delayed antibiotic orders and delivery. Crit. Care Med. 2021;49:1694–1705. doi: 10.1097/CCM.0000000000005054. - DOI - PMC - PubMed
    1. Seymour CW, et al. Delays from first medical contact to antibiotic administration for sepsis. Crit. Care Med. 2017;45:759–765. doi: 10.1097/CCM.0000000000002264. - DOI - PMC - PubMed
    1. Ma P, et al. Individualized resuscitation strategy for septic shock formalized by finite mixture modeling and dynamic treatment regimen. Crit. Care. 2021;25:243. doi: 10.1186/s13054-021-03682-7. - DOI - PMC - PubMed