. 2022 Jul 19;17(1):286.
doi: 10.1186/s13023-022-02415-5.

Genotype-phenotype correlations and disease mechanisms in PEX13-related Zellweger spectrum disorders

Affiliations

Genotype-phenotype correlations and disease mechanisms in PEX13-related Zellweger spectrum disorders

Paola Borgia et al. Orphanet J Rare Dis. .

Abstract

Background: Pathogenic variants in PEX-genes can affect peroxisome assembly and function and cause Zellweger spectrum disorders (ZSDs), characterized by variable phenotypes in terms of disease severity, age of onset and clinical presentations. So far, defects in at least 15 PEX-genes have been implicated in Mendelian diseases, but in some of the ultra-rare ZSD subtypes genotype-phenotype correlations and disease mechanisms remain elusive.

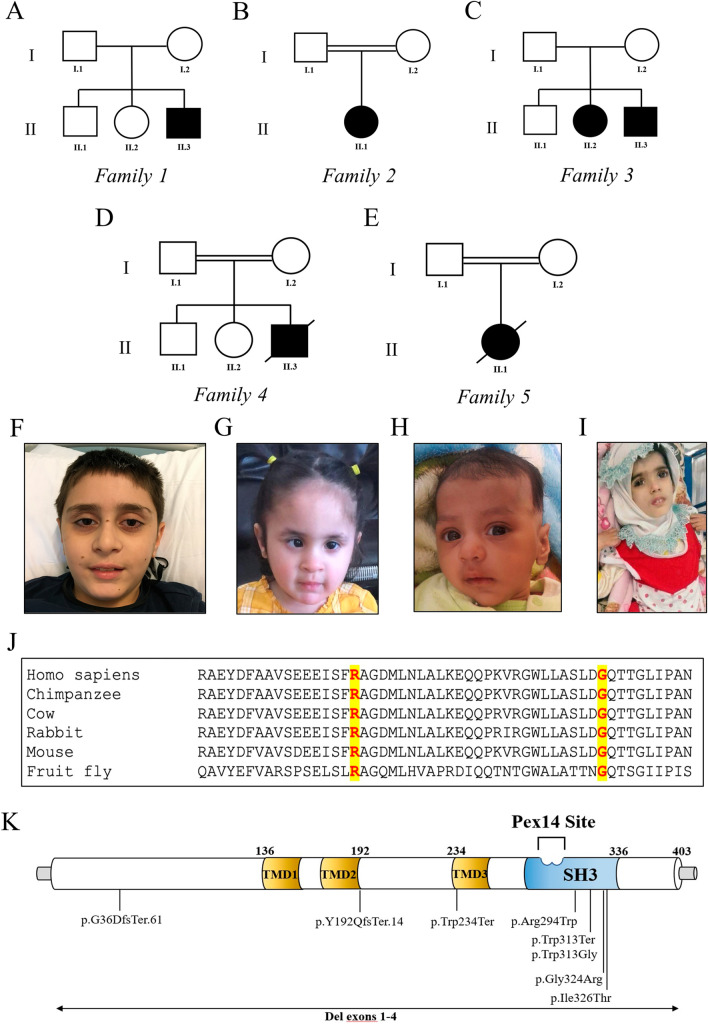
Methods: We report five families carrying biallelic variants in PEX13. The identified variants were initially evaluated by using a combination of computational approaches. Immunofluorescence and complementation studies on patient-derived fibroblasts were performed in two patients to investigate the cellular impact of the identified mutations.

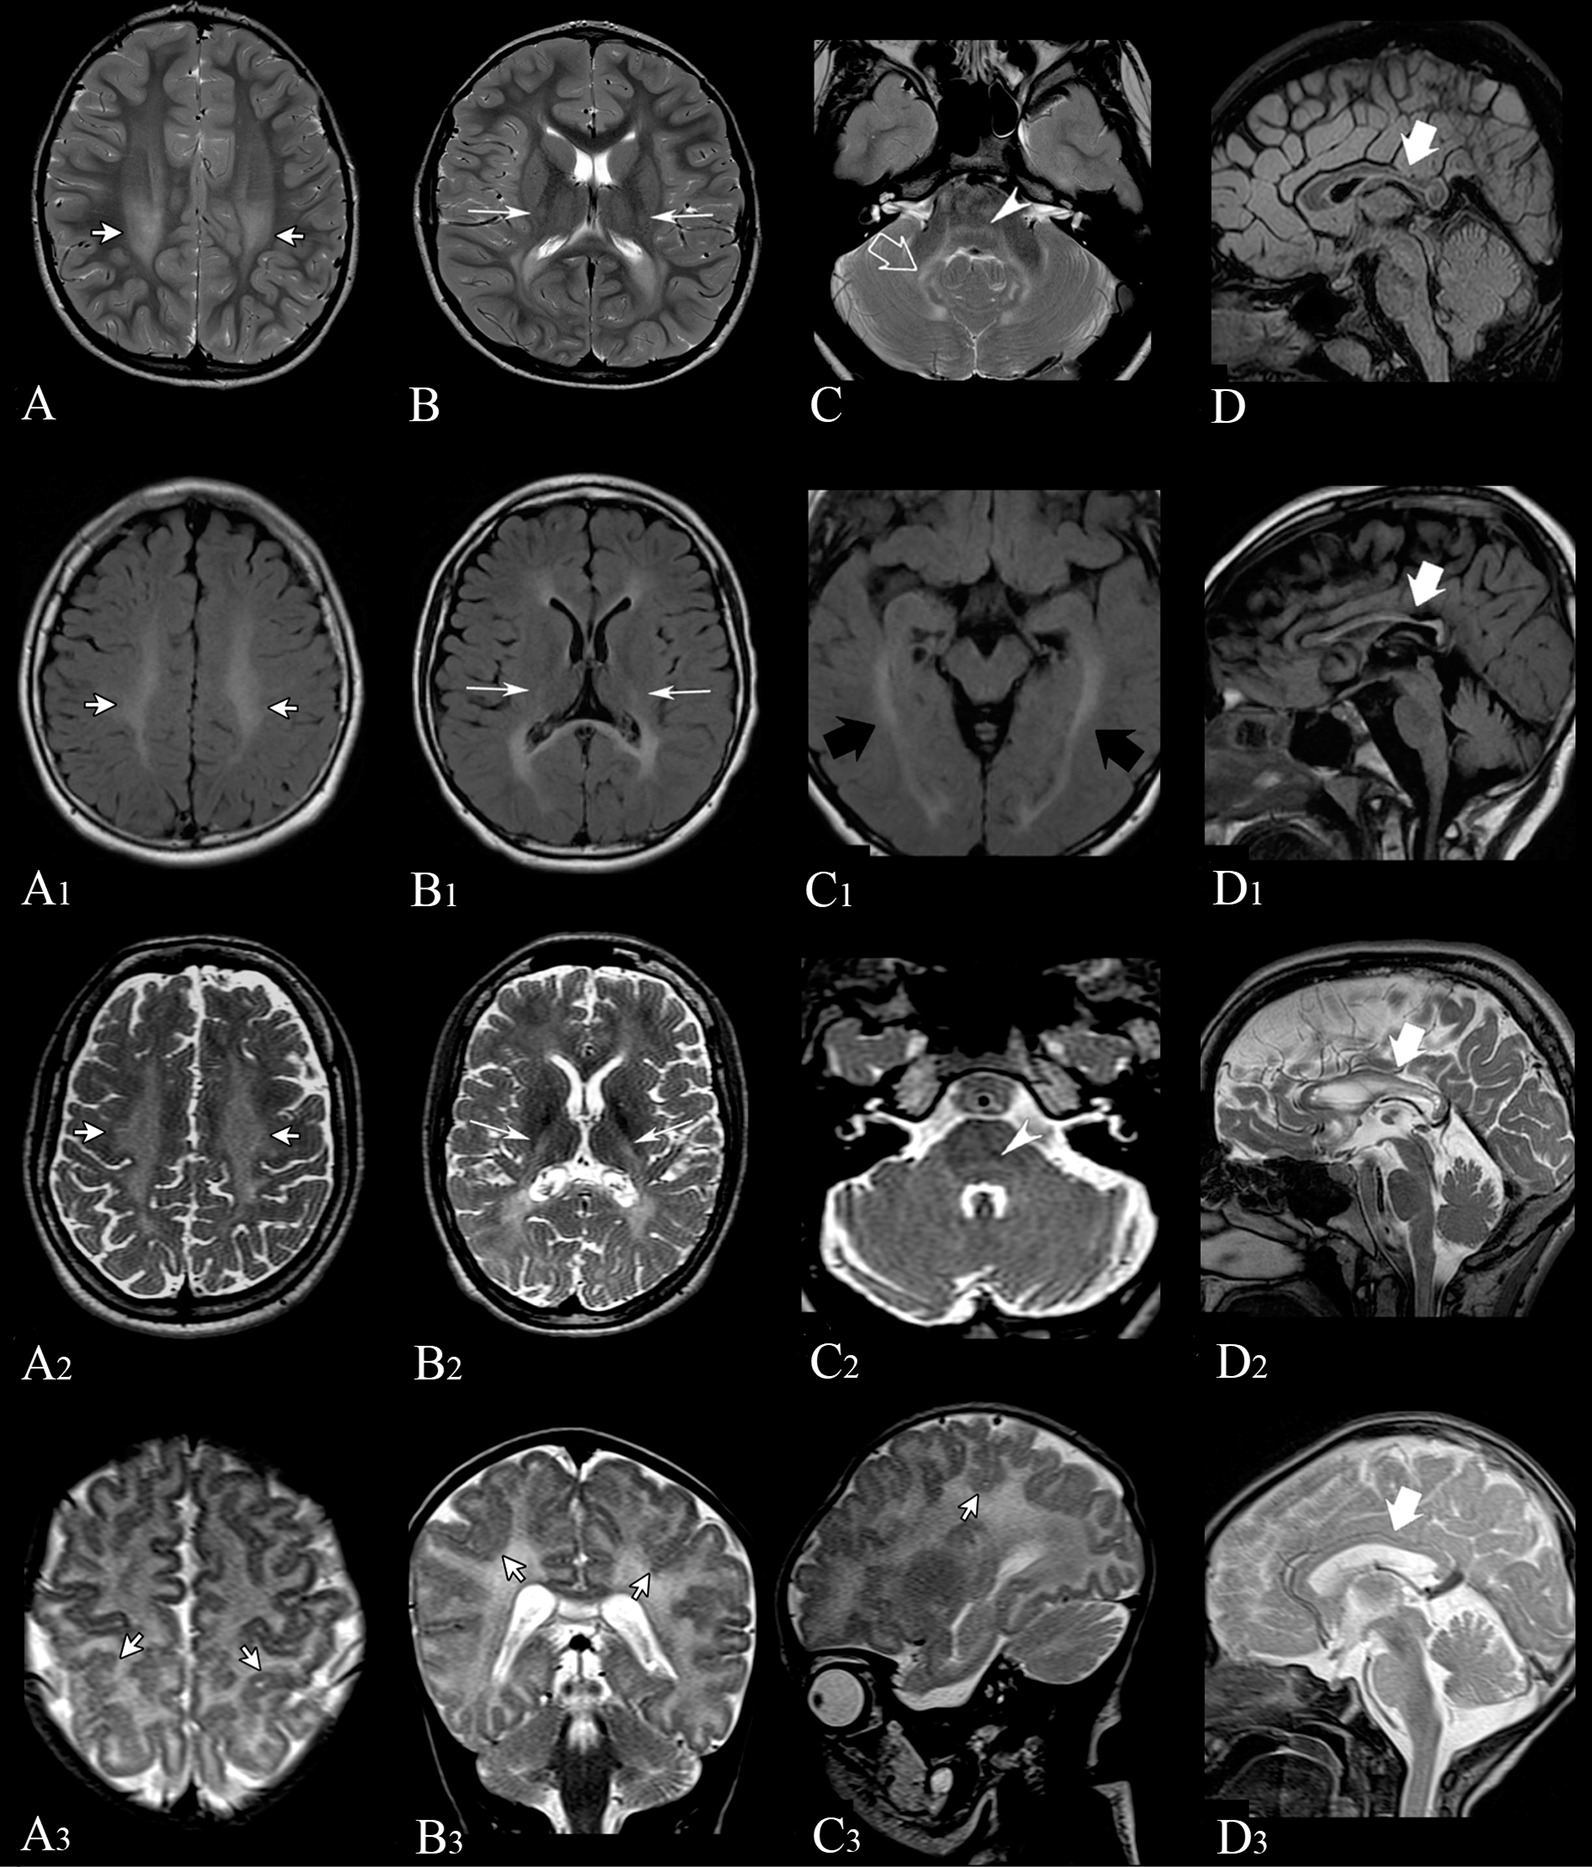
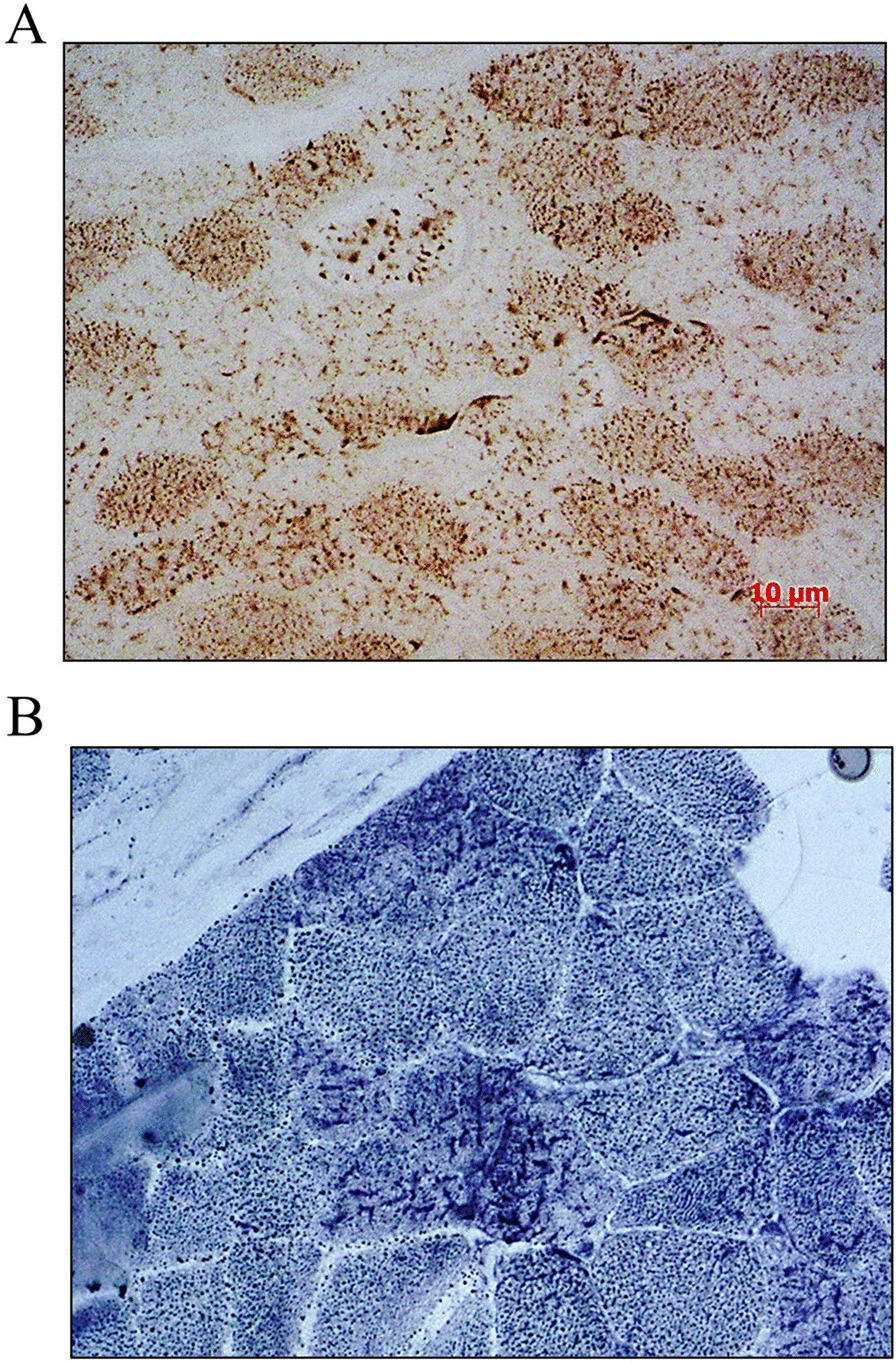
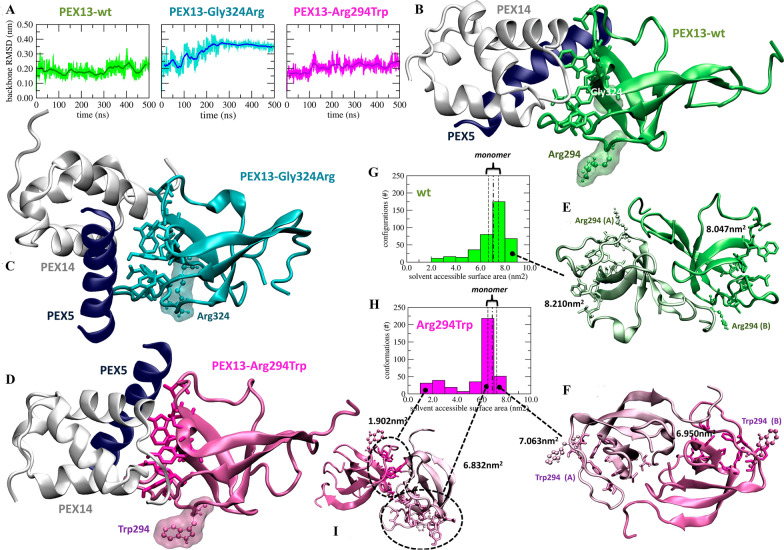
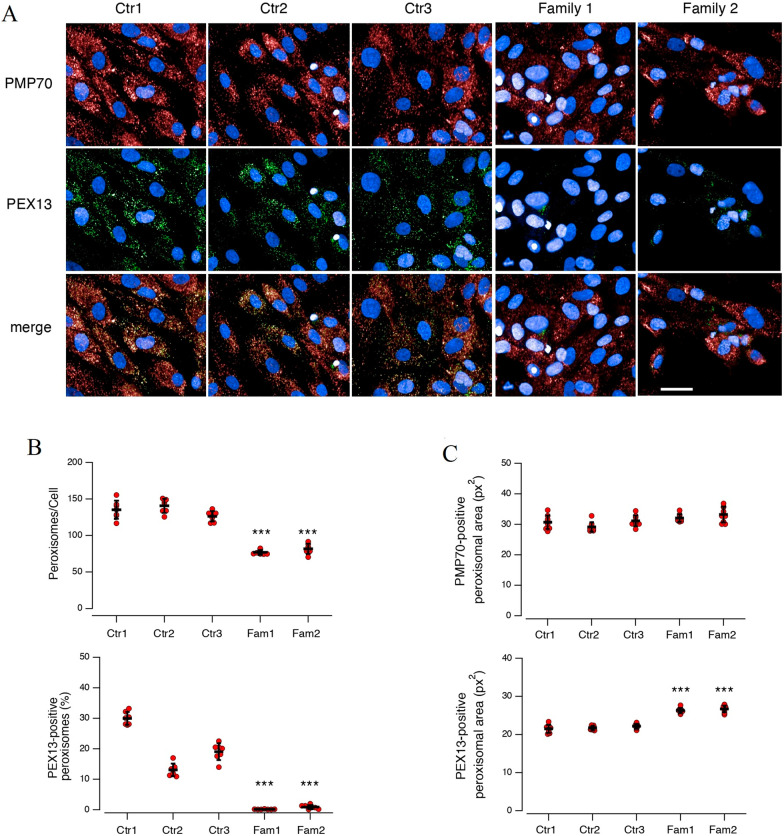
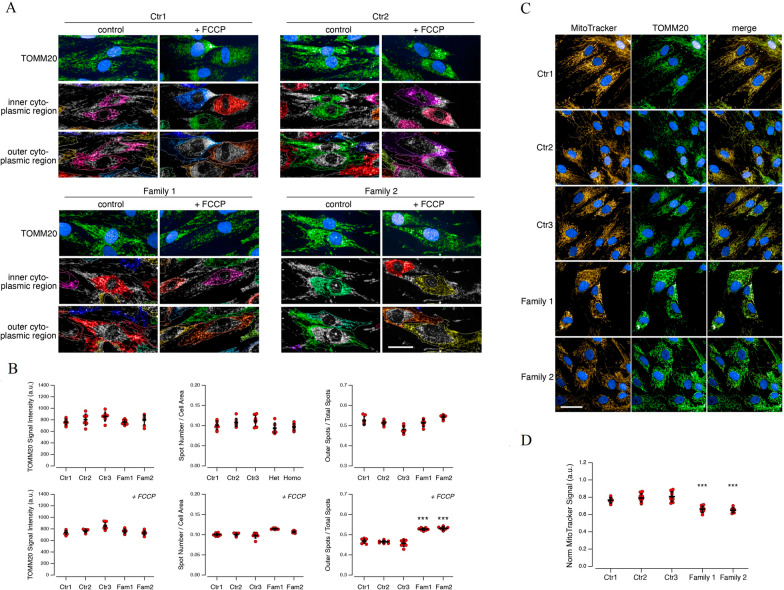
Results: Three out of five families carried a recurrent p.Arg294Trp non-synonymous variant. Individuals affected with PEX13-related ZSD presented heterogeneous clinical features, including hypotonia, developmental regression, hearing/vision impairment, progressive spasticity and brain leukodystrophy. Computational predictions highlighted the involvement of the Arg294 residue in PEX13 homodimerization, and the analysis of blind docking predicted that the p.Arg294Trp variant alters the formation of dimers, impairing the stability of the PEX13/PEX14 translocation module. Studies on muscle tissues and patient-derived fibroblasts revealed biochemical alterations of mitochondrial function and identified mislocalized mitochondria and a reduced number of peroxisomes with abnormal PEX13 concentration.

Conclusions: This study expands the phenotypic and mutational spectrum of PEX13-related ZSDs and also highlight a variety of disease mechanisms contributing to PEX13-related clinical phenotypes, including the emerging contribution of secondary mitochondrial dysfunction to the pathophysiology of ZSDs.

Keywords: PEX13; mitochondrial dysfunction; Peroxisome biogenesis disorders; Zellweger spectrum disorder.


Conflict of interest statement

The authors declare that the research was conducted in the absence of any commercial or financial relationships that could be construed as a potential conflict of interest.

Figures

Fig. 1
Fig. 1
Family trees, PEX13-associated clinical features, PEX13-interspecies alignment, PEX13 protein and PEX13-associated mutations. The pedigree diagrams of six families carrying PEX13 variants (AE). PEX13-associated clinical features of individuals A.II-3 (F), B.II-1 (G), D.II-3 (H), and E.II-1 (I). Interspecies alignment of PEX13 protein sequences (J) generated with Clustal Omega (https://www.ebi.ac.uk) shows that p.Arg294Trp and p.Gly324Arg missense variants identified in this study occur at residues highly conserved across species (highlighted in yellow). Schematic of the human PEX13 protein indicating the positions of the variants identified so far (K)
Fig. 2
Fig. 2
Brain MRI images of individual A.II-3 (AD) at 8 years of age. Axial (AC) T2-weighted images show bilateral hyperintensity within the posterior periventricular white matter (short white arrows in A), posterior limb of the internal capsules (long white arrows in B), within the cerebellar peduncles and dentate nuclei in the cerebellar region (empty white arrow in C) and in medial lemnisci (white arrowhead in C). Sagittal FLAIR image (D) shows thinning of the posterior portions of the corpus callosum (white arrow). Brain MRI images of individual C.II-3 (A1D1) at 11 years of age. Axial (A1C1) FLAIR images show bilateral hyperintensity within the posterior periventricular white matter (short white arrows in A1), posterior limb of the internal capsules (long white arrows in B1), and optic radiations (black arrows in C1). Sagittal FLAIR image (D1) shows thinning of the corpus callosum (white arrow). Brain MRI images of individual C.II-2 (A2A2) at 16 years of age. Axial (A2C2) T2-weighted images show bilateral hyperintensity within the posterior periventricular white matter (short white arrows in A2), posterior limb of the internal capsules (long white arrows in B2), and in medial lemnisci (white arrowhead in C2). Sagittal T2-weighted image (D2) shows thinning of the corpus callosum (white arrow). Brain MRI images of Individual D.II-3 (A3D3) at 1 month of age. Axial (A3), Coronal (B3), and Sagittal (C3) T2-weighted images show bilateral malformation of cortical development in parietal lobes, with a polymicrogyria-like appearance (short white arrows). Midline Sagittal T2-weighted image (D3) does not show thinning of the corpus callosum at this early stage of life (white arrow)
Fig. 3
Fig. 3
Muscle biopsy from Individual A-II.3. COX (A) and SDH (B) histochemical stain showed an uneven distribution of mitochondria including patchy or reticular patterns and areas devoid of oxidative staining. At higher magnification histopathological observation mitochondria appears also larger and possibly swollen (3A-B)
Fig. 4
Fig. 4
Molecular modelling of identified PEX13 missense variants (p.Arg294Trp and p.Gly324Arg). A Analysis of 500 ns of atomistic molecular dynamics trajectories run in water solvent at 330 K, protein backbone RMSD for the wild type PEX13 (left), the mutant Gly324Arg (center), and its Glu294Trp mutant (right), running averages over 50 data points are highlighted (dark solid lines); B PEX13-wt:PEX14:PEX5 tetramer; C PEX13-Gly324Arg:PEX14:PEX5 tetramer; D PEX13-Arg294Trp:PEX14:PEX5 tetramer; E PEX13-wt:PEX13-WT homodimer; F PEX13-Arg294Trp:PEX13Arg294Trp homodimer; GH solvent accessible surface area distribution of the residues responsible to the binding of PEX13 with PEX14 for PEX13-wt:PEX13-wt (G) and PEX13-Arg294Trp:PEX13-Arg294Trp (H), the distributions were calculated over both dimers of all configurations generated by docking, the monomers average value (dotted dashed lines) as well as its standard deviation (dashed lines) calculated over configurations sampled along 500 ns of molecular dynamics simulations are also indicated; I an aberrant PEX13-Arg294Trp:PEX13-Arg294Trp homodimers in which one of PEX14 binding site is buried due to dimerisation. Configurations were obtained by PEX13 homology modelling followed by 500 ns of molecular dynamics simulations and (BD) docking to PEX14:PEX5 (EI) blind docking to PEX13. The residues predicted to be involved in PEX13:PEX14 interactions (and selected binding site for the dockings of panels BD) are highlighted (licorice), their solvent accessible surface area is labelled in panels E, F, I. Arg294 and Trp294 are highlighted in PEX13-wt and PEX13-Arg294Trp, respectively; Gly324 in PEX13-wt (B), and Arg324 in PEX13-Gly324Arg (C). Color code: PEX13-wt (green), PEX13-Gly324Arg (cyan), PEX13-Arg294Trp (magenta), PEX14 (white), PEX5 (blue)
Fig. 5
Fig. 5
Reduced peroxisomes in fibroblasts derived from Individuals A.II-3 and B.II-1. Images showing PMP70- (A, upper panels) and PEX13-positive (A, middle panels) peroxisomes. PEX13 localizes in a subset of PMP70-positive peroxisomes (A, bottom panels). Quantification of PMP70- (B, top graph) and PEX13-positive (B, bottom graph) peroxisomes in fibroblasts: ZSD patients display fewer PMP70-positive peroxisomes and severely impaired expression of PEX13-positive peroxisomes. Each dot represents the value obtained from the analysis of a different biological replicate, in which 200 cells were imaged and analyzed. Lines indicate means ± SD, n = 50. Morphological analysis of PMP70- (C, top graph) and PEX13-positive (C, bottom graph) peroxisomes in fibroblasts: ZSD patients display enlarged PEX13-positive peroxisomes, while the size of overall PMP70-positive peroxisomes is not affected. Each dot represents the value obtained from the analysis of a different region (having area of 0.1 mm2) in which all PMP70- or PEX13-positive peroxisomes were imaged and analyzed. Lines indicate means ± SD, n = 9. Symbols indicate statistical significance versus pooled values of controls: ***, p < 0.001. Scale bar: 50 µm
Fig. 6
Fig. 6
Impaired mitochondrial network and localization in fibroblasts derived from Individuals A.II-3 and B.II-1. Images showing, for each individual, the mitochondrial network in cells under resting condition (DMSO-treated cells; A, upper left panels) or treated with the mitochondrial uncoupler FCCP (30 µM; A, upper right panels). Mitochondria were visualized by staining for the mitochondrial marker TOMM20. Cytoplasm was divided into inner (A, middle panels) and outer (A, bottom panels) cytoplasmic regions. Quantification of total TOMM20 signal intensity (B, left graphs), number of spots (resembling individual mitochondria) normalized per cell area (B, middle graphs), and percentage of spots localized in the outer cytoplasmic region (B, right graphs) in cells under resting condition (DMSO-treated cells; top) or treated with FCCP (30 µM; Fig. 6B, bottom). In ZSD cells, the percentage of mitochondria that are mislocalized in the outer cytoplasmic region, following stress conditions, is markedly increased. Each dot represents the value obtained from the analysis of a different biological replicate, in which 500 cells were imaged and analyzed. Lines indicate means ± SD, n = 9. Images (C) showing the mitochondrial network visualized by staining for the mitochondrial marker TOMM20 or using the fluorescent dye MitoTracker, which accumulates in viable mitochondria dependently on mitochondria membrane potential. Quantification of total MitoTracker signal (corresponding to the dye accumulated into mitochondria) normalized for TOMM20 signal (D). ZSD patients display decreased MitoTracker accumulation. Each dot represents the value obtained from the analysis of a different biological replicate, in which 250 cells were imaged and analyzed. Lines indicate means ± SD, n = 12. Symbols indicate statistical significance versus pooled values of controls: ***, p < 0.001. Scale bar: 50 µm

Similar articles

Cited by

  • Spectrum of genetic alterations in patients with peroxisome biogenesis defects in the Iranian population: a case series study.
    Khalilian S, Fathi M, Jamshidi S, Madannejad R, Sayad A, Ghafouri-Fard S, Miryounesi M. Khalilian S, et al. BMC Med Genomics. 2025 Apr 9;18(1):67. doi: 10.1186/s12920-025-02126-3. BMC Med Genomics. 2025. PMID: 40205409 Free PMC article.
  • Variants in the WDR44 WD40-repeat domain cause a spectrum of ciliopathy by impairing ciliogenesis initiation.
    Accogli A, Shakya S, Yang T, Insinna C, Kim SY, Bell D, Butov KR, Severino M, Niceta M, Scala M, Lee HS, Yoo T, Stauffer J, Zhao H, Fiorillo C, Pedemonte M, Diana MC, Baldassari S, Zakharova V, Shcherbina A, Rodina Y, Fagerberg C, Roos LS, Wierzba J, Dobosz A, Gerard A, Potocki L, Rosenfeld JA, Lalani SR, Scott TM, Scott D, Azamian MS, Louie R, Moore HW, Champaigne NL, Hollingsworth G, Torella A, Nigro V, Ploski R, Salpietro V, Zara F, Pizzi S, Chillemi G, Ognibene M, Cooney E, Do J, Linnemann A, Larsen MJ, Specht S, Walters KJ, Choi HJ, Choi M, Tartaglia M, Youkharibache P, Chae JH, Capra V, Park SG, Westlake CJ. Accogli A, et al. Nat Commun. 2024 Jan 8;15(1):365. doi: 10.1038/s41467-023-44611-2. Nat Commun. 2024. PMID: 38191484 Free PMC article.

References

    1. Krause C, Rosewich H, Woehler A, Gärtner J. Functional analysis of PEX13 mutation in a Zellweger syndrome spectrum patient reveals novel homooligomerization of PEX13 and its role in human peroxisome biogenesis. Hum Mol Genet. 2013;22(19):3844–3857. doi: 10.1093/hmg/ddt238. - DOI - PubMed
    1. Waterham HR, Ferdinandusse S, Wanders RJA. Human disorders of peroxisome metabolism and biogenesis. Biochim Biophys Acta - Mol Cell Res. 2016;1863(5):922–933. doi: 10.1016/j.bbamcr.2015.11.015. - DOI - PubMed
    1. Steinberg SJ, Raymond GV, Braverman NE, Moser AB. Zellweger Spectrum Disorder. In: Adam MP, Ardinger HH, Pagon RA, et al., eds. GeneReviews®. University of Washington, Seattle; December 12, 2003. - PubMed
    1. Liu Y, Björkman J, Urquhart A, Wanders RJ, Crane DI, Gould SJ. PEX13 is mutated in complementation group 13 of the peroxisome-biogenesis disorders. Am J Hum Genet. 1999;65(3):621–634. doi: 10.1086/302534. - DOI - PMC - PubMed
    1. Shimozawa N, Suzuki Y, Zhang Z, et al. Peroxisome biogenesis disorders: identification of a new complementation group distinct from peroxisome-deficient CHO mutants and not complemented by human PEX 13. Biochem Biophys Res Commun. 1998;243(2):368–371. doi: 10.1006/bbrc.1997.8067. - DOI - PubMed

LinkOut - more resources