

Novel lncRNAs with diagnostic or prognostic value screened out from breast cancer via bioinformatics analyses
- PMID: 35855425
- PMCID: PMC9288825
- DOI: 10.7717/peerj.13641
Novel lncRNAs with diagnostic or prognostic value screened out from breast cancer via bioinformatics analyses
Abstract
Background: Recent studies have shown that long non-coding RNAs (lncRNAs) may play key regulatory roles in many malignant tumors. This study investigated the use of novel lncRNA biomarkers in the diagnosis and prognosis of breast cancer.
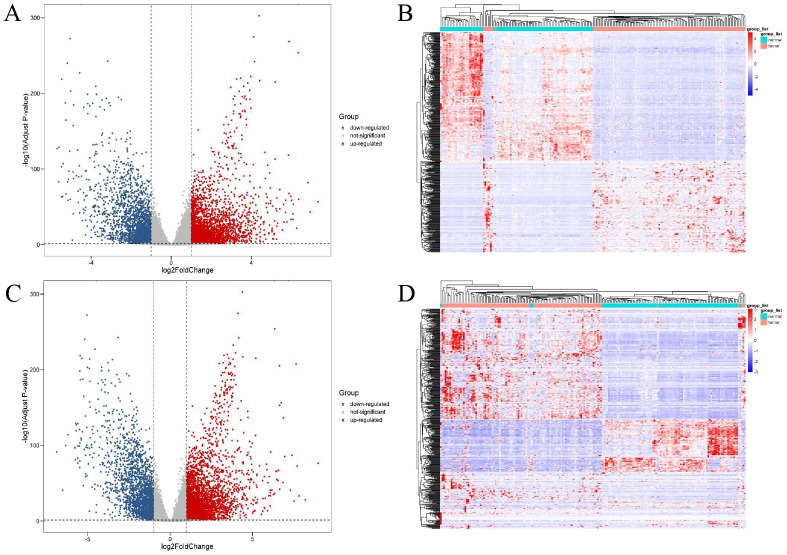
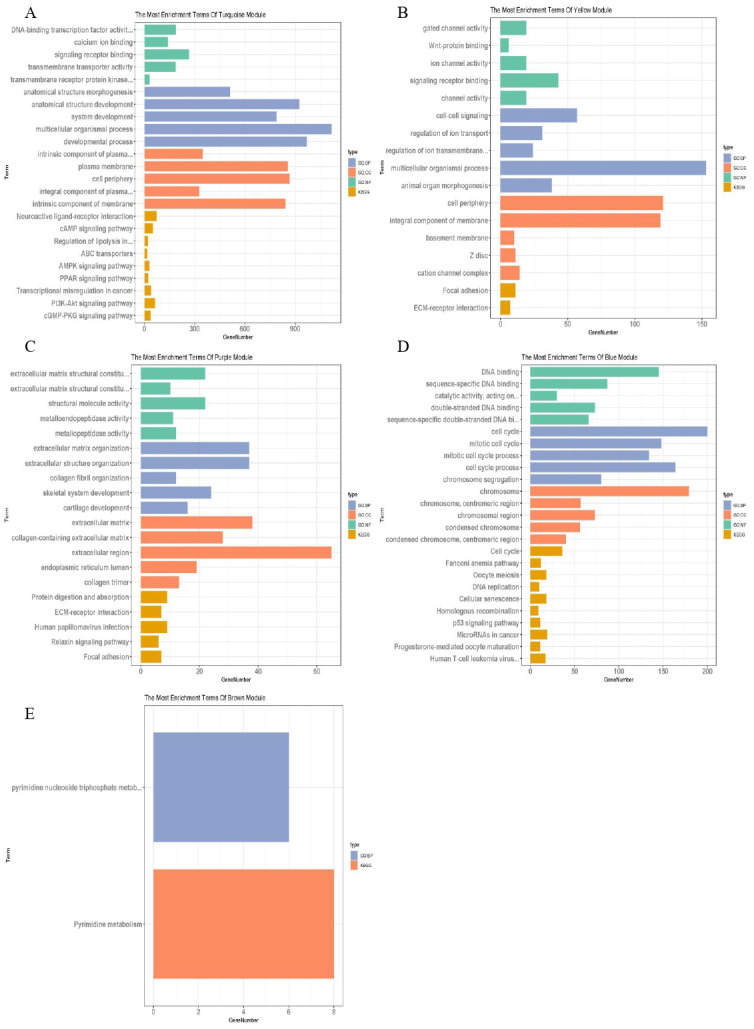
Materials and methods: The database subsets of The Cancer Genome Atlas (TCGA) by RNA-seq for comparing analysis of tissue samples between breast cancer and normal control groups were downloaded. Additionally, anticoagulant peripheral blood samples were collected and used in this cohort study. The extracellular vesicles (EVs) from the plasma were extracted and sequenced, then analyzed to determine the expressive profiles of the lncRNAs, and the cancer-related differentially expressed lncRNAs were screened out. The expressive profiles and associated downstream-mRNAs were assessed using bioinformatics (such as weighted correlation network analysis (WGCNA), Gene Ontology (GO) and Kyoto Encyclopedia of Genes and Genome (KEGG) enrichments, Receiver-Operating Characteristic (ROC) curve and survival analysis, etc.) to investigate the diagnostic and prognostic values of these EV lncRNAs and their effectors.
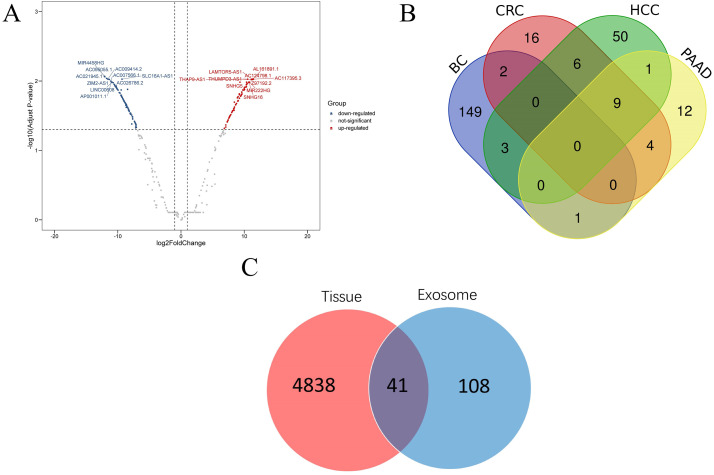
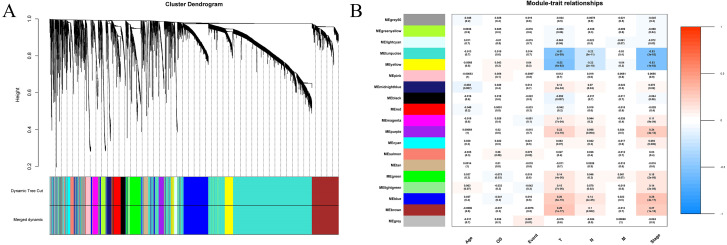
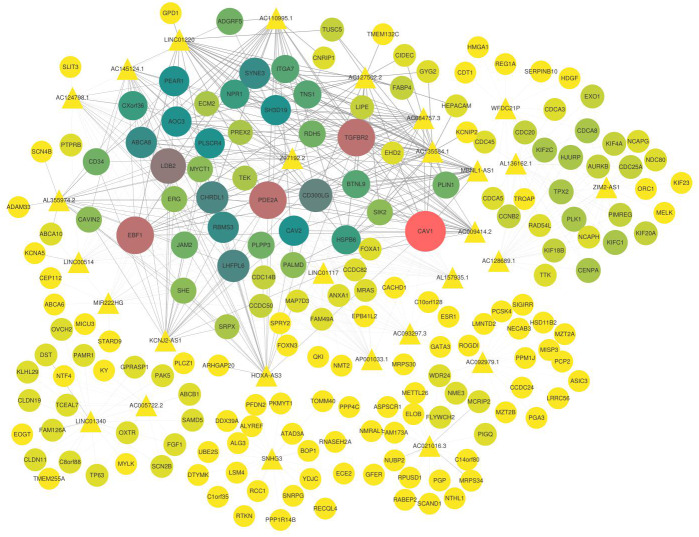
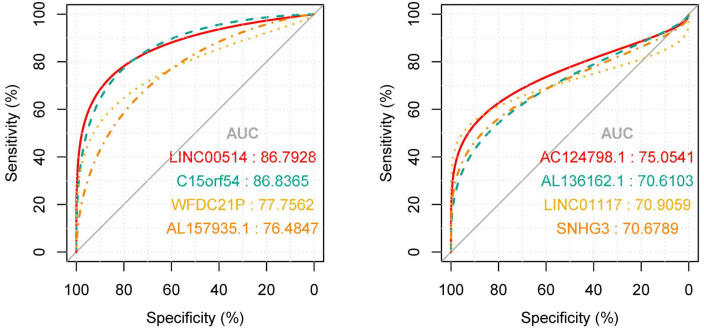
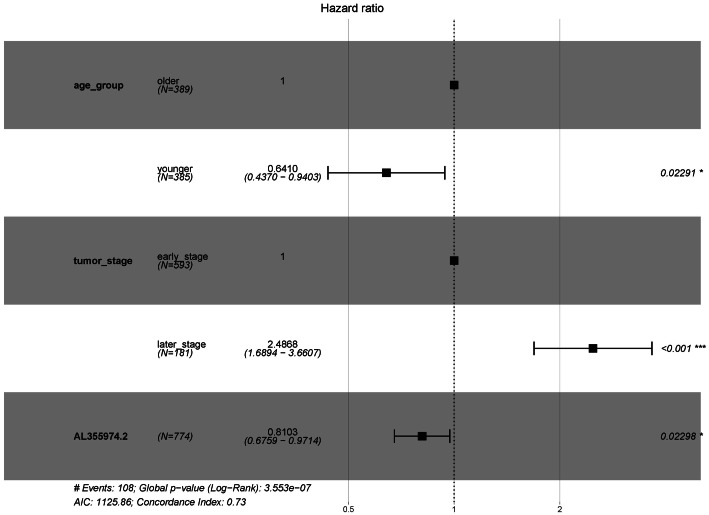
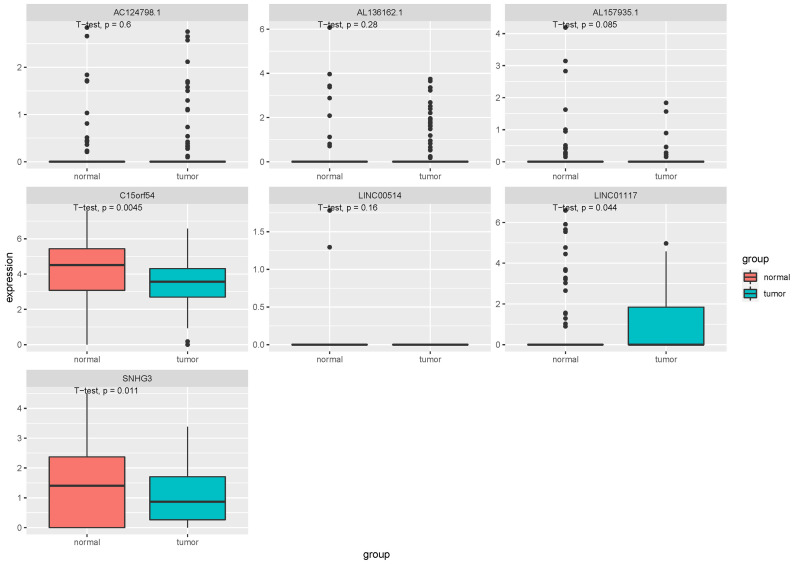
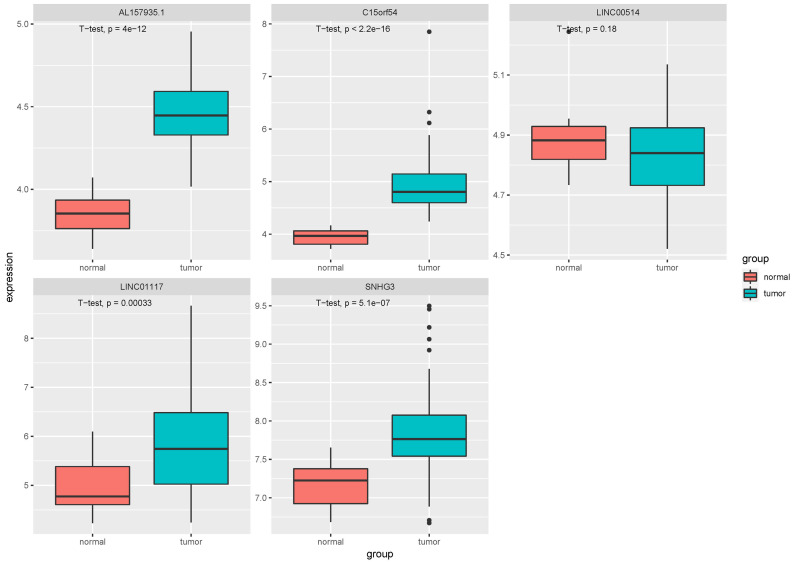
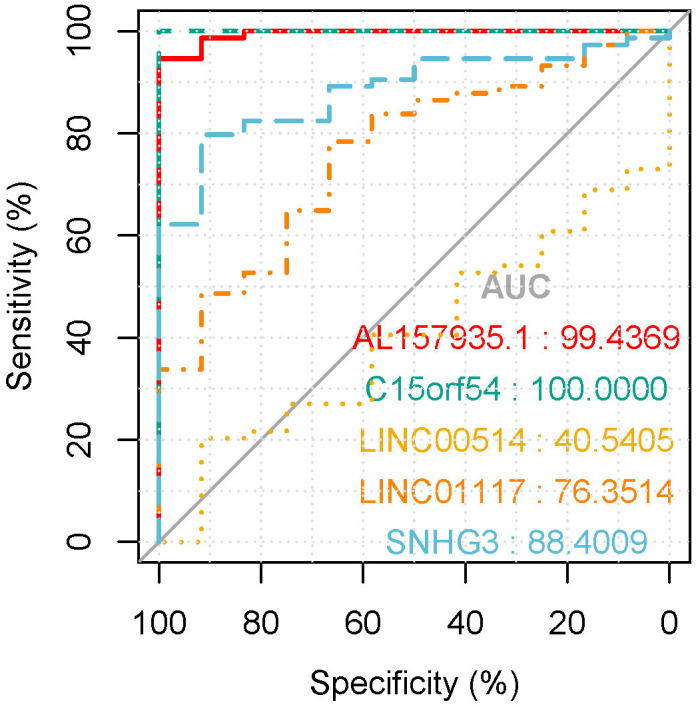
Results: In this study, 41 breast cancer-related lncRNAs were screen out from two datasets of tissue and fresh collected plasma samples of breast cancer via the transcriptomic and bioinformatics techniques. A total of 19 gene modules were identified with WGCNA analysis, of which five modules were significantly correlated with the clinical stage of breast cancer, including 28 lncRNA candidates. The ROC curves of these lncRNAs revealed that the area under the curve (AUC) of all candidates were great than 70%. However, eight lncRNAs had an AUC >70%, indicating that the combined one has a good diagnostic value. In addition, the results of survival analysis suggested that two lncRNAs with low expressive levels may indicate the poor prognosis of breast cancer. By tissue sample verification, C15orf54, AL157935.1, LINC01117, and SNHG3 were determined to have good diagnostic ability in breast cancer lesions, however, there was no significant difference in the plasma EVs of patients. Moreover, survival analysis data also showed that AL355974.2 may serve as an independent prognostic factor and as a protective factor.
Conclusion: A total of five lncRNAs found in this study could be developed as biomarkers for breast cancer patients, including four diagnostic markers (C15orf54, AL157935.1, LINC01117, and SNHG3) and a potential prognostic marker (AL355974.2).
Keywords: Biomarker; Diagnosis; Exosome; Prognosis; lncRNA; Breast cancer.
©2022 Wang et al.
Conflict of interest statement
The authors declare there are no competing interests.
Figures
Similar articles
-
Excavating novel diagnostic and prognostic long non-coding RNAs (lncRNAs) for head and neck squamous cell carcinoma: an integrated bioinformatics analysis of competing endogenous RNAs (ceRNAs) and gene co-expression networks.Bioengineered. 2021 Dec;12(2):12821-12838. doi: 10.1080/21655979.2021.2003925. Bioengineered. 2021. PMID: 34898376 Free PMC article.
-
Long non-coding RNA profile study identifies a metabolism-related signature for colorectal cancer.Mol Med. 2021 Aug 3;27(1):83. doi: 10.1186/s10020-021-00343-x. Mol Med. 2021. PMID: 34344319 Free PMC article.
-
Hub Long Noncoding RNAs with m6A Modification for Signatures and Prognostic Values in Kidney Renal Clear Cell Carcinoma.Front Mol Biosci. 2021 Jul 6;8:682471. doi: 10.3389/fmolb.2021.682471. eCollection 2021. Front Mol Biosci. 2021. PMID: 34295922 Free PMC article.
-
Identification of MFI2-AS1, a Novel Pivotal lncRNA for Prognosis of Stage III/IV Colorectal Cancer.Dig Dis Sci. 2020 Dec;65(12):3538-3550. doi: 10.1007/s10620-020-06064-1. Epub 2020 Jan 20. Dig Dis Sci. 2020. PMID: 31960204 Review.
-
Potential diagnostic and prognostic value of the long non-coding RNA SNHG3 in human cancers: A systematic review and meta-analysis.Int J Biol Markers. 2022 Mar;37(1):3-12. doi: 10.1177/03936155221077121. Epub 2022 Feb 7. Int J Biol Markers. 2022. PMID: 35130083
Cited by
-
Biological roles of SLC16A1-AS1 lncRNA and its clinical impacts in tumors.Cancer Cell Int. 2024 Mar 30;24(1):122. doi: 10.1186/s12935-024-03285-6. Cancer Cell Int. 2024. PMID: 38555465 Free PMC article. Review.
-
LINC01117 inhibits invasion and migration of lung adenocarcinoma through influencing EMT process.PLoS One. 2023 Jun 29;18(6):e0287926. doi: 10.1371/journal.pone.0287926. eCollection 2023. PLoS One. 2023. PMID: 37384755 Free PMC article.
-
Potential of blood exosomal ENAH, SEPT9, EGF, MMP-9 and CXCL8 for the early screening of breast cancer.Oncol Lett. 2022 Nov 3;24(6):460. doi: 10.3892/ol.2022.13580. eCollection 2022 Dec. Oncol Lett. 2022. PMID: 36380877 Free PMC article.
-
Importance of long non-coding RNAs in the pathogenesis, diagnosis, and treatment of myocardial infarction.Int J Cardiol Heart Vasc. 2024 Oct 17;55:101529. doi: 10.1016/j.ijcha.2024.101529. eCollection 2024 Dec. Int J Cardiol Heart Vasc. 2024. PMID: 39498345 Free PMC article. Review.
-
Crosstalk between Long Non-Coding RNA and Spliceosomal microRNA as a Novel Biomarker for Cancer.Noncoding RNA. 2023 Jul 31;9(4):42. doi: 10.3390/ncrna9040042. Noncoding RNA. 2023. PMID: 37624034 Free PMC article. Review.
References
-
- Bhandari A, Shen Y, Sindan N, Xia E, Gautam B, Lv S, Zhang X. MAL2 promotes proliferation, migration, and invasion through regulating epithelial-mesenchymal transition in breast cancer cell lines. Biochemical and Biophysical Research Communications. 2018;504:434–439. doi: 10.1016/j.bbrc.2018.08.187. - DOI - PubMed
-
- Cao WH, Liu HM, Liu X, Li JG, Liang J, Liu M, Niu ZH. Relaxin enhances in-vitro invasiveness of breast cancer cell lines by upregulation of S100A4/MMPs signaling. European Review for Medical and Pharmacological Sciences. 2013;17:609–617. - PubMed
Publication types
MeSH terms
Substances
Associated data
LinkOut - more resources
Full Text Sources
Medical
