

PTX3 mediates the infiltration, migration, and inflammation-resolving-polarization of macrophages in glioblastoma
- PMID: 35855654
- PMCID: PMC9532932
- DOI: 10.1111/cns.13913
PTX3 mediates the infiltration, migration, and inflammation-resolving-polarization of macrophages in glioblastoma
Abstract
Introduction: Pentraxin 3 (PTX3) is an essential regulator of the immune system. However, the immune-modulatory role of PTX3 in the tumor microenvironment of glioma has not been elucidated.
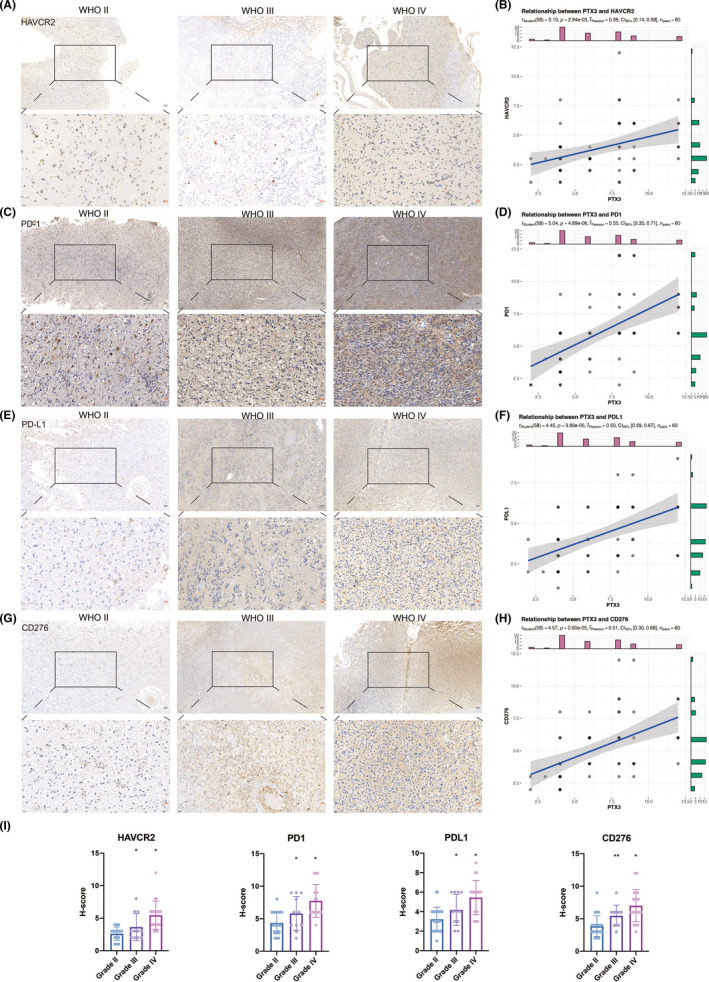
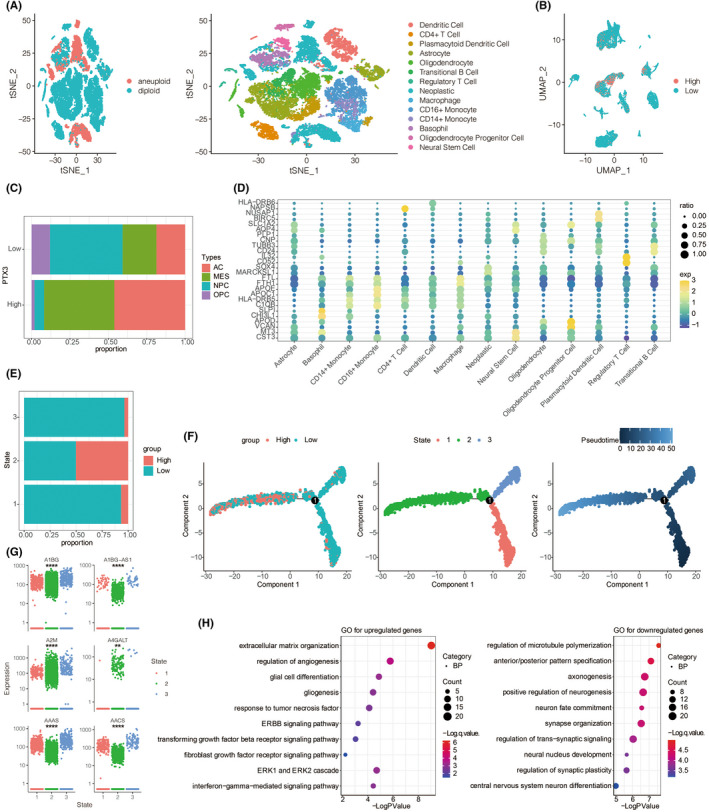
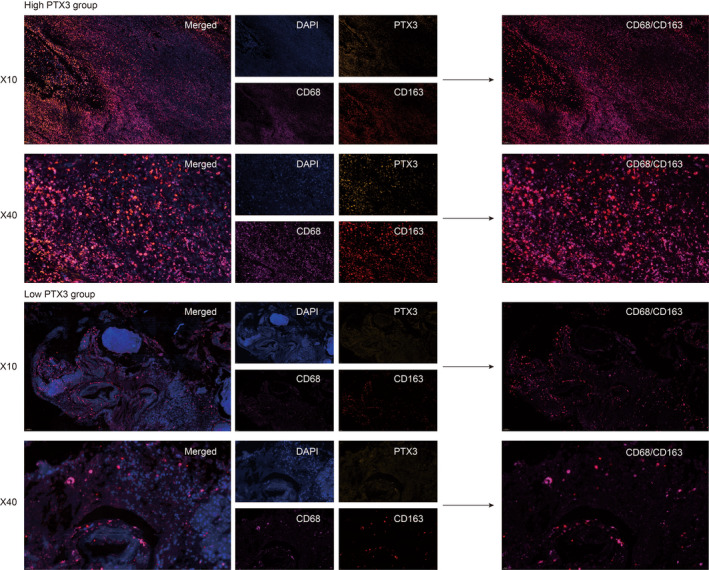
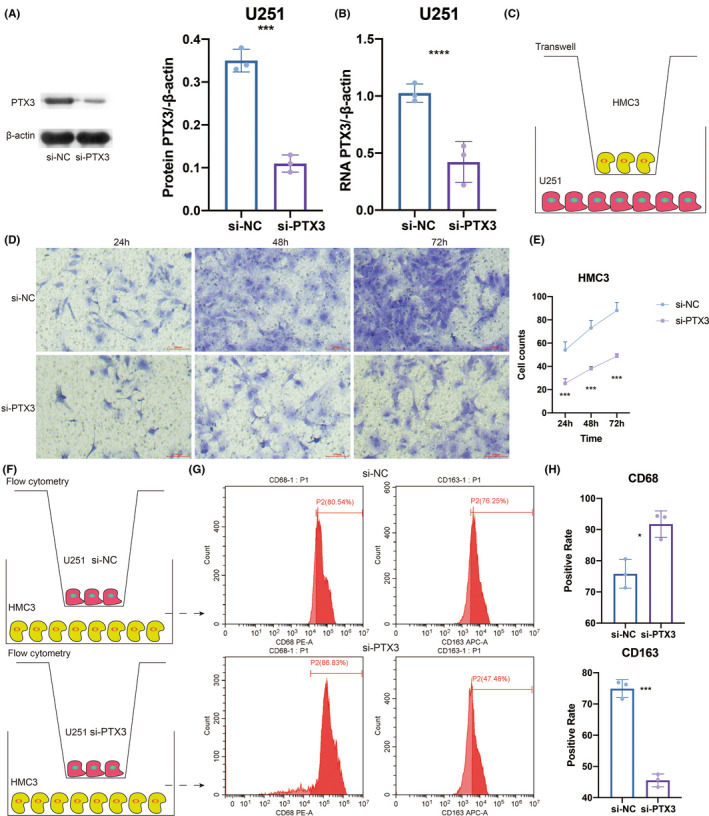
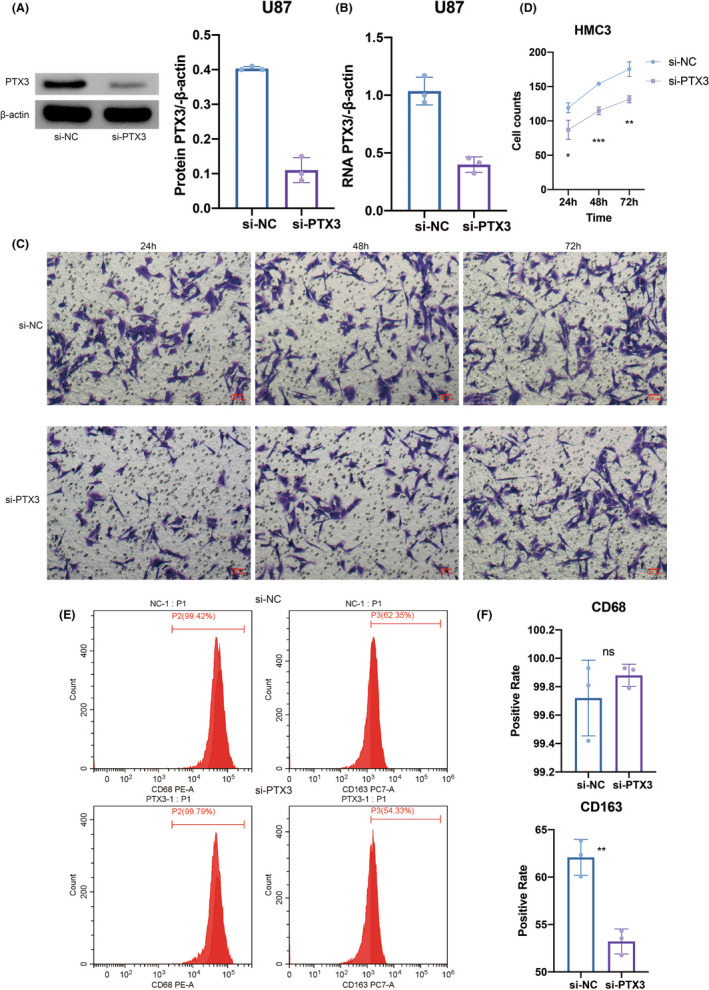
Methods: The RNA seq samples were obtained from The Cancer Genome Atlas (TCGA) and the China Glioma Genome Atlas (CGGA) datasets. The single-cell sequencing data of glioblastoma (GBM) samples were obtained from the Single Cell Portal platform (http://singlecell.broadinstitute.org). Immunohistochemistry was used to assess PTX3 expression, HAVCR2, PD-1, PD-L1, and CD276 in glioma sections from the Xiangya cohort (n = 60). Multiplex immunofluorescence staining of PTX3, CD68, and CD163 was performed in several solid cancer types, including GBM. HMC3 was cocultured with U251 and U87, and transwell assay and flow cytometry assay were performed to explore the migration and polarization activity of HMC3.
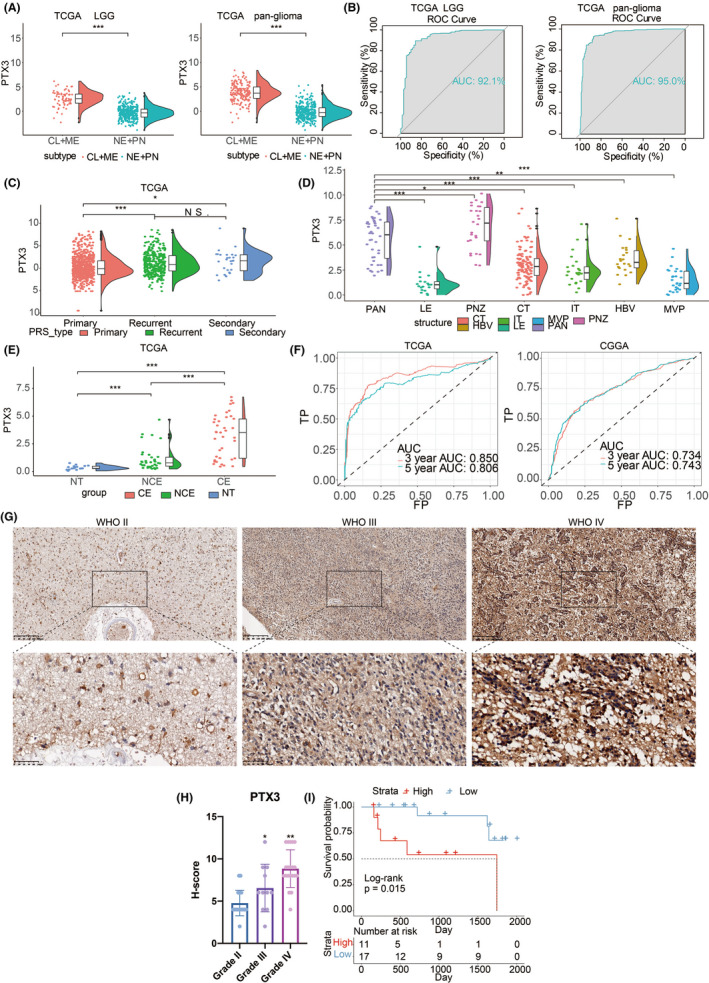
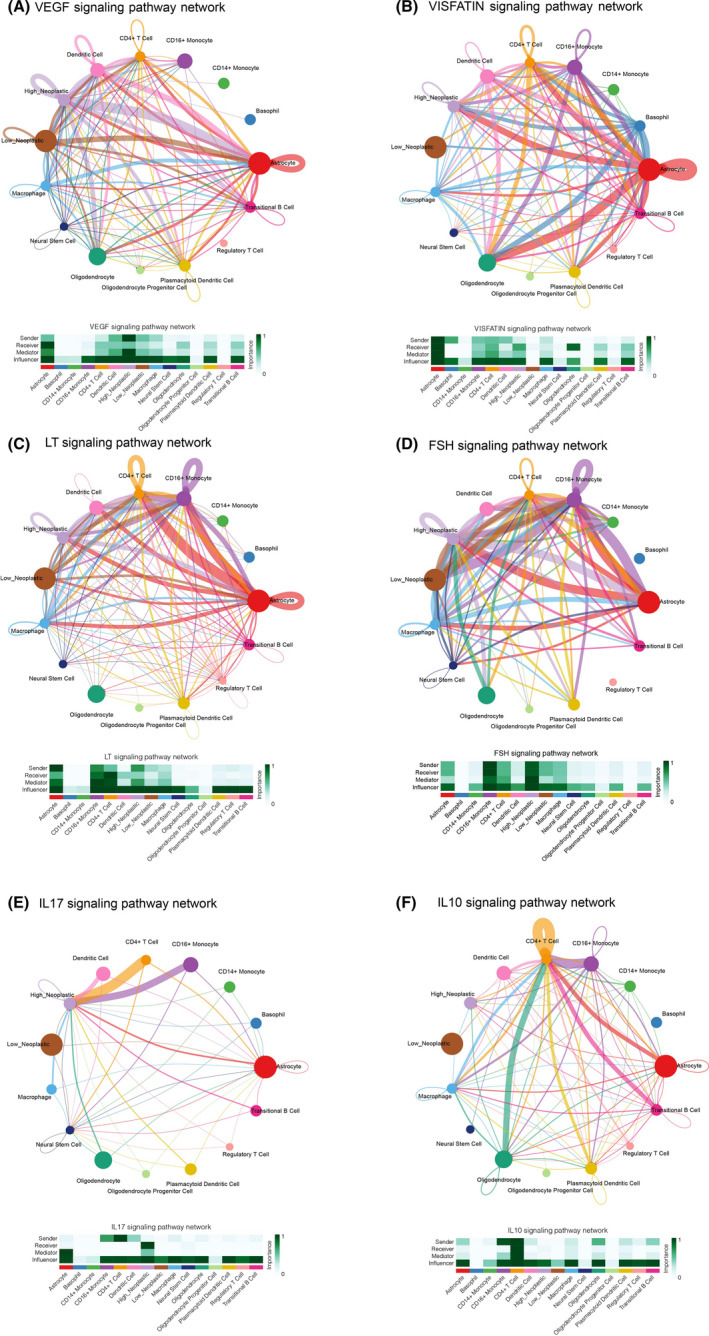
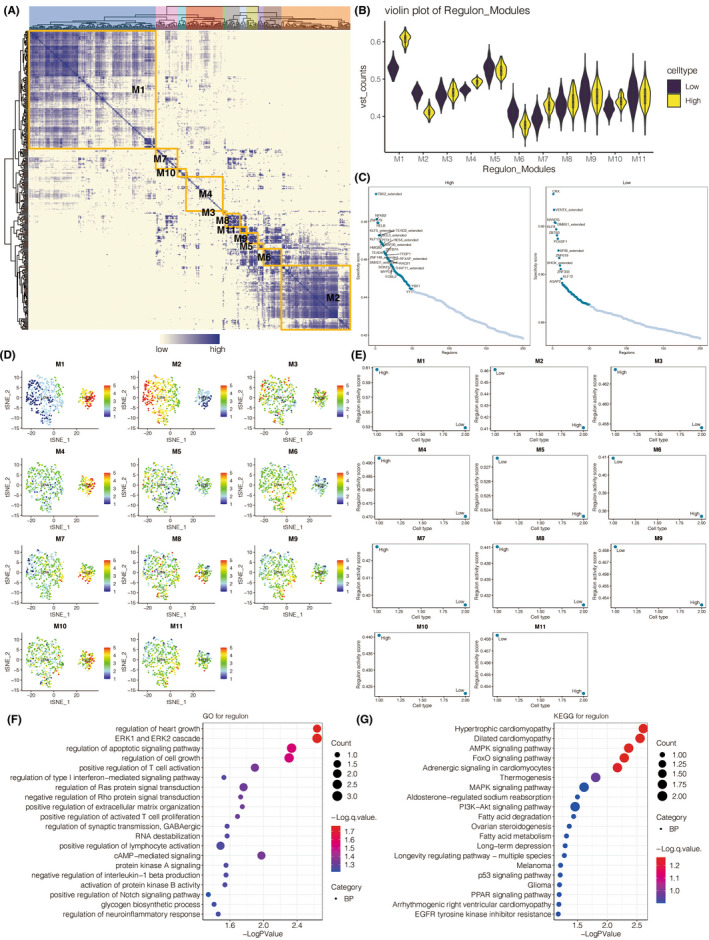
Results: PTX3 expression is significantly increased in GBM. PTX3 expression predicts worse survival in the Xiangya cohort. PTX3 is closely related to the expression of PD-1, PD-L1, CD276, and HAVCR2 in the tumor microenvironment. Additionally, PTX3 is involved in tumorigenic and immunogenic processes, especially the activity of macrophages based on various signaling pathways in cellular communications and critical transcription factors. Specifically, PTX3 actively mediates macrophages' infiltration, migration, and inflammation-resolving-polarization. PTX3 could also predict immunotherapy response.
Conclusion: PTX3 is critically involved in macrophage infiltration, migration, and inflammation-resolving-polarization and modulates an immunosuppressive microenvironment.
Keywords: PTX3; cellular communication; glioma microenvironment; macrophage; transcription factor.
© 2022 The Authors. CNS Neuroscience & Therapeutics published by John Wiley & Sons Ltd.
Conflict of interest statement
All authors declare that they have no competing interests.
Figures
Similar articles
-
PTPN7 mediates macrophage-polarization and determines immunotherapy in gliomas: A single-cell sequencing analysis.Environ Toxicol. 2024 Oct;39(10):4562-4580. doi: 10.1002/tox.24259. Epub 2024 Apr 6. Environ Toxicol. 2024. PMID: 38581214
-
MET overexpression contributes to STAT4-PD-L1 signaling activation associated with tumor-associated, macrophages-mediated immunosuppression in primary glioblastomas.J Immunother Cancer. 2021 Oct;9(10):e002451. doi: 10.1136/jitc-2021-002451. J Immunother Cancer. 2021. PMID: 34667077 Free PMC article.
-
The IFN-γ/PD-L1 axis between T cells and tumor microenvironment: hints for glioma anti-PD-1/PD-L1 therapy.J Neuroinflammation. 2018 Oct 17;15(1):290. doi: 10.1186/s12974-018-1330-2. J Neuroinflammation. 2018. PMID: 30333036 Free PMC article.
-
Current advances in PD-1/PD-L1 axis-related tumour-infiltrating immune cells and therapeutic regimens in glioblastoma.Crit Rev Oncol Hematol. 2020 Jul;151:102965. doi: 10.1016/j.critrevonc.2020.102965. Epub 2020 Apr 24. Crit Rev Oncol Hematol. 2020. PMID: 32442903 Review.
-
Prognostic and clinicopathological significance of PD-1/PD-L1 expression in the tumor microenvironment and neoplastic cells for lymphoma.Int Immunopharmacol. 2019 Dec;77:105999. doi: 10.1016/j.intimp.2019.105999. Epub 2019 Nov 6. Int Immunopharmacol. 2019. PMID: 31704289 Review.
Cited by
-
Multi-Omics Integration Analysis of TK1 in Glioma: A Potential Biomarker for Predictive, Preventive, and Personalized Medical Approaches.Brain Sci. 2023 Jan 30;13(2):230. doi: 10.3390/brainsci13020230. Brain Sci. 2023. PMID: 36831773 Free PMC article.
-
[Dynamic trajectory and cell communication of different cell clusters in malignant progression of glioblastoma].Beijing Da Xue Xue Bao Yi Xue Ban. 2024 Apr 18;56(2):199-206. doi: 10.19723/j.issn.1671-167X.2024.02.001. Beijing Da Xue Xue Bao Yi Xue Ban. 2024. PMID: 38595234 Free PMC article. Chinese.
-
Role of long pentraxin PTX3 in cancer.Clin Exp Med. 2023 Dec;23(8):4401-4411. doi: 10.1007/s10238-023-01137-7. Epub 2023 Jul 12. Clin Exp Med. 2023. PMID: 37438568 Review.
-
The diagnostic and prediction performance of MR diffusion kurtosis imaging in the glioma molecular classification: a systematic review and meta-analysis.Front Neurol. 2025 Apr 25;16:1543619. doi: 10.3389/fneur.2025.1543619. eCollection 2025. Front Neurol. 2025. PMID: 40352771 Free PMC article.
-
Extracellular vesicles: the "Trojan Horse" within breast cancer host microenvironments.Mol Cancer. 2025 Jun 23;24(1):183. doi: 10.1186/s12943-025-02358-y. Mol Cancer. 2025. PMID: 40551109 Free PMC article. Review.
References
-
- Goodenberger ML, Jenkins RB. Genetics of adult glioma. Cancer Genet. 2012;205(12):613‐621. - PubMed
Publication types
MeSH terms
Substances
LinkOut - more resources
Full Text Sources
Research Materials
Miscellaneous
