

The G20 emission projections to 2030 improved since the Paris Agreement, but only slightly
- PMID: 35855774
- PMCID: PMC9281192
- DOI: 10.1007/s11027-022-10018-5
The G20 emission projections to 2030 improved since the Paris Agreement, but only slightly
Abstract
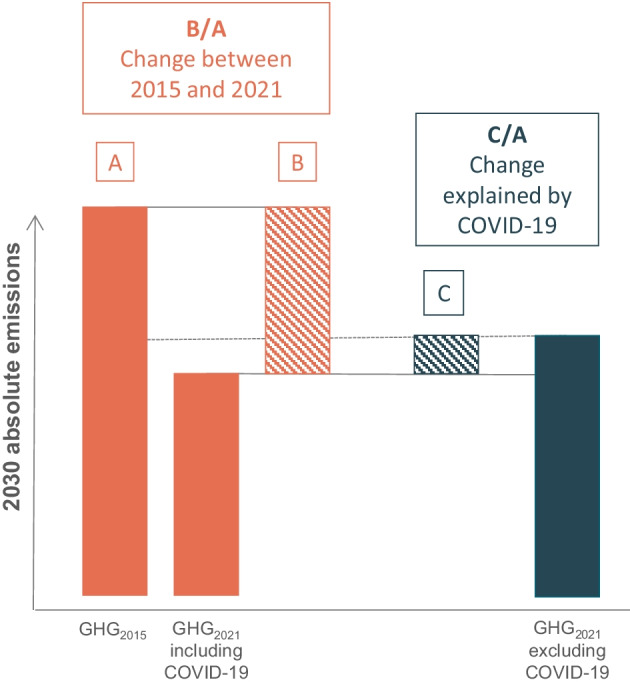
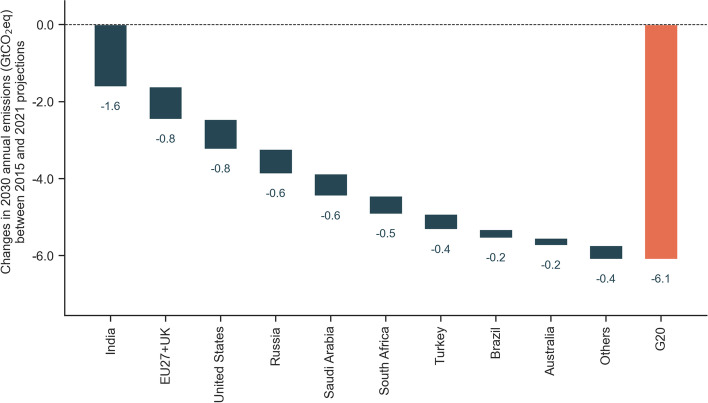
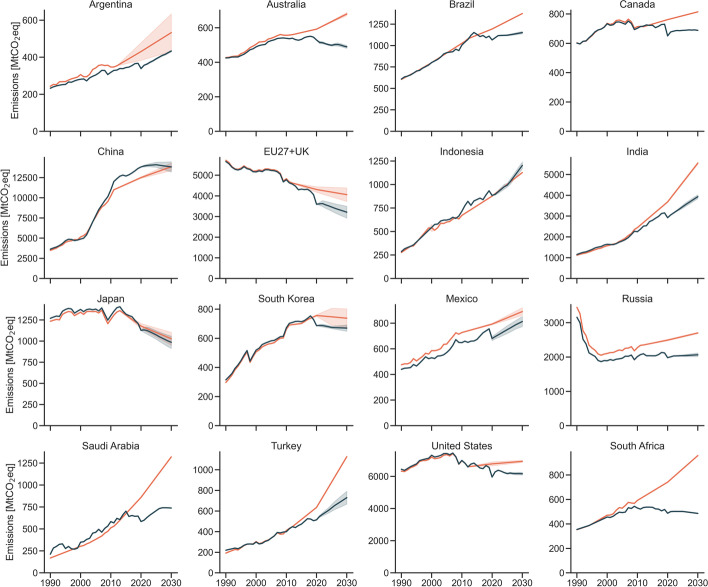
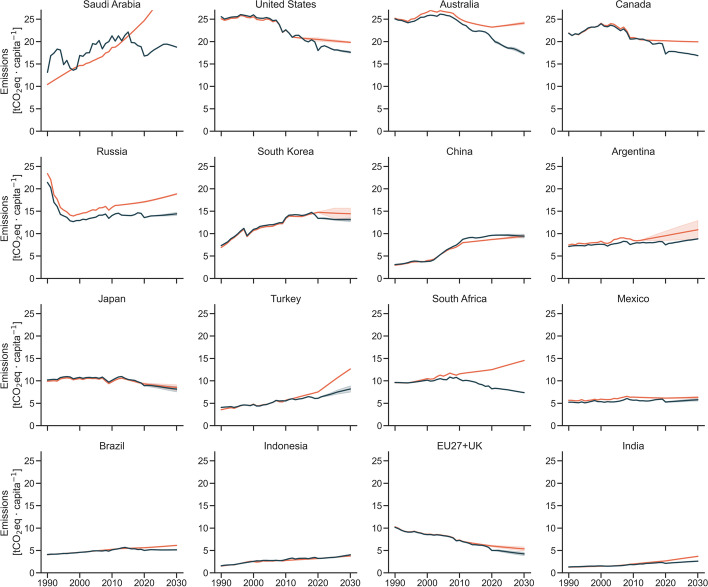
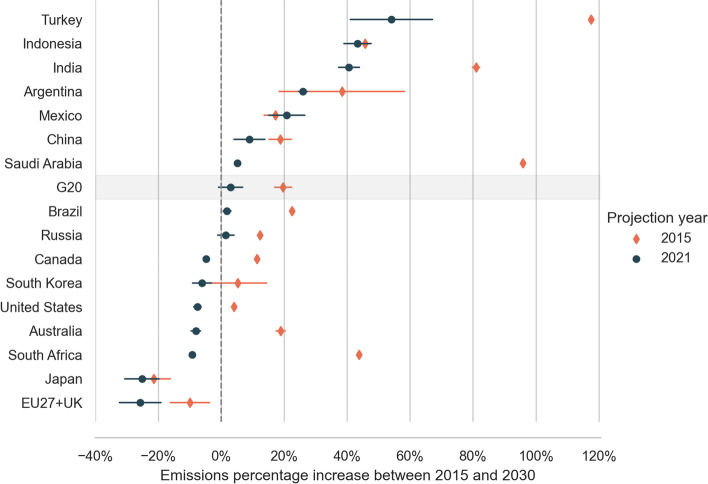
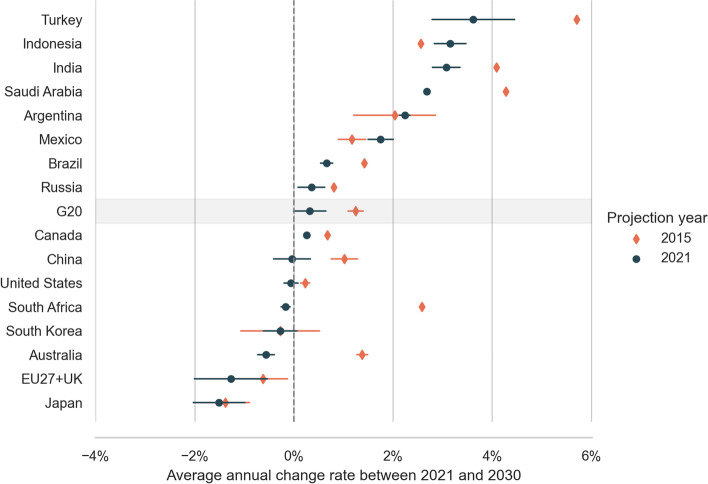
Many years passed since the adoption of the Paris Agreement, which invites countries to determine their own contributions to climate change mitigation efforts. The Agreement does not offer a standard to measure progress but relies on a process of periodic stocktakes to inform ambition-raising cycles. To contribute to this process, we compare 2021 greenhouse gas emission projections up to 2030 against equivalent projections prepared back in 2015. Both sets of projections were prepared using the same bottom-up modelling approach that accounts for adopted policies at the time. We find that 2021 projections for the G20 as a group are almost 15% lower (approximately 6 GtCO2eq) in 2030 than projected in 2015. Annual emissions grow 1% slower in the coming decade than projected in 2015. This slower growth mostly stems from the adoption of new policies and updated expectations on technology uptake and economic growth. However, around one-quarter of these changes are explained by the effects of the COVID-19 pandemic on short-term emissions and economic forecasts. These factors combined result in substantially lower emission projections for India, the European Union plus the UK (EU27 + UK), the Unites States, Russia, Saudi Arabia, and South Africa. We observe a remarkable change in South African projections that changed from a substantial increase to now a decline, driven in part by the planned phase-out of most of its coal-based power. Emissions in India are projected to grow slower than in 2015 and in Indonesia faster, but emissions per capita in both countries remain below 5 tCO2eq in 2030, while those in the EU27 + UK decline faster than expected in 2015 and probably cross the 5 tCO2eq threshold before 2030. Projected emissions per capita in Australia, Canada, Saudi Arabia, and the United States are now lower than projected in 2015 but remain above 15 tCO2eq in 2030. Although emission projections for the G20 improved since 2015, collectively they still slightly increase until 2030 and remain insufficient to meet the Paris Agreement temperature goals. The G20 must urgently and drastically improve adopted policies and actions to limit the end-of-century warming to 1.5 °C.
Supplementary information: The online version contains supplementary material available at 10.1007/s11027-022-10018-5.
Keywords: Adopted policy scenario; Climate change mitigation; Climate policy; Greenhouse gas emissions; Paris Agreement; Stocktake.
© The Author(s) 2022.
Conflict of interest statement
Competing interestsThe authors declare no competing interests.
Figures
Similar articles
-
The 2023 Latin America report of the Lancet Countdown on health and climate change: the imperative for health-centred climate-resilient development.Lancet Reg Health Am. 2024 Apr 23;33:100746. doi: 10.1016/j.lana.2024.100746. eCollection 2024 May. Lancet Reg Health Am. 2024. PMID: 38800647 Free PMC article. Review.
-
Updated nationally determined contributions collectively raise ambition levels but need strengthening further to keep Paris goals within reach.Mitig Adapt Strateg Glob Chang. 2022;27(6):33. doi: 10.1007/s11027-022-10008-7. Epub 2022 Jun 21. Mitig Adapt Strateg Glob Chang. 2022. PMID: 35755269 Free PMC article.
-
A machine learning approach to carbon emissions prediction of the top eleven emitters by 2030 and their prospects for meeting Paris agreement targets.Sci Rep. 2025 Jun 3;15(1):19469. doi: 10.1038/s41598-025-04236-5. Sci Rep. 2025. PMID: 40461645 Free PMC article.
-
Uncertainties around net-zero climate targets have major impact on greenhouse gas emissions projections.Ann N Y Acad Sci. 2025 Feb;1544(1):209-222. doi: 10.1111/nyas.15285. Epub 2025 Jan 12. Ann N Y Acad Sci. 2025. PMID: 39799582 Free PMC article.
-
The Minderoo-Monaco Commission on Plastics and Human Health.Ann Glob Health. 2023 Mar 21;89(1):23. doi: 10.5334/aogh.4056. eCollection 2023. Ann Glob Health. 2023. PMID: 36969097 Free PMC article. Review.
Cited by
-
Expanding climate policy adoption improves national mitigation efforts.NPJ Clim Action. 2023;2(1):12. doi: 10.1038/s44168-023-00043-8. Epub 2023 Jun 9. NPJ Clim Action. 2023. PMID: 40476914 Free PMC article.
-
State-led climate action can cut emissions at near-federal costs but favors different technologies.Nat Commun. 2025 May 19;16(1):4635. doi: 10.1038/s41467-025-59696-0. Nat Commun. 2025. PMID: 40389458 Free PMC article.
References
-
- Gütschow J, Günther A, Pflüger M (2021) The PRIMAP-hist national historical emissions time series v2.3 (1750-2019). 10.5281/zenodo.5175154
-
- Aklin M, Urpelainen J. Political competition, path dependence, and the strategy of sustainable energy transitions. Am J Pol Sci. 2013;57(3):643–658. doi: 10.1111/ajps.12002. - DOI
-
- Australian Government (2015) Australia’s emissions projections 2014–15 (Issue March). Department of the Environment. https://www.industry.gov.au/data-and-publications/australias-emissions-p.... Accessed 3 Mar 2022
-
- Australian Government (2021) Australia’s emissions projections 2021 (Issue October). Department of Industry Science Energy Resources. https://www.industry.gov.au/data-and-publications/australias-emissions-p.... Accessed 3 Mar 2022
Grants and funding
LinkOut - more resources
Full Text Sources