. 2022 Jul 9:2022:9069825.
doi: 10.1155/2022/9069825. eCollection 2022.

Activation of SIRT1 Alleviates Ferroptosis in the Early Brain Injury after Subarachnoid Hemorrhage

Affiliations

Activation of SIRT1 Alleviates Ferroptosis in the Early Brain Injury after Subarachnoid Hemorrhage

Bin Yuan et al. Oxid Med Cell Longev. .

Abstract

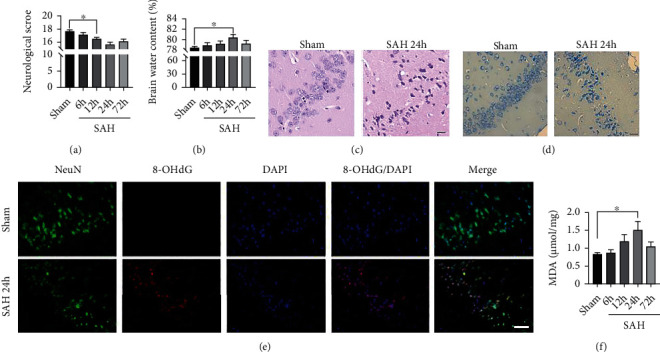
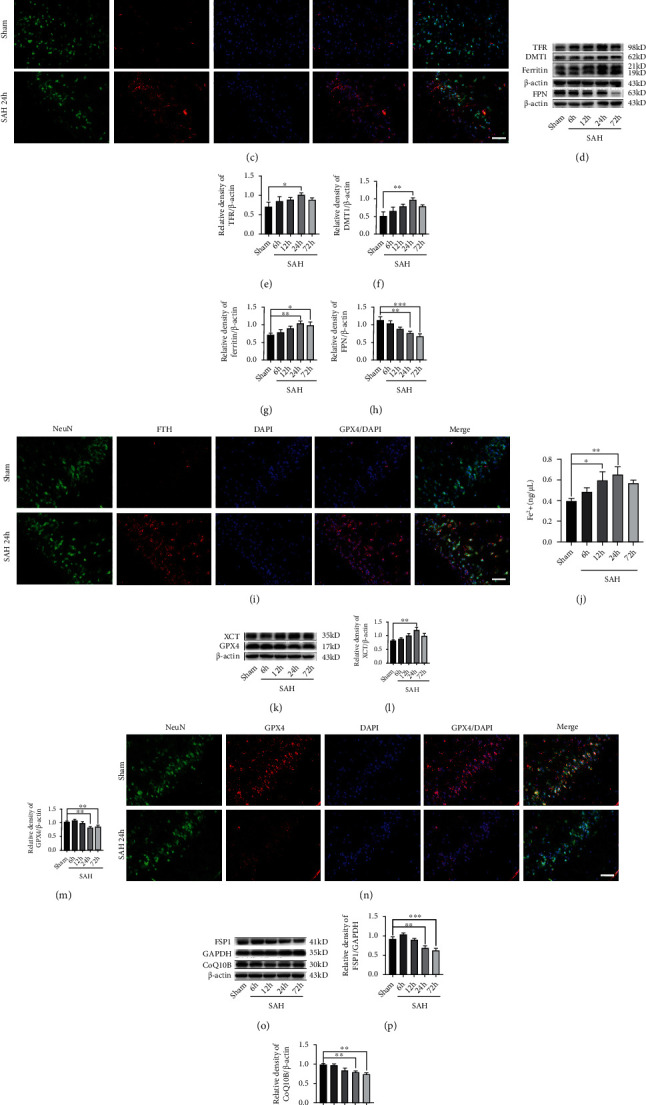
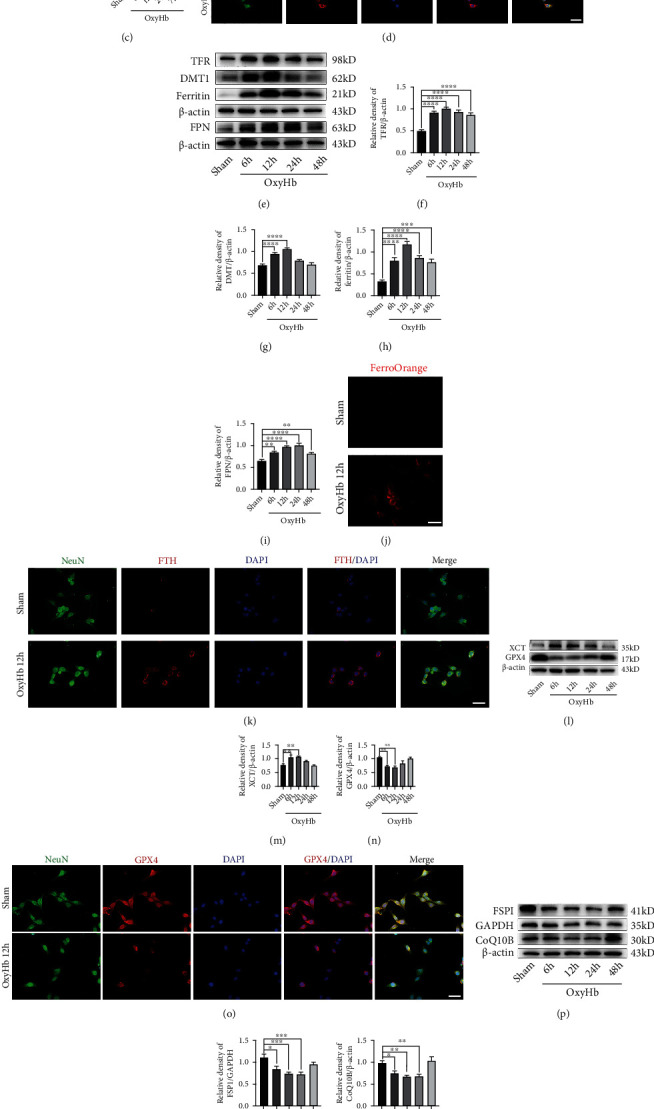
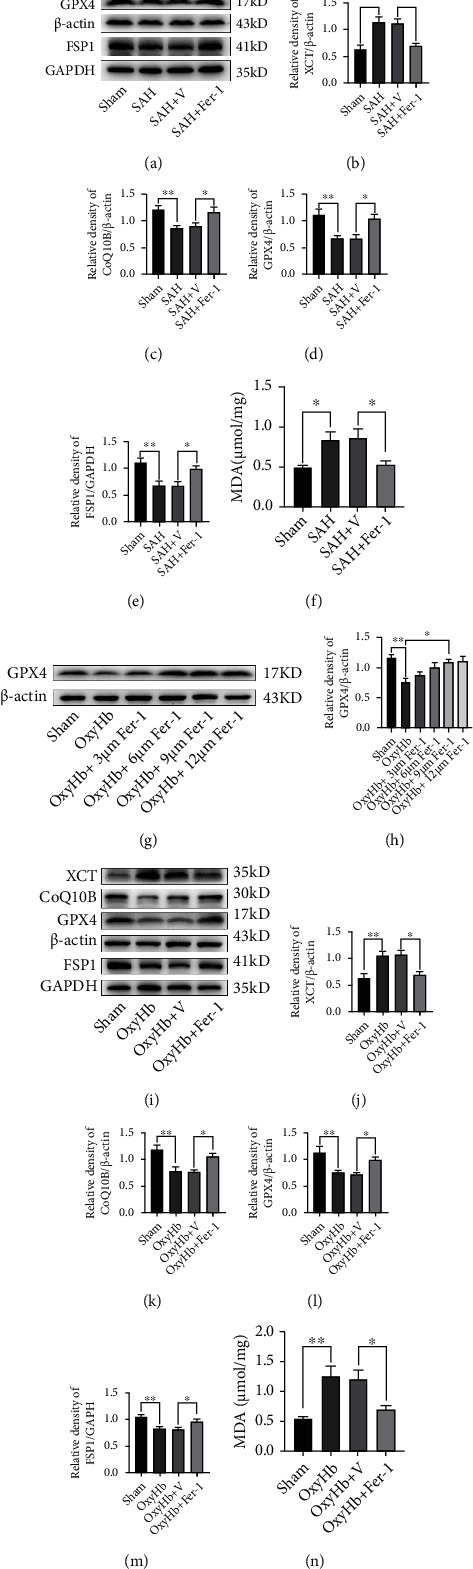
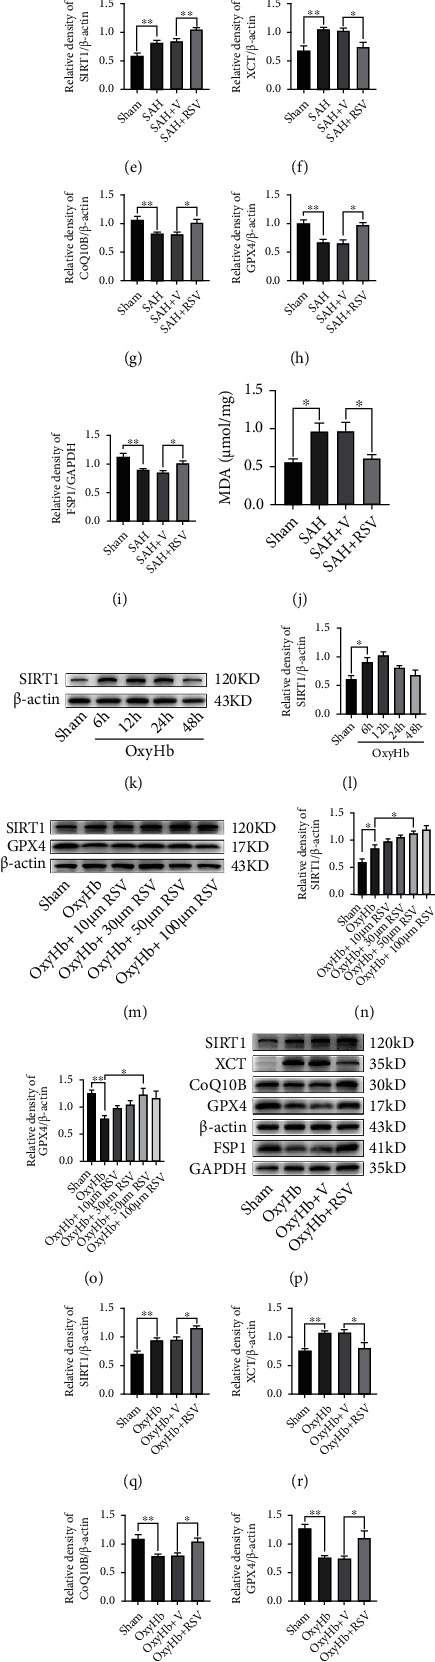
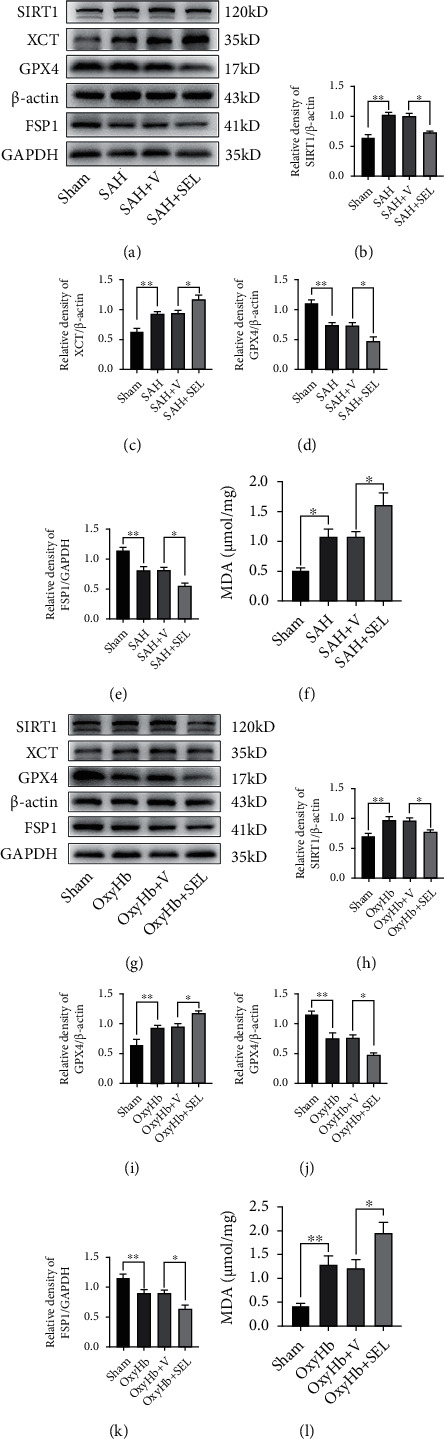
Ferroptosis is a regulated cell death that characterizes the lethal lipid peroxidation and iron overload, which may contribute to early brain injury (EBI) pathogenesis after subarachnoid hemorrhage (SAH). Although Sirtuin 1 (SIRT1), a class III histone deacetylase, has been proved to have endogenous neuroprotective effects on the EBI following SAH, the role of SIRT1 in ferroptosis has not been studied. Hence, we designed the current study to determine the role of ferroptosis in the EBI and explore the correlation between SIRT1 and ferroptosis after SAH. The pathways of ferroptosis were examined after experimental SAH in vivo (prechiasmatic cistern injection mouse model) and in HT-22 cells stimulated by oxyhemoglobin (oxyHb) in vitro. Then, ferrostatin-1 (Fer-1) was used further to determine the role of ferroptosis in EBI. Finally, we explored the correlation between SIRT1 and ferroptosis via regulating the expression of SIRT1 by resveratrol (RSV) and selisistat (SEL). Our results showed that ferroptosis was involved in the pathogenesis of EBI after SAH through multiple pathways, including acyl-CoA synthetase long-chain family member 4 (ACSL4) activation, iron metabolism disturbance, and the downregulation of glutathione peroxidase 4 (GPX4) and ferroptosis suppressor protein 1 (FSP1). Inhibition of ferroptosis by Fer-1 significantly alleviated oxidative stress-mediated brain injury. SIRT1 activation could suppress SAH-induced ferroptosis by upregulating the expression of GPX4 and FSP1. Therefore, ferroptosis could be a potential therapeutic target for SAH, and SIRT1 activation is a promising method to inhibit ferroptosis.


Conflict of interest statement

The authors declared that there is no conflict of interest regarding the publication of this paper.

Figures

Figure 1
Figure 1
Oxidative damage increased after SAH in the temporal cortex. (a) Quantitative analysis of neurological scores. (b) Quantitative analysis of brain water content. (c, d) Representative images of H&E (c) and Nissl (d) staining at 24 h post-SAH. Scale bars = 20 μm. (e) Representative images of IF staining for 8-OHdG. Scale bars = 50 μm. (f) Quantitative analysis of MDA. n = 6/group. Bars represent the mean ± SEM. P < 0.05 and ∗∗P < 0.01. H&E: hematoxylin and eosin; MDA: malondialdehyde; 8-OHdG: 8-hydroxyguanosine.
Figure 2
Figure 2
Ferroptosis-related pathways activated in the temporal cortex after SAH. (a) Western blotting assay for ACSL4 expression in the temporal cortex after SAH. (b) Quantification of ACSL4 expression. (c) Representative images of IF staining for ACSL4. (d) Western blotting assay for TFR, DMT1, ferritin, and FPN expression in the temporal cortex after SAH. (e–h) Quantification of the expression of TFR, DMT1, ferritin, and FPN. (i) Representative images of IF staining for FTH. (j) Quantification of ferrous iron content. (k) Western blotting assay for XCT and GPX4 expression. (l, m) Quantification of the expression of XCT and GPX4. (n) Representative images of IF staining for GPX4. (o) Western blotting assay for FSP1 and CoQ10B expression. (p, q) Quantification of the expression of FSP1 and CoQ10B. n = 6/group. Bars represent the mean ± SEM. P < 0.05, ∗∗P < 0.01, and ∗∗∗P < 0.001. Scale bars = 50 μm. ASCL4: acyl-CoA synthetase long-chain family member 4; TFR: transferrin receptor; DMT1: divalent metal transporter 1; FPN: ferroportin; FTH: ferritin heavy chain; GPX4: glutathione peroxidase 4; FSP1: ferroptosis suppressor protein 1.
Figure 3
Figure 3
Ferroptosis-related pathways activated in HT-22 cells exposed to oxyHb. (a) Representative images of TEM. (b) Western blotting assay for ACSL4 expression in all groups. (c) Quantification of the expression of ACSL4. (d) Representative images of IF staining for ACSL4. (e) Western blotting assay for TFR, DMT1, ferritin, and FPN expression. (f–i) Quantification of TFR, DMT1, ferritin, and FPN expression. (j) Representative images of ferrous iron staining. (k) Representative images of IF staining for FTH. (l) Western blotting assay for XCT and GPX4 expression in all groups. (m, n) Quantification of XCT and GPX4 expression. (o) Representative images of IF staining for GPX4. (p) Western blotting assay for FSP1 and CoQ10B expression in all groups. (q, r) Quantification of the expression of FSP1 and CoQ10B. (s) Quantitative analysis of MDA. n = 6/group. Bars represent the mean ± SEM. P < 0.05, ∗∗P < 0.01, ∗∗∗P < 0.001, and ∗∗∗∗P < 0.0001. Scale bars = 50 μm. TEM: transmission electron microscope; ASCL4: acyl-CoA synthetase long-chain family member 4; TFR: transferrin receptor; DMT1: divalent metal transporter 1; FPN: ferroportin; FTH: ferritin heavy chain; GPX4: glutathione peroxidase 4; FSP1: ferroptosis suppressor protein 1; MDA: malondialdehyde.
Figure 4
Figure 4
Inhibition of ferroptosis by Fer-1 alleviated oxidative stress-induced brain injury via upregulating the expression of GPX4. (a) Western blotting assay for XCT, GPX4, CoQ10B, and FSP1 expression in different groups in vivo. (b–e) Quantification of the expression of XCT, GPX4, CoQ10B, and FSP1. (f) Quantitative analysis of MDA in different groups in vivo. (g) Western blotting assay for the expression of GPX4 in all groups with different doses. (h) Quantification of GPX4 expression. (i) Western blotting assay for the expression of XCT, GPX4, CoQ10B, and FSP1 in different groups in vitro. (j–m) Quantification of the expression of XCT, GPX4, CoQ10B, and FSP1. (n) Quantitative analysis of MDA. n = 6/group. Bars represent the mean ± SEM. P < 0.05 and ∗∗P < 0.01. GPX4: glutathione peroxidase 4; FSP1: ferroptosis suppressor protein 1; MDA: malondialdehyde.
Figure 5
Figure 5
SRIT1 activation by RSV inhibited ferroptosis following SAH in vivo and in vitro. (a) Western blotting assay for SIRT1 expression in the temporal cortex after SAH. (b) Quantification of SIRT1 expression. (c) Representative images of IF staining for SIRT1. (d) Western blotting assay for SIRT1, XCT, GPX4, CoQ10B, and FSP1 expression in different groups in vivo. (e–i) Quantification of SIRT1, XCT, GPX4, CoQ10B, and FSP1 expression. (j) Quantitative analysis of MDA in different groups in vivo. (k) Western blotting assay for SIRT1 expression in all groups in vitro. (l) Quantification of the expression of SIRT1. (m) Western blotting assay for SIRT1 and GPX4 expression in all groups with different doses. (n, o) Quantification of the expression of SIRT1 and GPX4. (p) Western blotting assay for SIRT1, XCT, GPX4, CoQ10B, and FSP1 expression in different groups in vitro. (q–u) Quantification of the expression of SIRT1, XCT, GPX4, CoQ10B, and FSP1. (v) Quantitative analysis of MDA. n = 6/group. Bars represent the mean ± SEM. Scale bars = 50 μm. P < 0.05 and ∗∗P < 0.01. RSV: resveratrol; GPX4: glutathione peroxidase 4; FSP1: ferroptosis suppressor protein 1; MDA: malondialdehyde.
Figure 6
Figure 6
SRIT1 inhibition by SEL aggravated ferroptosis following SAH in vivo and in vitro. (a) Western blotting assay for SIRT1, XCT, GPX4, and FSP1 expression in different groups in vivo. (b–e) Quantification of the expression of SIRT1, XCT, GPX4, and FSP1. (f) Quantitative analysis of MDA in different groups in vivo. (g) Western blotting assay for SIRT1, XCT, GPX4, and FSP1 expression in different groups in vitro. (h–k) Quantification of the expression of SIRT1, XCT, GPX4, and FSP1. (l) Quantitative analysis of MDA. n = 6/group. Bars represent the mean ± SEM. P < 0.05 and ∗∗P < 0.01. SEL: selisistat; GPX4: glutathione peroxidase 4; FSP1: ferroptosis suppressor protein 1; MDA: malondialdehyde.

Similar articles

Cited by

References

    1. Neifert S. N., Chapman E. K., Martini M. L., et al. Aneurysmal subarachnoid hemorrhage: the last decade. Translational Stroke Research . 2021;12(3):428–446. doi: 10.1007/s12975-020-00867-0. - DOI - PubMed
    1. Coulibaly A. P., Provencio J. J. Aneurysmal subarachnoid hemorrhage: an overview of inflammation-induced cellular changes. Neurotherapeutics . 2020;17(2):436–445. doi: 10.1007/s13311-019-00829-x. - DOI - PMC - PubMed
    1. Rahman M. M., Islam M., Islam M., et al. Stem cell transplantation therapy and neurological disorders: current status and future perspectives. Biology (Basel) . 2022;11(1):p. 147. doi: 10.3390/biology11010147. - DOI - PMC - PubMed
    1. Bhattacharya T., Soares G. A. B. ., Chopra H., et al. Applications of phyto-nanotechnology for the treatment of neurodegenerative disorders. Materials (Basel) . 2022;15(3):p. 804. doi: 10.3390/ma15030804. - DOI - PMC - PubMed
    1. Rahman M. M., Islam F., Parvez A., et al. Citrus limon L. (lemon) seed extract shows neuro-modulatory activity in an in vivo thiopental-sodium sleep model by reducing the sleep onset and enhancing the sleep duration. Journal of Integrative Neuroscience . 2022;21(1):p. 42. doi: 10.31083/j.jin2101042. - DOI - PubMed