

'Everything is data': towards one big data ecosystem using multiple sources of data on higher education in Indonesia
- PMID: 35855913
- PMCID: PMC9281197
- DOI: 10.1186/s40537-022-00639-7
'Everything is data': towards one big data ecosystem using multiple sources of data on higher education in Indonesia
Abstract
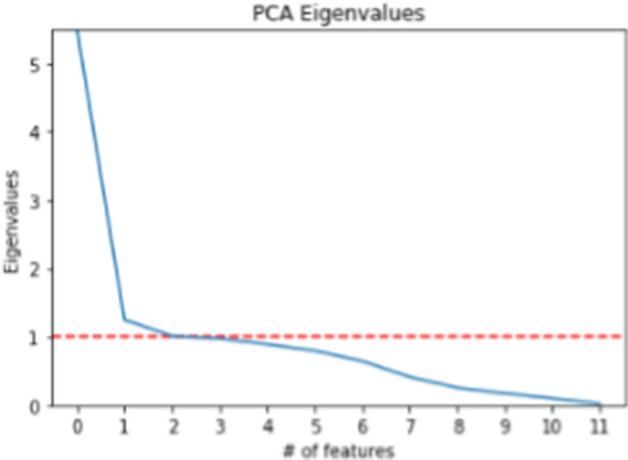
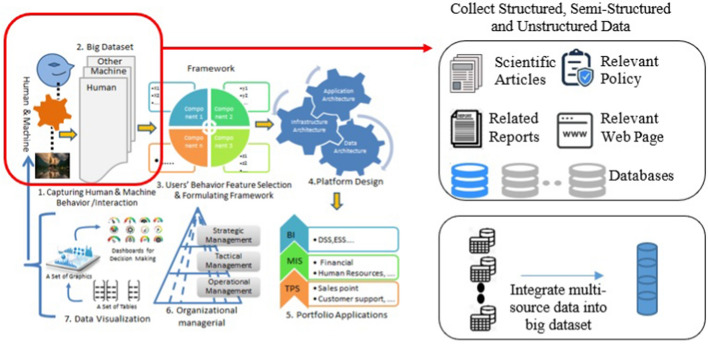
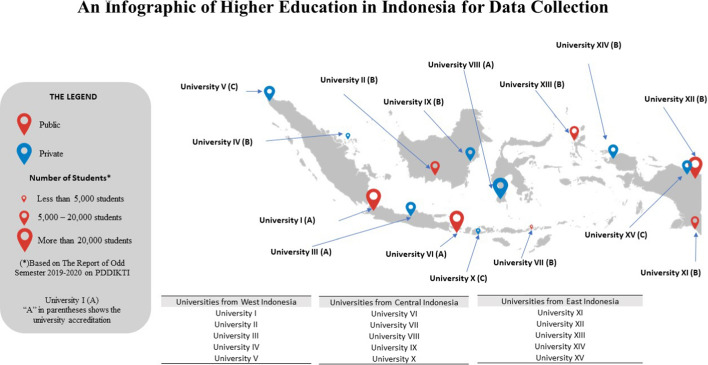
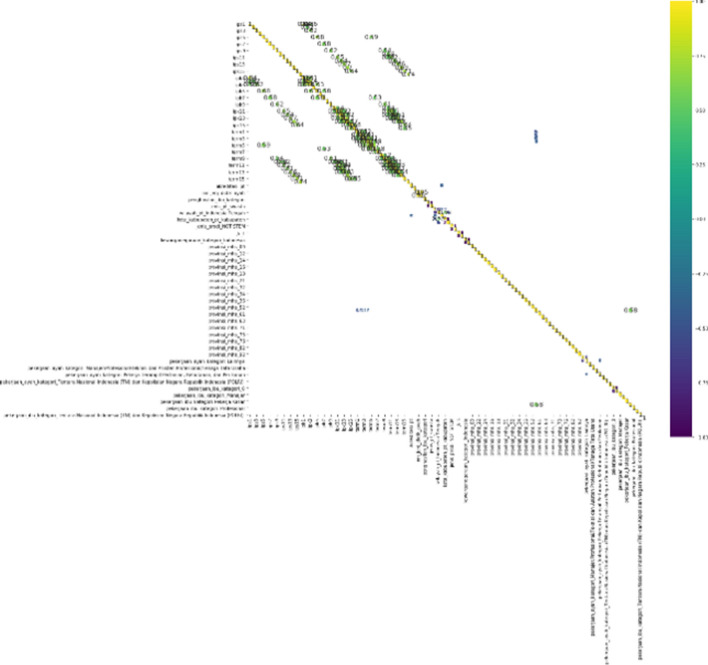
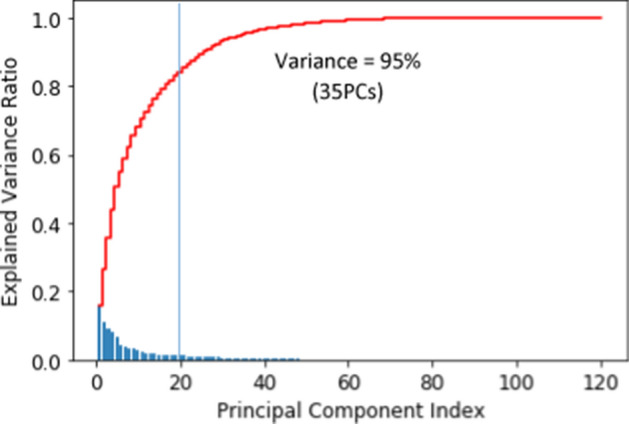
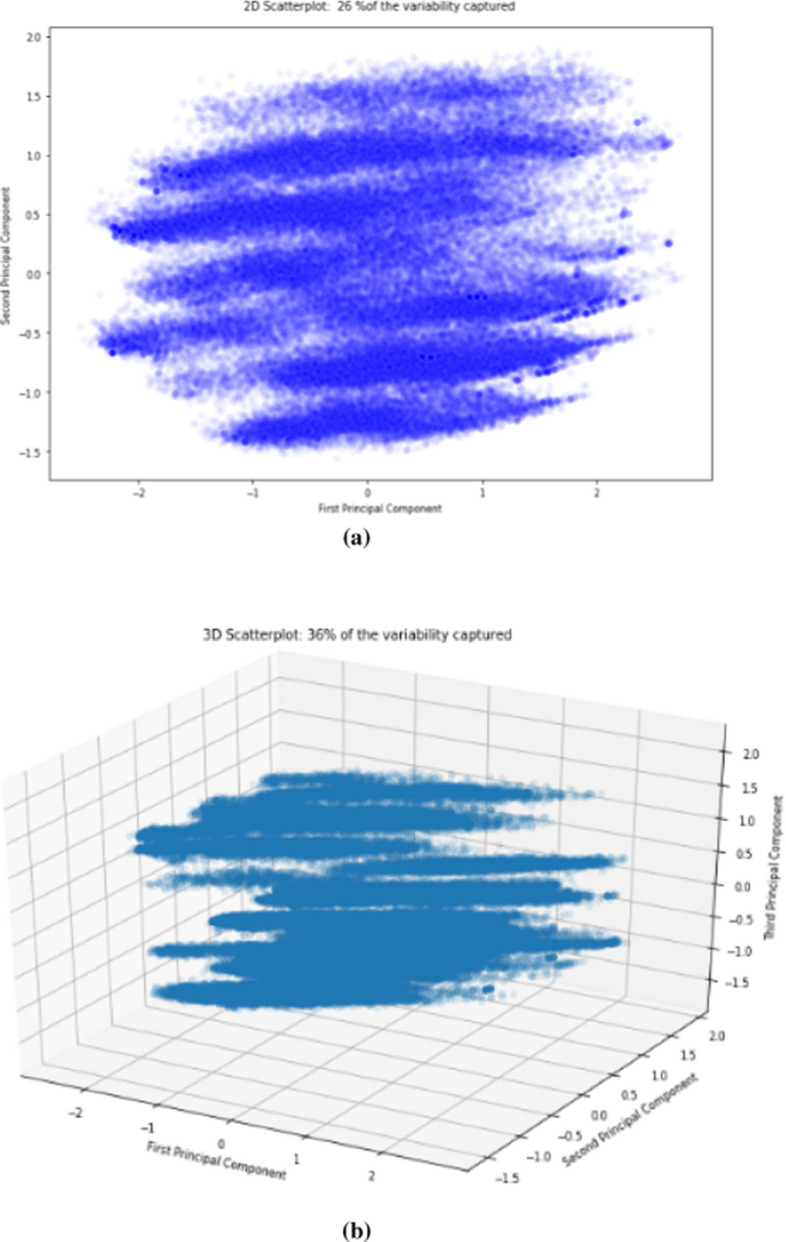
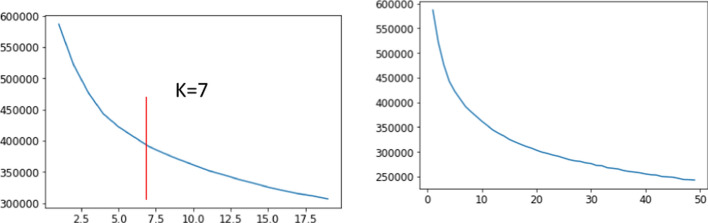
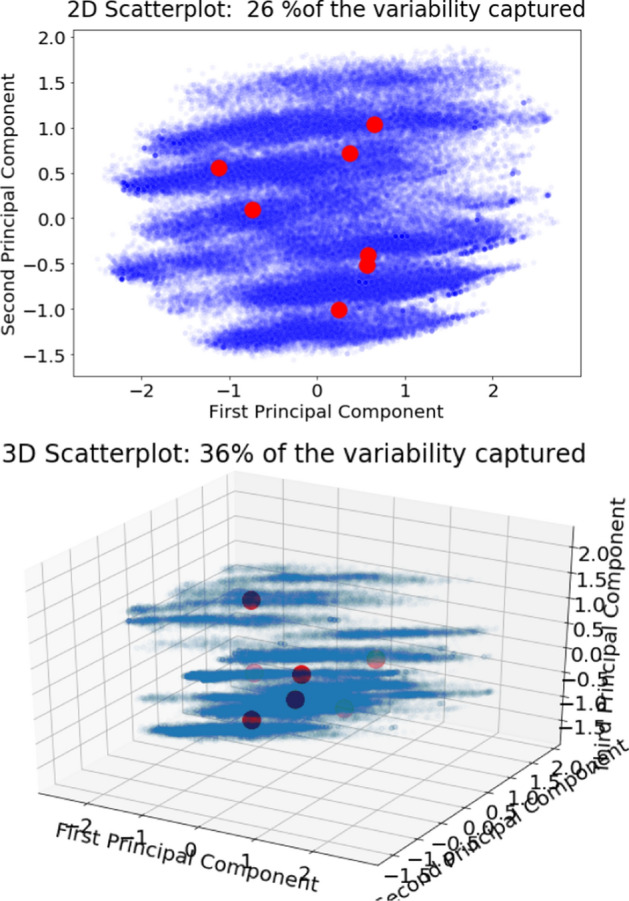
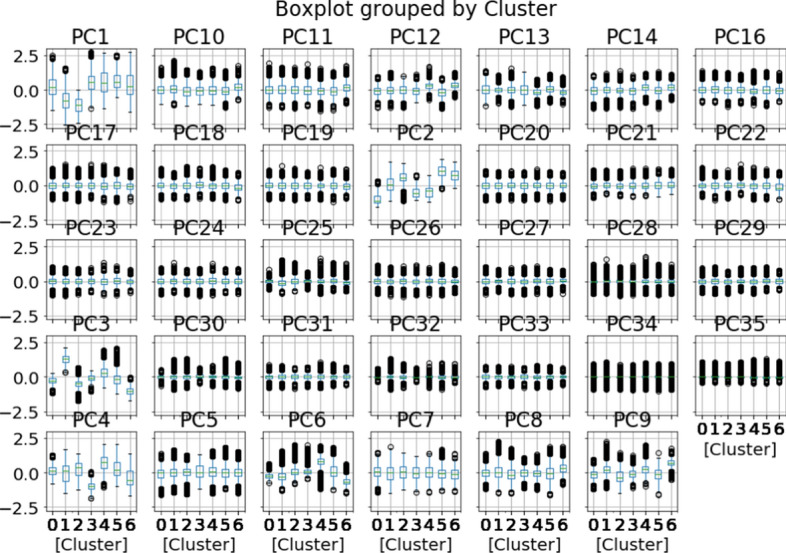
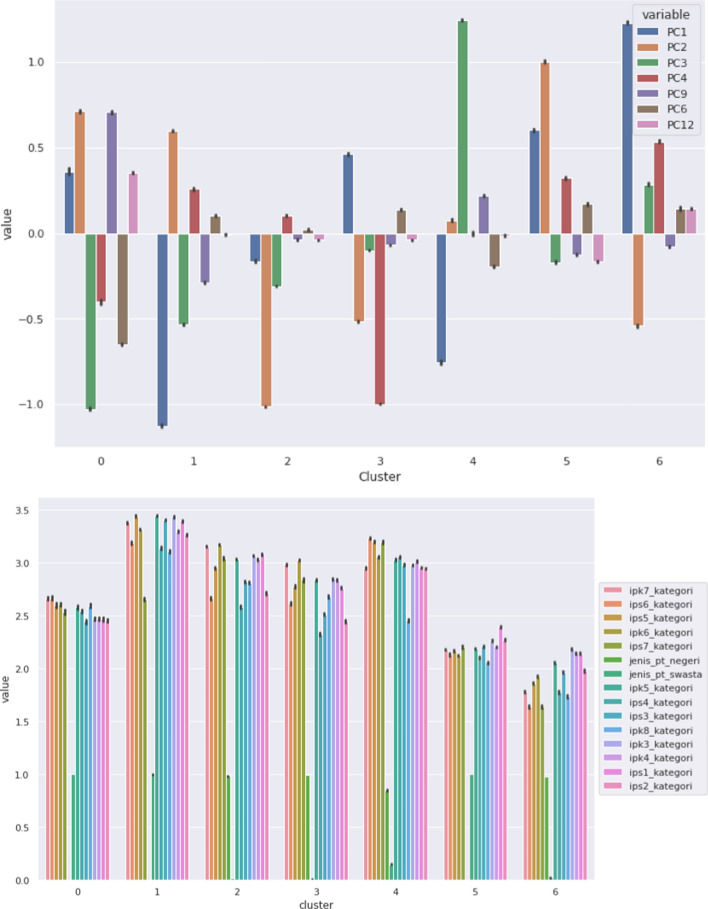
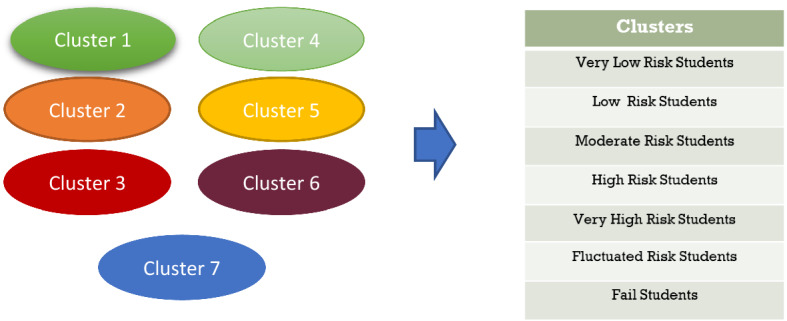
Big data is increasingly being promoted as a game changer for the future of science, as the volume of data has exploded in recent years. Big data characterized, among others, the data comes from multiple sources, multi-format, comply to 5-V's in nature (value, volume, velocity, variety, and veracity). Big data also constitutes structured data, semi-structured data, and unstructured-data. These characteristics of big data formed "big data ecosystem" that have various active nodes involved. Regardless such complex characteristics of big data, the studies show that there exists inherent structure that can be very useful to provide meaningful solutions for various problems. One of the problems is anticipating proper action to students' achievement. It is common practice that lecturer treat his/her class with "one-size-fits-all" policy and strategy. Whilst, the degree of students' understanding, due to several factors, may not the same. Furthermore, it is often too late to take action to rescue the student's achievement in trouble. This study attempted to gather all possible features involved from multiple data sources: national education databases, reports, webpages and so forth. The multiple data sources comprise data on undergraduate students from 13 provinces in Indonesia, including students' academic histories, demographic profiles and socioeconomic backgrounds and institutional information (i.e. level of accreditation, programmes of study, type of university, geographical location). Gathered data is furthermore preprocessed using various techniques to overcome missing value, data categorisation, data consistency, data quality assurance, to produce relatively clean and sound big dataset. Principal component analysis (PCA) is employed in order to reduce dimensions of big dataset and furthermore use K-Means methods to reveal clusters (inherent structure) that may occur in that big dataset. There are 7 clusters suggested by K-Means analysis: 1. very low-risk students, 2. low-risk students, 3. moderate-risk students, 4. fluctuating-risk students, 5. high risk students, 6. very high-risk students and, 7. fail students. Among the clusters unreveal, (1) a gap between public universities and private universities across the three regions in Indonesia, (2) a gap between STEM and non-STEM programmes of study, (3) a gap between rural versus urban, (4) a gap of accreditation status, (5) a gap of quality human resources distribution, etc. Further study, we will use the characteristics of each cluster to predict students' achievement based on students' profiles, and provide solutions and interventions strategies for students to improve their likely success.
Keywords: Big data; Data collection; Data preprocessing; Higher education; Indonesia.
© The Author(s) 2022.
Conflict of interest statement
Competing interestsThe authors declare that they have no competing interests.
Figures
Similar articles
-
Impact of summer programmes on the outcomes of disadvantaged or 'at risk' young people: A systematic review.Campbell Syst Rev. 2024 Jun 13;20(2):e1406. doi: 10.1002/cl2.1406. eCollection 2024 Jun. Campbell Syst Rev. 2024. PMID: 38873396 Free PMC article. Review.
-
Recovery schools for improving behavioral and academic outcomes among students in recovery from substance use disorders: a systematic review.Campbell Syst Rev. 2018 Oct 4;14(1):1-86. doi: 10.4073/csr.2018.9. eCollection 2018. Campbell Syst Rev. 2018. PMID: 37131375 Free PMC article.
-
Small class sizes for improving student achievement in primary and secondary schools: a systematic review.Campbell Syst Rev. 2018 Oct 11;14(1):1-107. doi: 10.4073/csr.2018.10. eCollection 2018. Campbell Syst Rev. 2018. PMID: 37131395 Free PMC article.
-
School-based interventions for reducing disciplinary school exclusion: a systematic review.Campbell Syst Rev. 2018 Jan 9;14(1):i-216. doi: 10.4073/csr.2018.1. eCollection 2018. Campbell Syst Rev. 2018. PMID: 37131379 Free PMC article.
-
Public sector reforms and their impact on the level of corruption: A systematic review.Campbell Syst Rev. 2021 May 24;17(2):e1173. doi: 10.1002/cl2.1173. eCollection 2021 Jun. Campbell Syst Rev. 2021. PMID: 37131927 Free PMC article. Review.
References
-
- Rydning DR-JG-J, others. The digitization of the world from edge to core. Fram. Int. Data Corp. 2018 [cited 2021 Dec 25]. p. 16. https://www.seagate.com/files/www-content/our-story/trends/files/idc-sea...
-
- Wu C, Buyya R, Ramamohanarao K. Big data analytics = machine learning + cloud computing. In: Buyya R, Calheiros RN, Dastjerdi AV, editors. Big Data Princ Paradig. Morgan Kaufmann; 2016. pp. 1–13.
-
- Raut RD, Mangla SK, Narwane VS, Dora M, Liu M. Big Data Analytics as a mediator in Lean, Agile, Resilient, and Green (LARG) practices effects on sustainable supply chains. Transp Res Part E Logist Transp Rev. 2021;145:102170. doi: 10.1016/j.tre.2020.102170. - DOI
-
- Anshari M, Almunawar MN, Lim SA, Al-Mudimigh A. Customer relationship management and big data enabled: Personalization & customization of services. Appl Comput Informatics. 2019;15:94–101. doi: 10.1016/j.aci.2018.05.004. - DOI
-
- Aloqool A, Alharafsheh M, Abdellatif H, Alghasawneh LAS, Al-Gasawneh JA. The mediating role of customer relationship management between e-supply chain management and competitive advantage. Int J Data Netw Sci. 2022;6:263–272. doi: 10.5267/J.IJDNS.2021.9.002. - DOI
LinkOut - more resources
Full Text Sources
Miscellaneous