

Tumor antigens and immune subtypes of glioblastoma: the fundamentals of mRNA vaccine and individualized immunotherapy development
- PMID: 35855914
- PMCID: PMC9281265
- DOI: 10.1186/s40537-022-00643-x
Tumor antigens and immune subtypes of glioblastoma: the fundamentals of mRNA vaccine and individualized immunotherapy development
Abstract
Purpose: Glioblastoma (GBM) is the most common primary brain tumor in adults and is notorious for its lethality. Given its limited therapeutic measures and high heterogeneity, the development of new individualized therapies is important. mRNA vaccines have exhibited promising performance in a variety of solid tumors, those designed for glioblastoma (GBM) need further development. The aim of this study is to explore tumor antigens for the development of mRNA vaccines against GBM and to identify potential immune subtypes of GBM to identify the patients suitable for different immunotherapies.
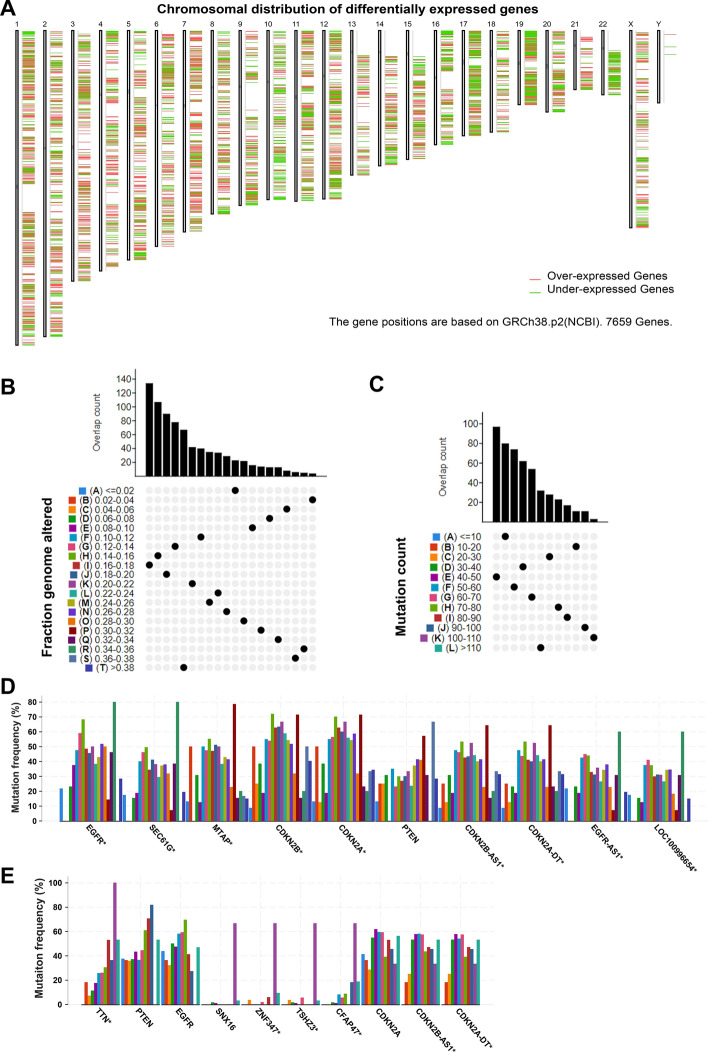
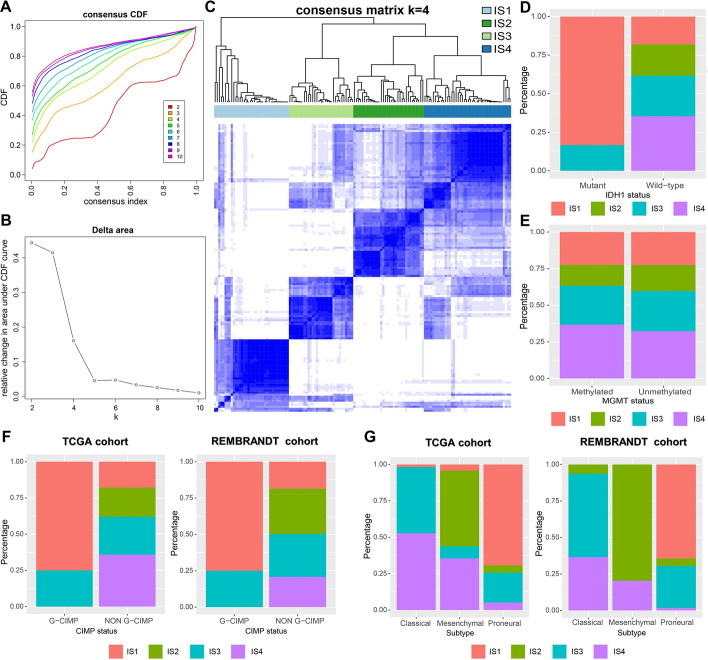
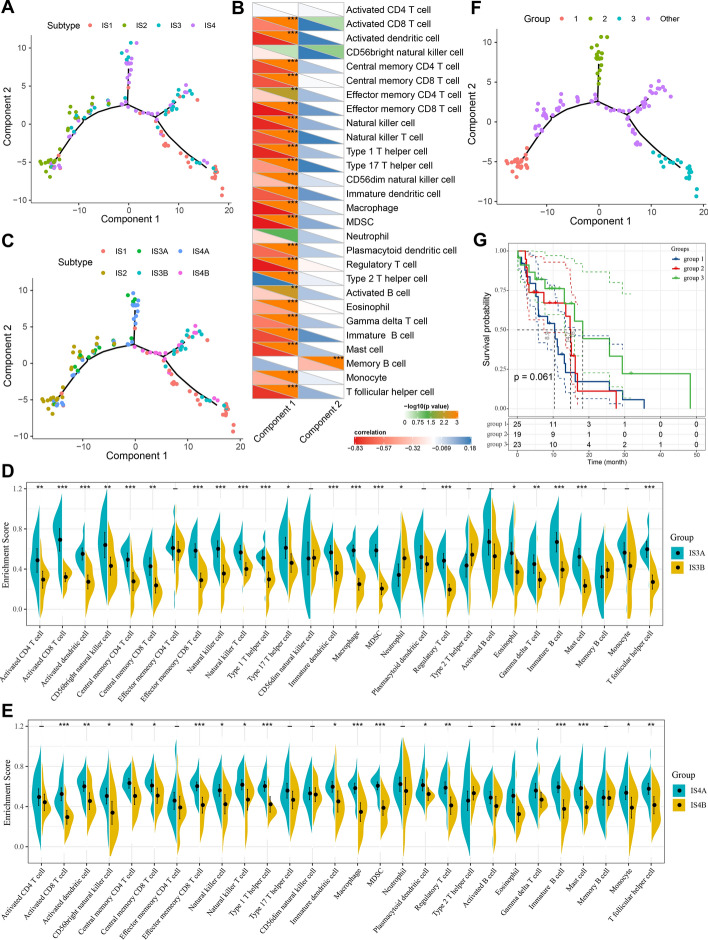
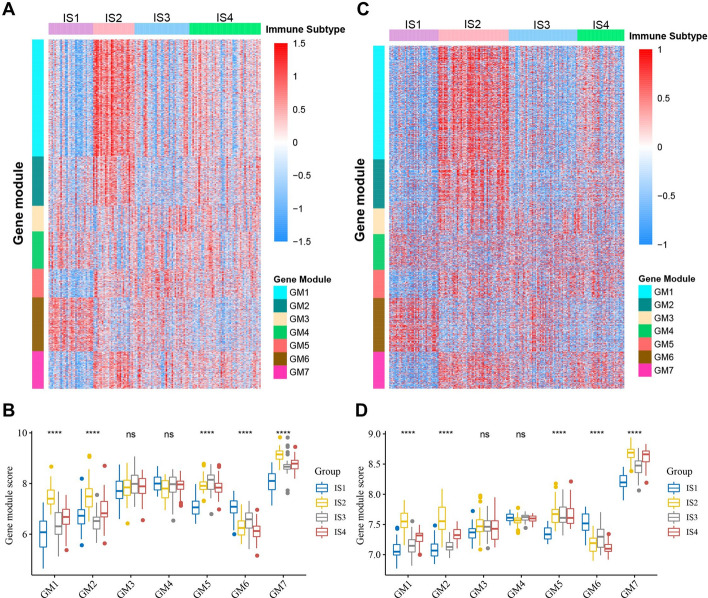
Methods: RNA-seq data and the clinical information of 143 GBM patients was extracted from the TCGA database; microarray data and the clinical information of 181 GBM patients was obtained from the REMBRANDT cohort. A GBM immunotherapy cohort of 17 patients was obtained from a previous literature. GEPIA2, cBioPortal, and TIMER2 were used to identify the potential tumor antigens. Immune subtypes and gene modules were identified using consensus clustering; immune landscape was constructed using graph-learning-based dimensionality reduction analysis.
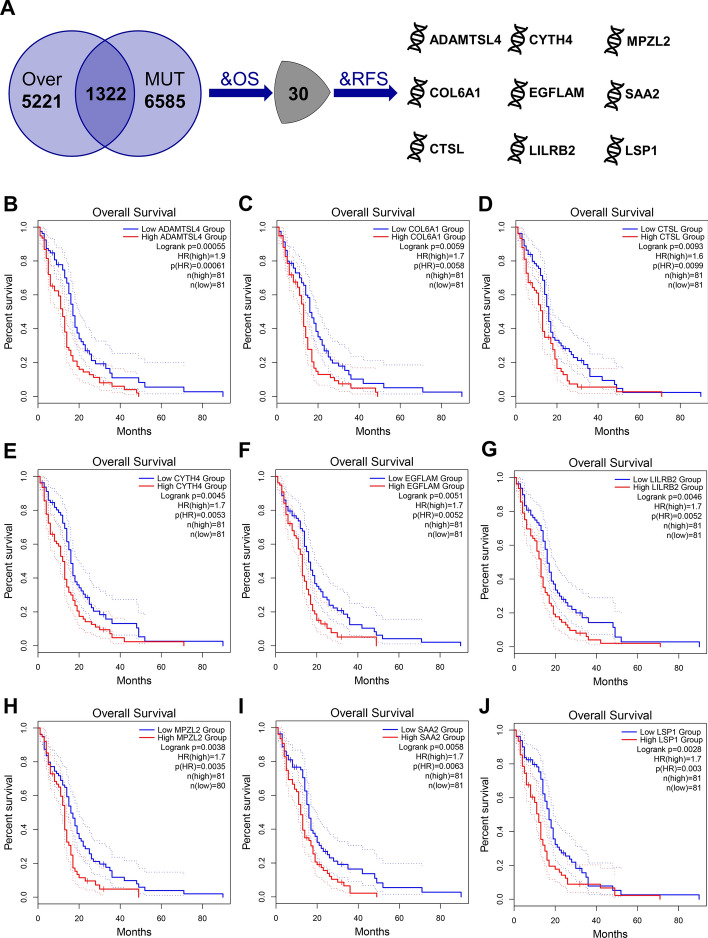
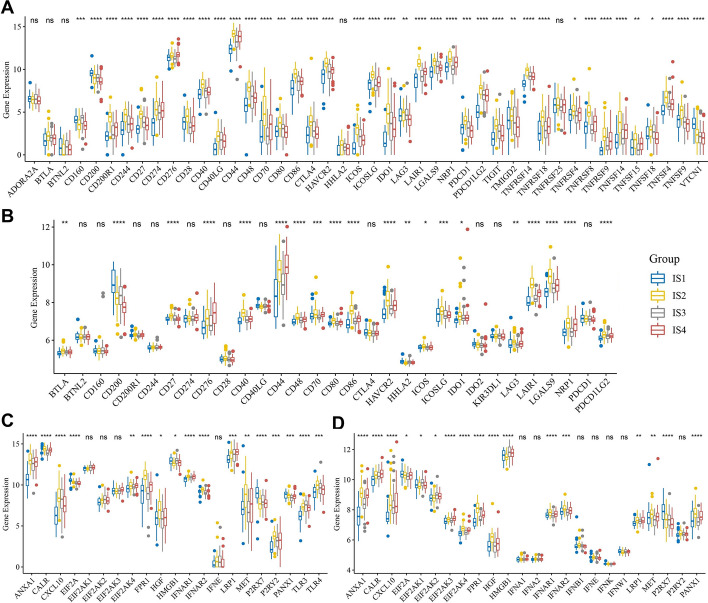
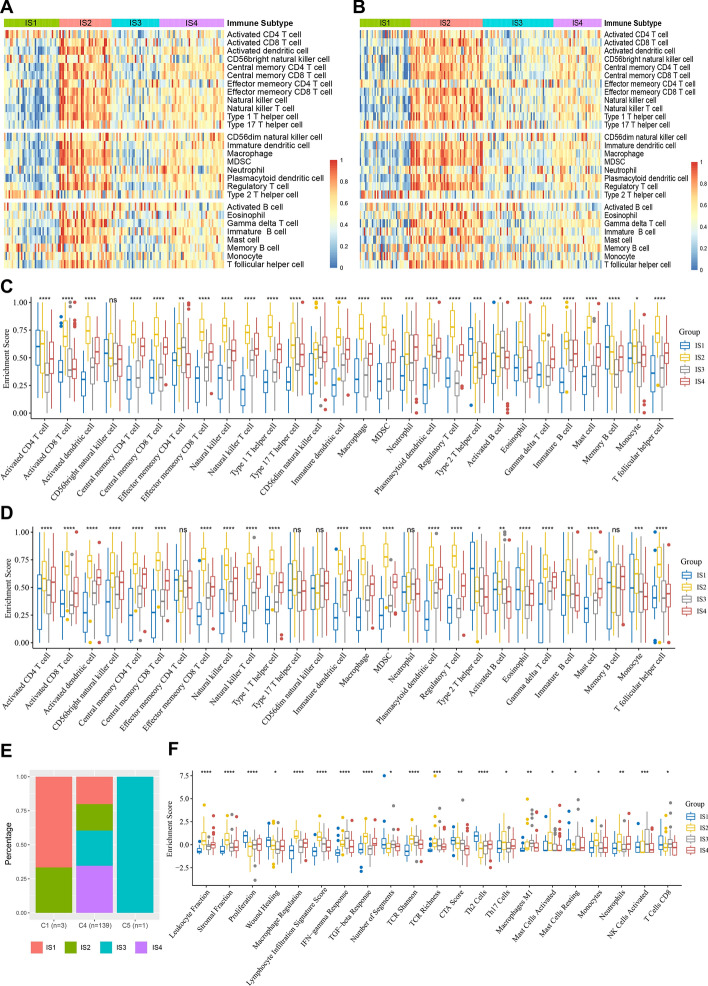
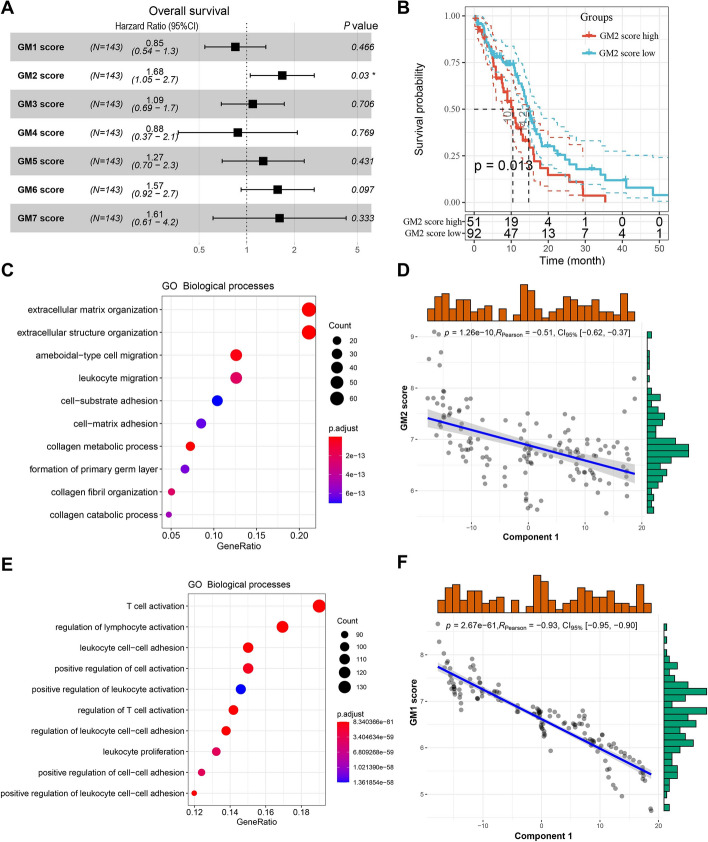
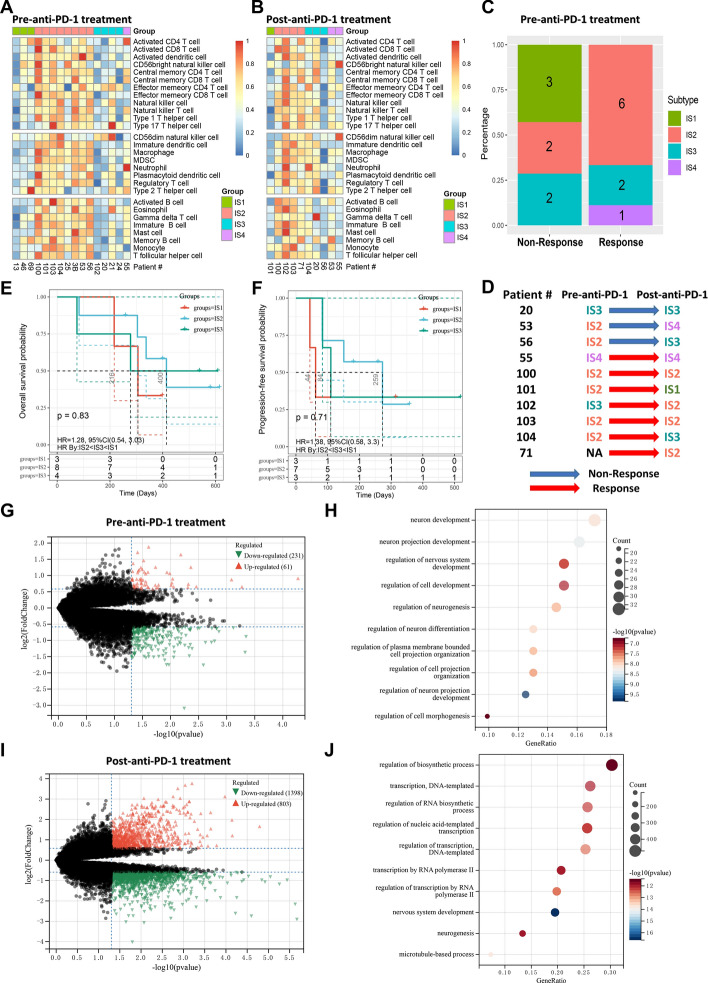
Results: Nine potential tumor antigens associated with poor prognosis and infiltration of antigen-presenting cells were identified in GBM: ADAMTSL4, COL6A1, CTSL, CYTH4, EGFLAM, LILRB2, MPZL2, SAA2, and LSP1. Four robust immune subtypes and seven functional gene modules were identified and validated in an independent cohort. Immune subtypes had different cellular and molecular characteristics, with IS1, an immune cold phenotype; IS2, an immune hot and immunosuppressive phenotype; IS3, a relatively immune cold phenotype, second only to IS1; IS4, having a moderate tumor immune microenvironment. Immune landscape revealed the immune distribution of the GBM patients. Additionally, the potential value of immune subtypes for individualized immunotherapy was demonstrated in a GBM immunotherapy cohort.
Conclusions: ADAMTSL4, COL6A1, CTSL, CYTH4, EGFLAM, LILRB2, MPZL2, SAA2, and LSP1 are the candidate tumor antigens for mRNA vaccine development in GBM, and IS1 GBM patients are best suited for mRNA vaccination, IS2 patients are best suited for immune checkpoint inhibitor. This study provides a theoretical framework for GBM mRNA vaccine development and individualized immunotherapy strategies.
Supplementary information: The online version contains supplementary material available at 10.1186/s40537-022-00643-x.
Keywords: Glioblastoma; Immune subtypes; Individualized immunotherapy; Tumor microenvironment; mRNA vaccines.
© The Author(s) 2022.
Conflict of interest statement
Competing interestsThe authors declared no potential conflicts of interest.
Figures
Similar articles
-
Dissecting Tumor Antigens and Immune Subtypes of Glioma to Develop mRNA Vaccine.Front Immunol. 2021 Aug 27;12:709986. doi: 10.3389/fimmu.2021.709986. eCollection 2021. Front Immunol. 2021. PMID: 34512630 Free PMC article.
-
Identification of Tumor Antigens and Immune Subtypes of Glioblastoma for mRNA Vaccine Development.Front Immunol. 2022 Feb 2;13:773264. doi: 10.3389/fimmu.2022.773264. eCollection 2022. Front Immunol. 2022. PMID: 35185876 Free PMC article.
-
Identification of tumor antigens and immune subtypes of cholangiocarcinoma for mRNA vaccine development.Mol Cancer. 2021 Mar 8;20(1):50. doi: 10.1186/s12943-021-01342-6. Mol Cancer. 2021. PMID: 33685460 Free PMC article.
-
Emerging immunotherapies for glioblastoma.Expert Opin Emerg Drugs. 2016 Jun;21(2):133-45. doi: 10.1080/14728214.2016.1186643. Expert Opin Emerg Drugs. 2016. PMID: 27223671 Free PMC article. Review.
-
Making a Cold Tumor Hot: The Role of Vaccines in the Treatment of Glioblastoma.Front Oncol. 2021 May 10;11:672508. doi: 10.3389/fonc.2021.672508. eCollection 2021. Front Oncol. 2021. PMID: 34041034 Free PMC article. Review.
Cited by
-
Identification of molecular subtypes and a risk model based on inflammation-related genes in patients with low grade glioma.Heliyon. 2023 Nov 17;9(12):e22429. doi: 10.1016/j.heliyon.2023.e22429. eCollection 2023 Dec. Heliyon. 2023. PMID: 38046156 Free PMC article.
-
Therapeutically targeting the unique disease landscape of pediatric high-grade gliomas.Front Oncol. 2024 Mar 8;14:1347694. doi: 10.3389/fonc.2024.1347694. eCollection 2024. Front Oncol. 2024. PMID: 38525424 Free PMC article. Review.
-
Comprehensive multi-omics pan-cancer analysis revealed EGFLAM as a potential prognostic and immune infiltration-associated biomarker.BMC Cancer. 2025 Jul 1;25(1):1109. doi: 10.1186/s12885-025-14519-9. BMC Cancer. 2025. PMID: 40597847 Free PMC article.
-
Exploring the Role of Immune Cells in Glioma: Causal Associations and Clinical Implications.Int J Med Sci. 2025 Jun 12;22(12):2973-2991. doi: 10.7150/ijms.116560. eCollection 2025. Int J Med Sci. 2025. PMID: 40657381 Free PMC article.
-
The Proteomic Landscape of Monocytes in Response to Colorectal Cancer Cells.J Proteome Res. 2024 Sep 6;23(9):4067-4081. doi: 10.1021/acs.jproteome.4c00400. Epub 2024 Aug 6. J Proteome Res. 2024. PMID: 39106312 Free PMC article.
References
LinkOut - more resources
Full Text Sources
Other Literature Sources
Miscellaneous