. 2022 Jun 30;25(8):104702.
doi: 10.1016/j.isci.2022.104702. eCollection 2022 Aug 19.

Dynamics of tumor-associated macrophages in a quantitative systems pharmacology model of immunotherapy in triple-negative breast cancer

Affiliations

Dynamics of tumor-associated macrophages in a quantitative systems pharmacology model of immunotherapy in triple-negative breast cancer

Hanwen Wang et al. iScience. .

Abstract

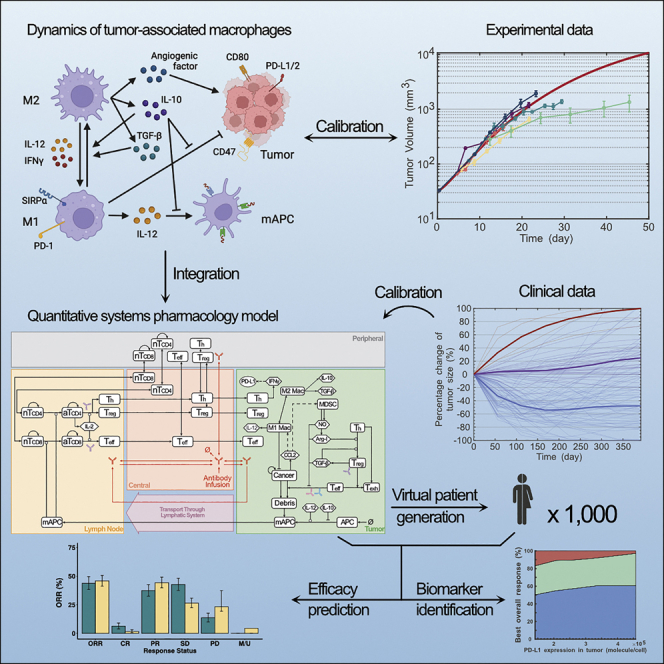
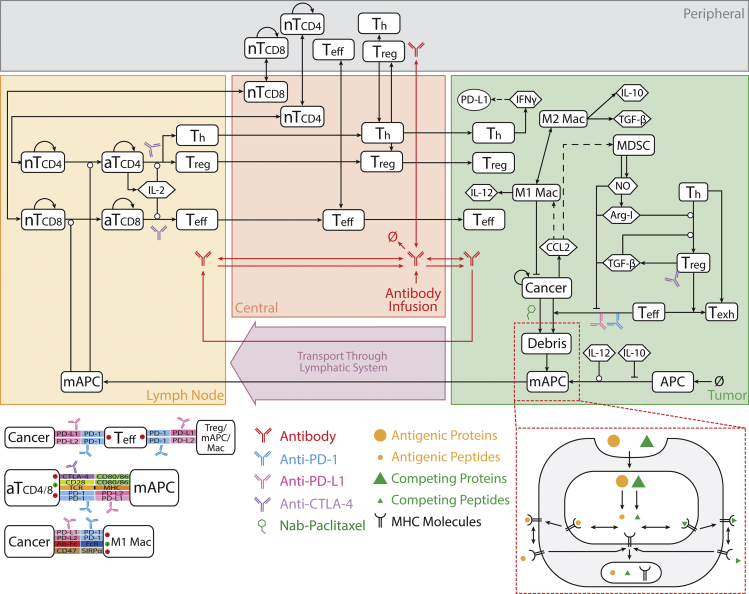
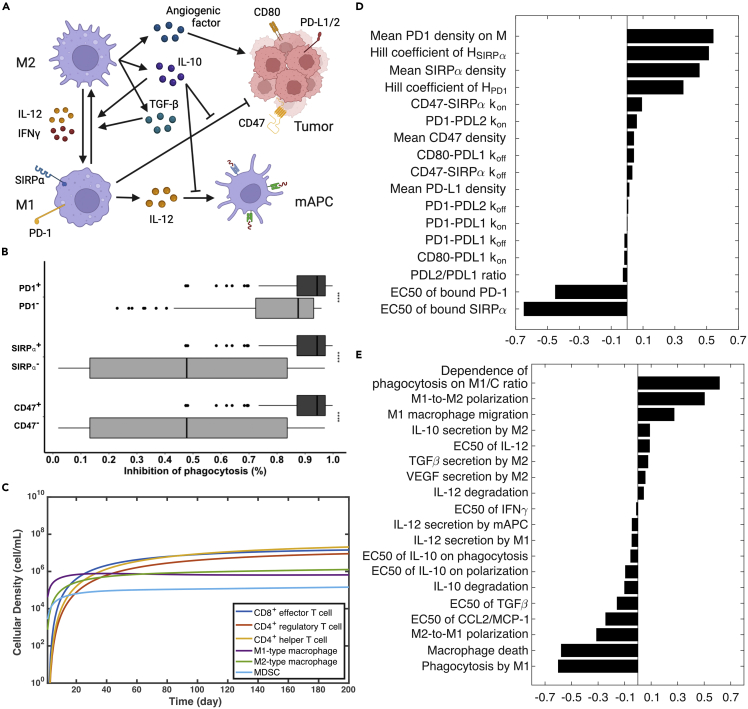
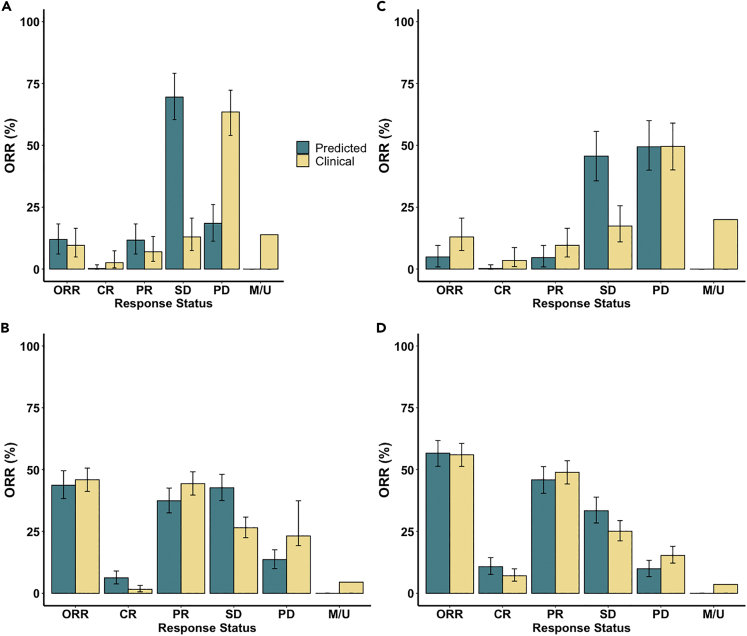
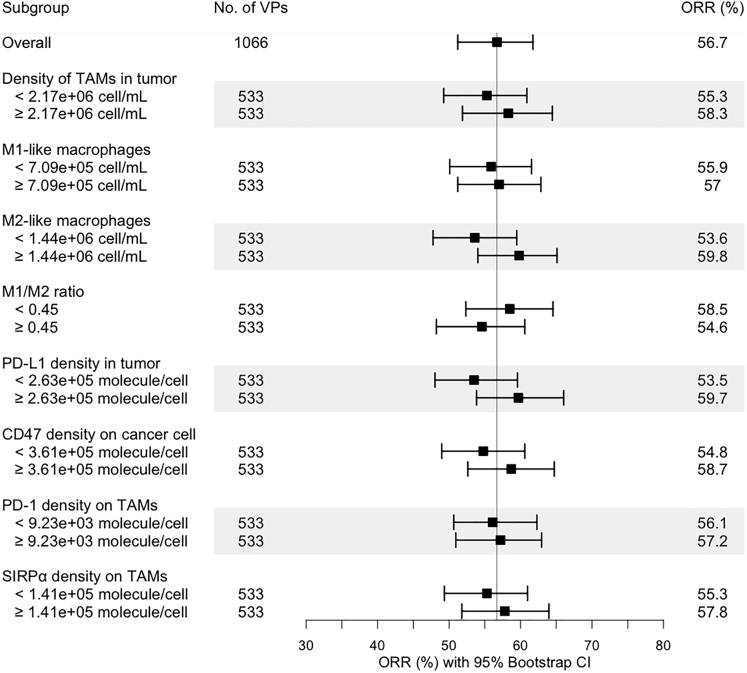
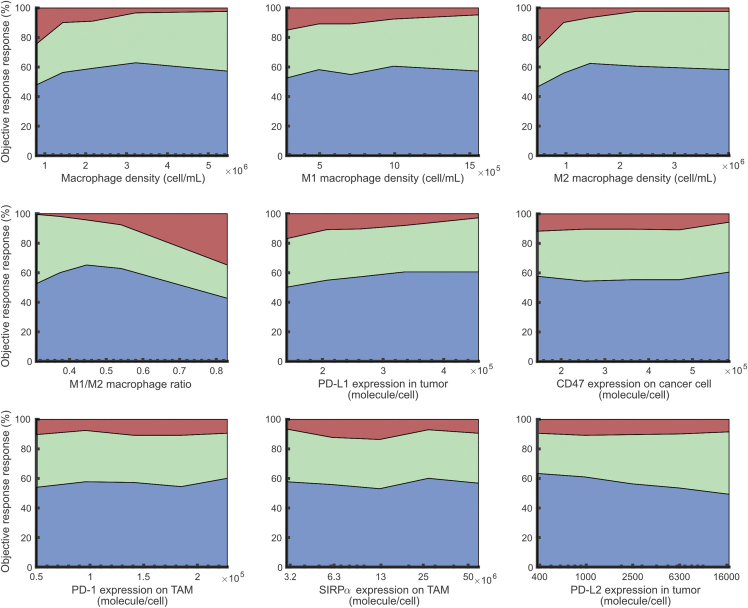
Quantitative systems pharmacology (QSP) modeling is an emerging mechanistic computational approach that couples drug pharmacokinetics/pharmacodynamics and the course of disease progression. It has begun to play important roles in drug development for complex diseases such as cancer, including triple-negative breast cancer (TNBC). The combination of the anti-PD-L1 antibody atezolizumab and nab-paclitaxel has shown clinical activity in advanced TNBC with PD-L1-positive tumor-infiltrating immune cells. As tumor-associated macrophages (TAMs) serve as major contributors to the immuno-suppressive tumor microenvironment, we incorporated the dynamics of TAMs into our previously published QSP model to investigate their impact on cancer treatment. We show that through proper calibration, the model captures the macrophage heterogeneity in the tumor microenvironment while maintaining its predictive power of the trial results at the population level. Despite its high mechanistic complexity, the modularized QSP platform can be readily reproduced, expanded for new species of interest, and applied in clinical trial simulation.

Keywords: Biophysics; Cancer; Immunology; Pharmacology.


Conflict of interest statement

Dr. Emens has had research funding from Genentech, F Hoffman La Roche, EMD Serono, Merck, AstraZeneca, Tempest, Bolt, Silverback, Takeda, CytomX, Compugen, Abbvie, BMS, Next Cure, Immune Onc. She has served as a paid consultant for, F Hoffman La Roche, Genentech, Macrogenics, Lilly, Chug, Silverback, Shionogi, CytomX, GPCR, Immunitas, DNAMx, Gilead, and Mersana. Dr. Emens also has an executive role at the Society for Immunotherapy of Cancer and has ownership interest in Molecuvax. Dr. Popel is a consultant to AsclepiX Therapeutics and CytomX Therapeutics. He receives research funding from AstraZeneca, Boehringer Ingelheim, CytomX Therapeutics. Dr Cesar Santa-Maria has research funding from Pfizer, AstraZeneca, Novartis, Bristol Meyers Squibb and has served on advisory boards for Bristol Meyers Squibb, Genomic Health, Seattle Genetics, Athenex, Halozyme and Polyphor. The terms of these arrangements are being managed by the Johns Hopkins University in accordance with its conflict-of-interest policies. The remaining authors declare that the research was conducted in the absence of any commercial or financial relationships that could be construed as a potential conflict of interest. Dr. Santa-Maria has research funding from Pfizer, Astrazeneca, Novartis, Bristol Meyers Squibb and has served on advisory boards for Bristol Meyers Squibb, Genomic Health, Seattle Genetics, Athenex, Halozyme and Polyphor.

Figures

None
Graphical abstract
Figure 1
Figure 1
QSP model diagram The model is comprised of four compartments: central, peripheral, tumor, and tumor-draining lymph node, which together describe cycles of immune activation in lymph nodes, T cell trafficking to the tumor, killing of cancer cells, immune evasion, and antigen release and lymphatic transport (Wang et al., 2021). nT, naive T cell; aT, activated T cell; NO, nitric oxide; Arg-I, arginase I; Treg, regulatory T cell; Teff, effector T cell; Th, helper T cell; Mac, macrophage; mAPC, mature antigen-presenting cell. Cytokine degradation and cellular clearance are omitted in the figure.
Figure 2
Figure 2
Integration of the macrophage module into the QSP model (A) Macrophage module diagram. Created with BioRender.com. (B) Model-predicted overall inhibitory effect on phagocytosis by immune checkpoint molecules (HMac,C). Experimentally measured increases of phagocytosis activity are compared with the decrease of phagocytosis rate because of checkpoint interactions in the model (1HMac,C). Statistical significance was calculated by Wilcoxon test. (C) Time-dependent profile of T cell subsets, macrophages, and myeloid-derived suppressor cells (MDSC) from baseline simulation. (D) Global sensitivity analysis on phagocytosis submodule. Partial-rank correlation coefficients (PRCC) are reported to test associations between the overall inhibitory effect of checkpoint molecules on phagocytosis and parameters of interest. (E) Global sensitivity analysis on macrophage module. PRCC values are reported to test associations between the tumor volume and parameters of interest.
Figure 3
Figure 3
Response status comparison between model prediction and clinical results in (A) atezolizumab monotherapy by RECIST 1.1, (B) nab-paclitaxel monotherapy by RECIST 1.1, (C) atezolizumab monotherapy by irRC, and (D) combination treatment by RECIST 1.1 Model predictions are presented with 95% bootstrap confidence intervals, while clinical results are reported with 95% Clopper–Pearson confidence intervals (Emens et al., 2019; Schmid et al., 2018). Virtual patient who has a tumor smaller than 2 mm is assumed to be a complete responder by the model. ORR, objective response rate. CR, complete response. PR, partial response. SD, stable disease. PD, progressive disease. M/U, missing or unevaluable disease.
Figure 4
Figure 4
Kaplan-Meier curve of model-predicted duration of response in (A) nab-paclitaxel monotherapy and (B) combination treatment of nab-paclitaxel and atezolizumab Duration of response is defined as the time from the achievement of a response to progression. The median durations of the response with 95% bootstrap confidence intervals are 5.6 (5.6–7.5) and 7.5 (5.6–9.3) months, respectively.
Figure 5
Figure 5
Subgroup analysis of the in silico clinical trial of atezolizumab and nab-paclitaxel The virtual patient population was divided into eight subgroups based on the pre-treatment values of selected characteristics, and the objective response rates in each subgroup were calculated with 95% bootstrap confidence intervals.
Figure 6
Figure 6
Effects of model variables on response status For each variable, the virtual patient population was sorted by the pre-treatment variable level in ascending order, and evenly divided into five subgroups. The response status of each subgroup in the combination therapy is plotted against the corresponding median variable level. Blue represents partial or complete response. Green represents stable disease. Red represents progressive disease. Related to Figure S1.

References

    1. Agrawal N.G., Linderman J.J. Mathematical modeling of helper T lymphocyte/antigen-presenting cell interactions: analysis of methods for modifying antigen processing and presentation. J. Theor. Biol. 1996;182:487–504. doi: 10.1006/jtbi.1996.0190. - DOI - PubMed
    1. Anders C.K., Carey L.A. In: ER/PR negative, HER2-negative (triple-negative) breast cancer. Hayes D.F., Burstein H.J., editors. UpToDate; 2022.
    1. Arole V., Nitta H., Wei L., Shen T., Parwani A.V., Li Z. M2 tumor-associated macrophages play important role in predicting response to neoadjuvant chemotherapy in triple-negative breast carcinoma. Breast Cancer Res. Treat. 2021;188:37–42. doi: 10.1007/s10549-021-06260-1. - DOI - PubMed
    1. Autenshlyus A., Arkhipov S., Mikhaylova E., Marinkin I., Arkhipova V., Varaksin N., Vavilin V., Lyahovich V. Analyzing the relationship between the cytokine profile of invasive breast carcinoma, its histopathological characteristics and metastasis to regional lymph nodes. Sci. Rep. 2021;11:11359. doi: 10.1038/s41598-021-90930-z. - DOI - PMC - PubMed
    1. Autissier P., Soulas C., Burdo T.H., Williams K.C. Evaluation of a 12-color flow cytometry panel to study lymphocyte, monocyte, and dendritic cell subsets in humans. Cytometry A. 2010;77:410–419. doi: 10.1002/cyto.a.20859. - DOI - PMC - PubMed