. 2022 May;15(5):896-907.
doi: 10.1038/s41385-022-00528-5. Epub 2022 Jul 18.

Trained immunity of alveolar macrophages requires metabolic rewiring and type 1 interferon signaling

Affiliations

Trained immunity of alveolar macrophages requires metabolic rewiring and type 1 interferon signaling

Sophie Zahalka et al. Mucosal Immunol. 2022 May.

Abstract

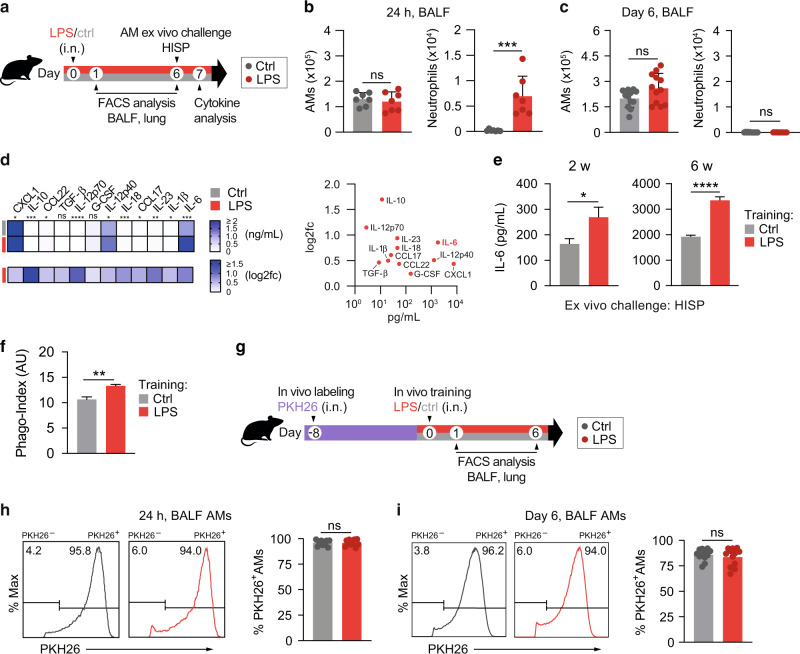
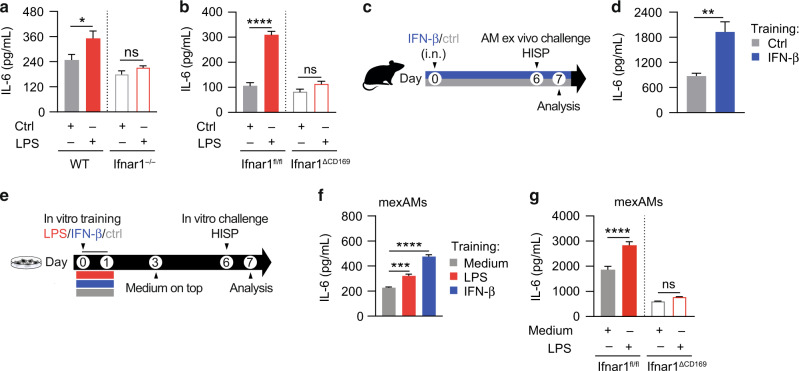
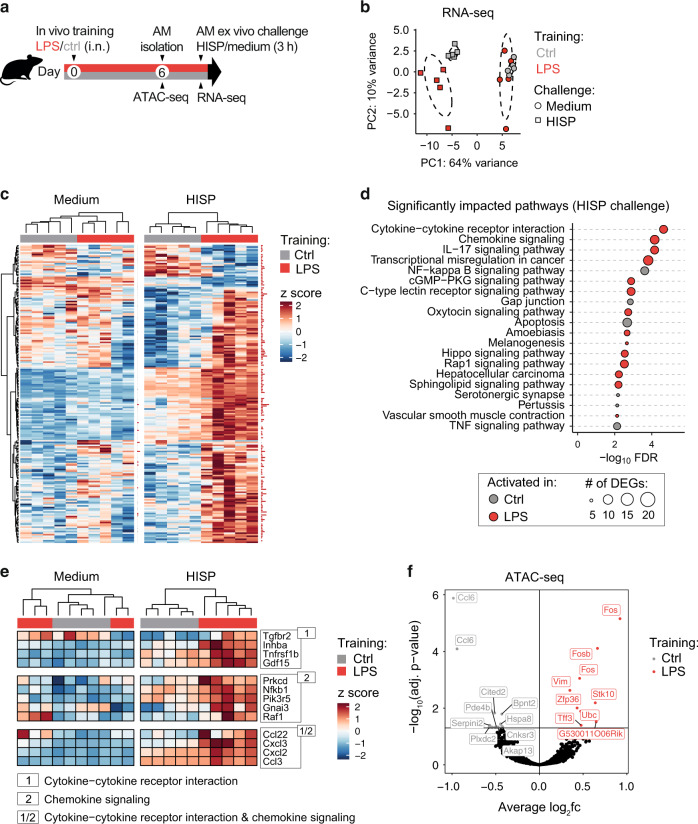
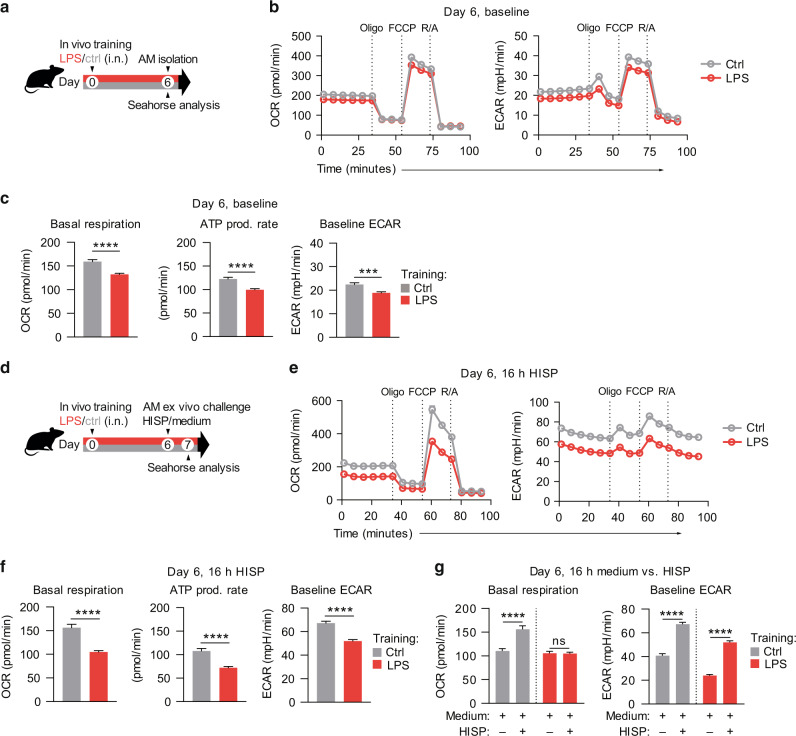
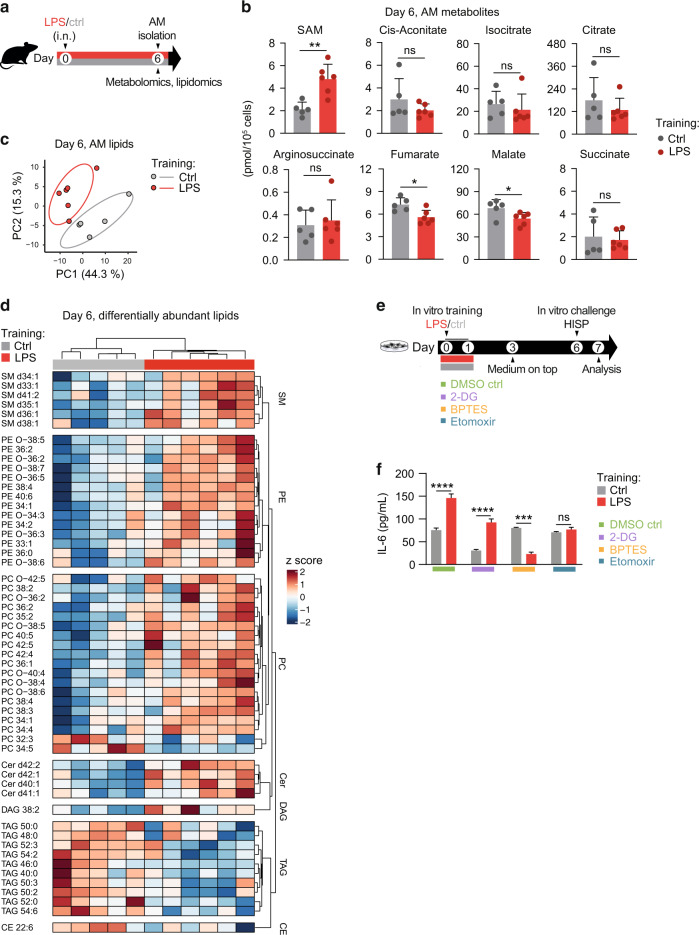
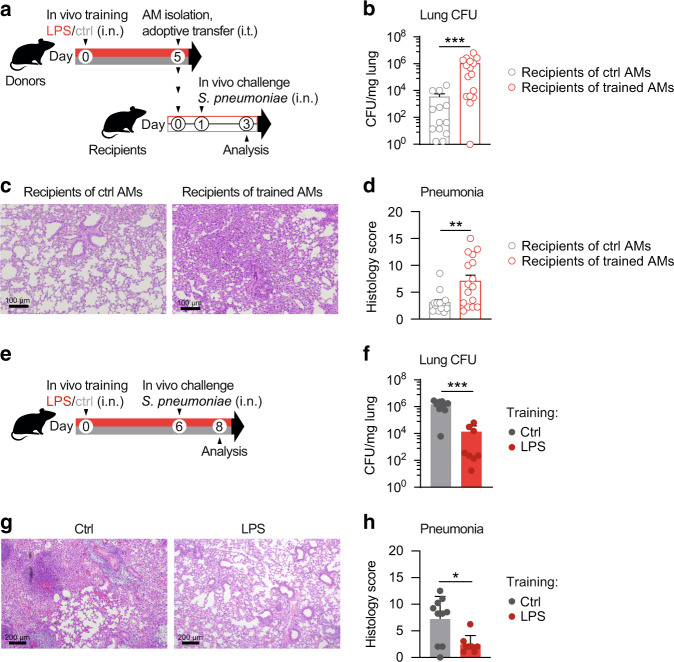
Environmental microbial triggers shape the development and functionality of the immune system. Alveolar macrophages (AMs), tissue-resident macrophages of the lungs, are in constant and direct contact with inhaled particles and microbes. Such exposures likely impact AM reactivity to subsequent challenges by immunological imprinting mechanisms referred to as trained immunity. Here, we investigated whether a ubiquitous microbial compound has the potential to induce AM training in vivo. We discovered that intranasal exposure to ambient amounts of lipopolysaccharide (LPS) induced a pronounced AM memory response, characterized by enhanced reactivity upon pneumococcal challenge. Exploring the mechanistic basis of AM training, we identified a critical role of type 1 interferon signaling and found that inhibition of fatty acid oxidation and glutaminolysis significantly attenuated the training effect. Notably, adoptive transfer of trained AMs resulted in increased bacterial loads and tissue damage upon subsequent pneumococcal infection. In contrast, intranasal pre-exposure to LPS promoted bacterial clearance, highlighting the complexity of stimulus-induced immune responses, which likely involve multiple cell types and may depend on the local immunological and metabolic environment. Collectively, our findings demonstrate the profound impact of ambient microbial exposure on pulmonary immune memory and reveal tissue-specific features of trained immunity.


Conflict of interest statement

The authors declare no competing interest.

Figures

Fig. 1
Fig. 1. LPS exposure induces trained immunity in alveolar macrophages.
a Experimental setup for i.n. LPS (1 ng/mouse) or saline exposure, followed by FACS analysis (BALF, lung) or AM cytokine analysis upon ex vivo bacterial challenge. b, Absolute numbers of BALF AMs and neutrophils, measured by flow cytometry 24 h (b) and six days (c) after in vivo treatment. d LEGENDplex analysis of LPS-exposed and control AMs upon ex vivo HISP-challenge (16 h). Absolute cytokine levels (top heat map) and log2 fold change (log2fc) of LPS-exposed AMs versus means of control AMs (bottom heat map) are shown. The right panel compares absolute levels and log2fc of trained AMs. e IL-6 levels of LPS-exposed and control AMs upon ex vivo bacterial challenge two or six weeks after treatment. f Phagocytosis index (AU: arbitrary units) of trained and control AMs, isolated on day six after in vivo training, followed by ex vivo stimulation with FITC-labeled HISP and FACS analysis. g Experimental setup for PKH26 labeling eight days prior to in vivo training. h, i Representative histograms of PKH26 MFI (gated on CD11c+ Siglec F+ AMs) and percentage of PKH26+ AMs 24 h (h) and six days (i) after training. Graphs show means + SD of 7 (b) or 11–12 (c, h, i) biological replicates, means of 7–8 biological replicates (d) or means + SD of 3–5 technical replicates (e, f). Data (b, c, e, f) are representative of two independent experiments. Statistical analysis: student’s t-test. ns, not significant. *p ≤ 0.05, **p ≤ 0.01, ***p ≤ 0.001, ****p ≤ 0.0001.
Fig. 2
Fig. 2. LPS-induced AM training is driven by type 1 interferon signaling.
ab IL-6 levels of HISP-challenged (16 h) LPS-trained and control AMs, isolated six days after in vivo training (performed as described in Fig. 1) of Ifnar1−/− and WT control mice (a) or Ifnar1ΔCD169 and Ifnar1fl/fl control mice (b). c Experimental setup for i.n. treatment with IFN-β (2000 U/mouse) or saline (control). AMs were isolated on day six, followed by ex vivo challenge with HISP (16 h). d IL-6 levels of IFN-β-trained and control AMs after ex vivo restimulation. e Experimental setup for in vitro LPS (10 ng/mL)- or IFN-β (800 U/ mL)- training of mexAMs, followed by in vitro HISP challenge (16 h) six days later. f IL-6 levels of control, LPS-trained and IFN-β-trained WT mexAMs after HISP challenge. g IL-6 levels of LPS-trained and control Ifnar1ΔCD169 and Ifnar1fl/fl mexAMs after HISP challenge. Graphs show means + SEM of 4-5 technical replicates. In (ad), four biological replicates per group were pooled and seeded as technical replicates for stimulation. Data are representative of two independent experiments. Statistical analysis: two-way ANOVA (factor 1: training; factor 2: genotype) (a, b, g), student’s t-test (d) or one-way ANOVA (f). ns, not significant. *p ≤ 0.05, **p ≤ 0.01, ***p ≤ 0.001, ****p ≤ 0.0001.
Fig. 3
Fig. 3. LPS-trained AMs display an altered gene expression profile upon ex vivo challenge.
a Experimental setup for ATAC-seq and RNA-seq analysis of AMs isolated on day six after in vivo training. b Principal component analysis of normalized gene expression data obtained from in vivo trained AMs upon 3 h ex vivo HISP challenge (squares) or medium (circles). c Heatmap depicting DEGs in trained and control AMs upon medium or HISP challenge. Samples are clustered by unsupervised clustering. Data are rlog transformed, followed by z-score scaling. Cutoff: adjusted p-value ≤ 0.1; red horizontal bars adjacent to heatmaps indicate statistical significance. d Top 20 KEGG pathways in HISP-challenged trained and control AMs. Circle size indicates the number of DEGs associated with the respective pathway. e Heatmaps depicting DEGs identified in the top two differentially regulated pathways in trained and control AMs upon medium or HISP challenge. Data are rlog transformed, followed by z-score scaling. f Volcano plot displaying differentially accessible regions (DARs; padj ≤ 0.05) of trained versus control AMs identified by ATAC-seq analysis six days after in vivo training. Labels indicate top 10 DARs per group.
Fig. 4
Fig. 4. LPS exposure persistently alters the metabolic state and responsiveness of AMs.
a Experimental setup for Seahorse analyses of AMs on day six after in vivo training with LPS/saline. b OCR and ECAR of trained and control AMs, measured at baseline and after sequential treatment with oligomycin (Oligo), FCCP and rotenone/antimycin A (R/A). c Quantification of baseline OCR (basal respiration), ATP production rate and baseline ECAR. d Experimental setup for Seahorse analyses of AMs upon ex vivo HISP or medium challenge (16 h) on day six after training. e OCR and ECAR of trained and control AMs, 16 h after HISP stimulation, measured at baseline and after sequential treatment with indicated drugs. f Quantification of basal respiration, ATP production rate and baseline ECAR 16 h after HISP challenge. g Quantification of baseline OCR and ECAR 16 h after stimulation with HISP in medium versus medium only. Graphs show means + SEM of 10-11 technical replicates from pooled biological replicates (n = 5-8). Data are representative of two independent experiments. Statistical analysis: student’s t-test. ns, not significant. ***p ≤ 0.001, ****p ≤ 0.0001; OCR, oxygen consumption rate; ECAR, extracellular acidification rate; FCCP, carbonyl cyanide-4-(trifluoromethoxy)phenylhydrazone.
Fig. 5
Fig. 5. LPS-induced metabolic activation contributes to the establishment of AM memory.
a Experimental setup for metabolomic/lipidomic analyses of AMs on day six after in vivo training with LPS/saline. b AM intracellular metabolites related to the tricarboxylic acid (TCA) cycle. SAM: S-adenosyl-methionine. c Principal component analysis of centered log-ratio transformed AM lipidomics data. d Heatmap displaying differentially abundant lipids (FDR 0.2, p-value ≤ 0.05) of trained and control AMs. Metabolomic/lipidomic analyses were performed with 5-6 biological replicates per group. Cer ceramides; DAG diacylglycerols; PE phosphatidylethanolamines; SM sphingomyelins; PC phosphatidylcholines; CE cholesterol esters; TAG triacylglycerols. e Experimental setup for mexAM training with LPS or medium in presence of indicated metabolic inhibitors or DMSO, followed by in vitro HISP challenge (16 h) six days later. f IL-6 levels of mexAMs stimulated as described in e. Data are representative of two independent experiments. Graphs show means + SD of 5-6 biological replicates (b) or means + SEM of 4-5 technical replicates (f). Statistical analysis: student’s t-test (b) and two-way ANOVA (f) (factor 1: training; factor 2: inhibitor). ns, not significant. *p ≤ 0.05, **p ≤ 0.01, ***p ≤ 0.001, ****p ≤ 0.0001.
Fig. 6
Fig. 6. LPS exposure modulates pneumonia outcome in a context-dependent manner.
a Experimental setup for adoptive transfer of LPS-trained or control donor AMs, followed by i.n. S. pneumoniae infection (in vivo challenge). Donor AMs were isolated by BAL five days after in vivo training and transferred intratracheally (i.t.) to naïve WT mice. Recipients were i.n. infected with S. pneumoniae 24 h after cell transfer. b Lung bacterial loads of recipients, determined 48 h after infection. cd Representative histology images (c) and pneumonia score (d) of H&E-stained lung tissue 48 h after infection; scale bars: 100 µm. Graphs show means + SEM of two pooled experiments with 6–8 biological replicates each (total n = 12–16). e Experimental setup for in vivo training, followed by infection with S. pneumoniae (in vivo challenge) on day six. f Lung bacterial loads, 48 h after infection. g, h Representative histology images (g) and pneumonia score (h) of H&E-stained lung tissue, 48 h after infection; scale bars: 200 µm. Graphs show means + SD of 8–10 biological replicates. Data are representative of two independent experiments. Statistical analysis: Mann-Whitney-U test. *p ≤ 0.05, **p ≤ 0.01, ***p ≤ 0.001.

References

    1. Netea MG, Quintin J, van der Meer JW. Trained immunity: a memory for innate host defense. Cell Host Microbe. 2011;9:355–361. doi: 10.1016/j.chom.2011.04.006. - DOI - PubMed
    1. Kar UK, Joosten LAB. Training the trainable cells of the immune system and beyond. Nat. Immunol. 2020;21:115–119. doi: 10.1038/s41590-019-0583-y. - DOI - PubMed
    1. Netea MG, et al. Defining trained immunity and its role in health and disease. Nat. Rev. Immunol. 2020;20:375–388. doi: 10.1038/s41577-020-0285-6. - DOI - PMC - PubMed
    1. Bals R. Lipopolysaccharide and the lung: a story of love and hate. Eur. Respir. J. 2005;25:776–777. doi: 10.1183/09031936.05.00025405. - DOI - PubMed
    1. Vernooy JH, Dentener MA, van Suylen RJ, Buurman WA, Wouters EF. Long-term intratracheal lipopolysaccharide exposure in mice results in chronic lung inflammation and persistent pathology. Am. J. Respir. Cell Mol. Biol. 2002;26:152–159. doi: 10.1165/ajrcmb.26.1.4652. - DOI - PubMed

Publication types