. 2022 Aug 25;37(9):1994-2011.
doi: 10.1093/humrep/deac153.

β-hydroxybutyrate reduces blastocyst viability via trophectoderm-mediated metabolic aberrations in mice

Affiliations

β-hydroxybutyrate reduces blastocyst viability via trophectoderm-mediated metabolic aberrations in mice

Emma G Whatley et al. Hum Reprod. .

Abstract

Study question: What is the effect of the ketone β-hydroxybutyrate (βOHB) on preimplantation mouse embryo development, metabolism, epigenetics and post-transfer viability?

Summary answer: In vitro βOHB exposure at ketogenic diet (KD)-relevant serum concentrations significantly impaired preimplantation mouse embryo development, induced aberrant glycolytic metabolism and reduced post-transfer fetal viability in a sex-specific manner.

What is known already: A maternal KD in humans elevates gamete and offspring βOHB exposure during conception and gestation, and in rodents is associated with an increased time to pregnancy, and altered offspring organogenesis, post-natal growth and behaviour, suggesting a developmental programming effect. In vitro exposure to βOHB at supraphysiological concentrations (8-80 mM) perturbs preimplantation mouse embryo development.

Study design, size, duration: A mouse model of embryo development and viability was utilized for this laboratory-based study. Embryo culture media were supplemented with βOHB at KD-relevant concentrations, and the developmental competence, physiology, epigenetic state and post-transfer viability of in vitro cultured βOHB-exposed embryos was assessed.

Participants/materials, setting, methods: Mouse embryos were cultured in vitro with or without βOHB at concentrations representing serum levels during pregnancy (0.1 mM), standard diet consumption (0.25 mM), KD consumption (2 mM) and diabetic ketoacidosis (4 mM). The impact of βOHB exposure on embryo development (blastocyst formation rate, morphokinetics and blastocyst total, inner cell mass and trophectoderm (TE) cell number), physiology (redox state, βOHB metabolism, glycolytic metabolism), epigenetic state (histone 3 lysine 27 β-hydroxybutyrylation, H3K27bhb) and post-transfer viability (implantation rate, fetal and placental development) was assessed.

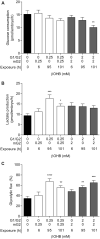
Main results and the role of chance: All βOHB concentrations tested slowed embryo development (P < 0.05), and βOHB at KD-relevant serum levels (2 mM) delayed morphokinetic development, beginning at syngamy (P < 0.05). Compared with unexposed controls, βOHB exposure reduced blastocyst total and TE cell number (≥0.25 mM; P < 0.05), reduced blastocyst glucose consumption (2 mM; P < 0.01) and increased lactate production (0.25 mM; P < 0.05) and glycolytic flux (0.25 and 2 mM; P < 0.01). Consumption of βOHB by embryos, mediated via monocarboxylate transporters, was detected throughout preimplantation development. Supraphysiological (20 mM; P < 0.001), but not physiological (0.25-4 mM) βOHB elevated H3K27bhb levels. Preimplantation βOHB exposure at serum KD levels (2 mM) reduced post-transfer viability. Implantation and fetal development rates of βOHB-treated embryos were 50% lower than controls (P < 0.05), and resultant fetuses had a shorter crown-rump length (P < 0.01) and placental diameter (P < 0.05). A strong sex-specific effect of βOHB was detected, whereby female fetuses from βOHB-treated embryos weighed less (P < 0.05), had a shorter crown-rump length (P < 0.05), and tended to have accelerated ear development (P < 0.08) compared with female control fetuses.

Limitations, reasons for caution: This study only assessed embryo development, physiology and viability in a mouse model utilizing in vitro βOHB exposure; the impact of in vivo exposure was not assessed. The concentrations of βOHB utilized were modelled on blood/serum levels as the true oviduct and uterine concentrations are currently unknown.

Wider implications of the findings: These findings indicate that the development, physiology and viability of mouse embryos is detrimentally impacted by preimplantation exposure to βOHB within a physiological range. Maternal diets which increase βOHB levels, such as a KD, may affect preimplantation embryo development and may therefore impair subsequent viability and long-term health. Consequently, our initial observations warrant follow-up studies in larger human populations. Furthermore, analysis of βOHB concentrations within human and rodent oviduct and uterine fluid under different nutritional states is also required.

Study funding/competing interest(s): This work was funded by the University of Melbourne and the Norma Hilda Schuster (nee Swift) Scholarship. The authors have no conflicts of interest.

Trial registration number: N/A.

Keywords: DOHaD; beta-hydroxybutyrylation; embryo transfer; epigenetics; ketogenic diet; ketone; metabolism; morphokinetics; nutrients.


Figures

Figure 1.
Figure 1.
Effect of β-hydroxybutyrate (βOHB) on preimplantation mouse embryo development. (A) Developmental rates of embryos exposed to βOHB in vitro. Data are presented as the proportion of total pronucleate oocytes (2PN) collected that reached or surpassed the indicated developmental stages. N = 100–112 embryos per group, six biological replicates. 2c, 2-cell; 3c, 3-cell; C, compacting embryo; M, morula; eB, early blastocyst; B, blastocyst; EB, expanded blastocyst; HB, hatching blastocyst. Proportion data analysed via 2 × 5 contingency table with Bonferroni post hoc analyses. *P <0.05, **P <0.01, significant compared to control (0 mM). (B) Cell number and lineage allocation in Day 5 blastocysts treated with βOHB for 96 h. N = 79–91 blastocysts per group, six biological replicates. Data analysed via Kruskal–Wallis test with Dunn’s correction for multiple comparisons (total cell number, ICM cell number), or one-way ANOVA with Bonferroni correction (TE cell number). Data are presented as mean ± SEM. *P <0.05, ***P <0.001, #P =0.06, compared to control (0 mM). Asterisks above the bar represent total cell number, asterisks within the bar represent trophectoderm (TE) cell number.
Figure 2.
Figure 2.
Morphokinetic development of preimplantation embryos exposed to 2 mM β-hydroxybutyrate (βOHB). The timing of morphokinetic events is presented as (A) time post-hCG injection, or (B) time post-pronuclear fading (tPNf). (C) Rate of blastocoel expansion (tEB-tSB). N > 79 embryos per group, three biological replicates. Differences between treatments analysed via Student’s t-test. Data are presented as mean ± SEM. Asterisks denote statistically significant differences, *P <0.05, #P <0.075, compared to control. Time to: cleavage to 2- to 8-cell stage (t2, t3, t4, t5, t6, t7, t8); morula (tM); start of blastulation (tSB); blastocyst (tB); expanded blastocyst (tEB); hatching blastocyst (tHB).
Figure 3.
Figure 3.
Glycolytic metabolism of blastocysts exposed to β-hydroxybutyrate (βOHB). (A) Glucose consumption, (B) lactate production and (C) glycolytic flux of Day 5 blastocysts exposed to 0 mM (control), 0.25 mM or 2 mM βOHB in G1/G2 culture and/or metabolic G2 culture (mG2) for up to 101 h. N = 19–25 blastocysts per group, four biological replicates. Glycolytic flux (%) was calculated as (lactate production × 0.5)/glucose consumption × 100. Data are presented as mean ± SEM. Data were analysed via one-way ANOVA with Bonferroni post hoc analysis (glucose uptake), or Kruskal–Wallis test with Dunn’s correction for multiple comparisons (lactate production, glycolytic flux). Asterisks denote statistically significant differences, *P <0.05, **P <0.01, ***P <0.001, ****P <0.0001, compared to control (0 mM).
Figure 4.
Figure 4.
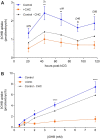
Characterization of β-hydroxybutyrate (βOHB) consumption by embryos. (A) Rates of βOHB uptake throughout preimplantation development by embryos cultured in 2 mM βOHB alone (control) or with the monocarboxylic acid transporter 1 and 2 inhibitor, α-cyano-4 hydroxycinnamate (CHC, 0.125 mM). Data are presented as mean ± SEM. N = 14–16 metabolic measurements from 70 to 80 embryos per group, four biological replicates. 2PN, pronucleate oocyte; 2c, 2-cell; c/M, compacting/morula stage; D4B, Day 4 blastocyst; D5B, Day 5 blastocyst. (B) Rates of βOHB uptake by D5Bs exposed to 0.5–8 mM βOHB alone (control) or with CHC (0.125 mM). Data are presented as mean ± SEM. N = 38–81 metabolic measurements from 190 to 405 blastocysts per control group; 15 metabolic measurements from 75 blastocysts per +CHC group; 15 biological replicates. Differences between control and +CHC were analysed by two-way ANOVA with Bonferroni correction for multiple comparisons. Asterisks denote statistically significant differences, *P <0.05, **P <0.01, ****P <0.0001, #P <0.08. ‘Control—CHC’ represents levels of MCT-facilitated βOHB uptake.
Figure 5.
Figure 5.
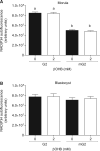
Redox state of morulae and Day 5 blastocysts following exposure to β-hydroxybutyrate (βOHB). NAD(P)H autofluorescence of (A) morulae and (B) Day 5 blastocysts exposed to 0 mM (control) or 2 mM βOHB for 20 min in standard G2 medium, or metabolic G2 medium (mG2, 0.5 mM glucose, no lactate or pyruvate). N = 29–30 embryos per group, three biological replicates. Data are presented as mean ± SEM. Differences between control and treatment were analysed via two-way ANOVA with Bonferroni post hoc analysis. Statistically significant differences are denoted by different letters; a,bP <0.0001.
Figure 6.
Figure 6.
Impact of β-hydroxybutyrate (βOHB) on blastocyst histone 3 lysine 27 β-hydroxybutyrylation (H3K27bhb). Embryos were exposed from the 2PN until Day 5 blastocyst stage (101 h) in (A) 0 mM, (B) 0.25 mM, (C) 2 mM and (D) 4 mM βOHB, or from the Day 4 until Day 5 blastocyst stage (24 h) in (E) 20 mM, or (F, G) 2 mM βOHB. (G) Embryos were additionally cultured with the MCT1/2 inhibitor, α-cyano-4-hydroxycinnamate (CHC, 0.125 mM) for the duration of βOHB exposure. H3K27bhb levels were quantified in (H) inner cell mass (ICM) cells and (I) trophectoderm (TE) cells. The ‘overall’ level of H3K27bhb presented in (J) is the average of ICM + TE results. Data are presented as mean fold change from control ± SEM. Differences between control (0 mM βOHB, black bars) and treatments were analysed via Kruskal–Wallis test with Dunn’s test for multiple comparisons. Asterisks denote statistically significant differences. ***P <0.001, ****P <0.0001, ns, not significant. N = 42–47 blastocysts per group (A–D, F, G), n = 21 blastocysts (E), from three independent biological replicates.

References

    1. Ahlström A, Westin C, Reismer E, Wikland M, Hardarson T.. Trophectoderm morphology: an important parameter for predicting live birth after single blastocyst transfer. Hum Reprod 2011;26:3289–3296. - PubMed
    1. Alwahab UA, Pantalone KM, Burguera B.. A ketogenic diet may restore fertility in women with polycystic ovary syndrome: a case series. AACE Clin Case Rep 2018;4:e427–e431.
    1. Anderson JC. Measuring breath acetone for monitoring fat loss. Obesity (Silver Spring) 2015;23:2327–2334. - PMC - PubMed
    1. Barker DJ, Osmond C.. Infant mortality, childhood nutrition, and ischaemic heart disease in England and Wales. Lancet 1986;327:1077–1081. - PubMed
    1. Bermejo-Alvarez P, Rizos D, Rath D, Lonergan P, Gutierrez-Adan A.. Sex determines the expression level of one third of the actively expressed genes in bovine blastocysts. Proc Natl Acad Sci USA 2010;107:3394–3399. - PMC - PubMed

Publication types

Substances