hnRNP R negatively regulates transcription by modulating the association of P-TEFb with 7SK and BRD4
- PMID: 35856391
- PMCID: PMC9442301
- DOI: 10.15252/embr.202255432
hnRNP R negatively regulates transcription by modulating the association of P-TEFb with 7SK and BRD4
Abstract
The P-TEFb complex promotes transcription elongation by releasing paused RNA polymerase II. P-TEFb itself is known to be inactivated through binding to the non-coding RNA 7SK but there is only limited information about mechanisms regulating their association. Here, we show that cells deficient in the RNA-binding protein hnRNP R, a known 7SK interactor, exhibit increased transcription due to phosphorylation of RNA polymerase II. Intriguingly, loss of hnRNP R promotes the release of P-TEFb from 7SK, accompanied by enhanced hnRNP A1 binding to 7SK. Additionally, we found that hnRNP R interacts with BRD4, and that hnRNP R depletion increases BRD4 binding to the P-TEFb component CDK9. Finally, CDK9 is stabilized upon loss of hnRNP R and its association with Cyclin K is enhanced. Together, our results indicate that hnRNP R negatively regulates transcription by modulating the activity and stability of the P-TEFb complex, exemplifying the multimodal regulation of P-TEFb by an RNA-binding protein.
Keywords: 7SK; BRD4; P-TEFb; hnRNP R; transcription.
© 2022 The Authors. Published under the terms of the CC BY 4.0 license.
Figures

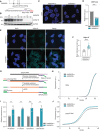
- A
Schematic of the strategy for the generation of hnRNP R knockout cells by prime editing. The PAM sequence is underlined in red, the protospacer sequence recognized by the pegRNA is marked in black, the inserted nucleotides are marked in purple and the TGA stop codon is indicated by asterisks.
- B
Western blot analysis of hnRNP R in three independent HNRNPR wildtype (+/+), heterozygous (+/−) and homozygous (−/−) HeLa cell lines.
- C
Confocal microscopy images of nuclei stained with DAPI. Scale bar: 10 μm.
- D
Quantification of the DAPI area in (C). Data are mean with standard deviation (SD); ***P ≤ 0.001; unpaired two‐tailed t‐test (n = 3 biological replicates).
- E
RNA FISH with a Cy3‐labeled oligo‐dT probe. DAPI was used for nuclear staining. Scale bar: 10 μm.
- F
Quantification of mean fluorescence intensity of the Cy3 oligo‐dT signal in (E). Data are mean with SD; ****P ≤ 0.0001; Mann–Whitney test (n = 129 cells for HNRNPR +/+ and n = 176 cells for HNRNPR −/−).
- G
Schematic of the mRNA quantification procedure (Picelli et al, 2014). TSO, template‐switching oligonucleotide.
- H
Fluorescence detection of tRNA amplification by qPCR.
- I
Quantification of relative mRNA levels detected by qPCR from cDNA at different dilutions. Data are mean with SD; **P ≤ 0.01, ***P ≤ 0.001; two‐way ANOVA with Sidak's multiple comparisons test (n = 3 biological replicates).
- J
Fluorescence detection of mRNA amplification by qPCR using ISPCR primers.

- A
Western blot analysis of Ser2‐phosphorylated and total RNA pol II, Cyclin T1, CDK9 and GAPDH protein levels.
- B
Quantification of relative expression of Ser2‐phosphorylated and total RNA pol II, Cyclin T1 and CDK9 in (A). Data are mean with SD; **P ≤ 0.01, ***P ≤ 0.001, ****P ≤ 0.0001, n.s. not significant; unpaired two‐tailed t‐tests (n = 3 biological replicates).
- C
Immunostaining with antibodies against Ser2‐phosphorylated and total RNA pol II. Scale bar: 20 μm.
- D
Immunostaining with an antibody against CDK9. Scale bar: 10 μm.
- E
Immunostaining with an antibody against Cyclin T1. Scale bar: 10 μm.
- F
Western blot analysis of subcellular fractions for Calnexin, GAPDH, histone H3, Ser2‐phosphorylated and total RNA pol II, Cyclin T1 and CDK9. Cyt, cytosol; nuc+org, nuclear soluble proteins and organelles; chr, chromatin‐associated proteins.
- G
Quantification of relative expression of Ser2‐phosphorylated and total RNA pol II, Cyclin T1 and CDK9 in subcellular fractions in (F). Data are mean with SD; *P ≤ 0.05, ***P ≤ 0.001, ****P ≤ 0.0001, n.s. not significant; two‐way ANOVA with Sidak's multiple comparisons test (n = 3 biological replicates).

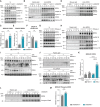
- A
Western blot analysis of the indicated proteins in the input (In) lysates used for co‐immunoprecipitation.
- B
Western blot analysis of Cyclin T1, HEXIM1, CDK9 and hnRNP A1 co‐immunoprecipitated by an anti‐LARP7 antibody. Immunoprecipitation with rabbit‐IgG antibody was used as control.
- C
Western blot analysis of Cyclin T1, HEXIM1, CDK9, hnRNP A1 and LARP7 co‐immunoprecipitated by an anti‐MePCE antibody. Immunoprecipitation with rabbit‐IgG antibody was used as control.
- D
Quantification of CDK9, Cyclin T1 and HEXIM1 co‐immunoprecipitating with LARP7 in (B). Data are mean with SD; **P ≤ 0.01, n.s. not significant; unpaired two‐tailed t‐tests (n = 3 biological replicates).
- E
Quantification of CDK9, Cyclin T1 and HEXIM1 co‐immunoprecipitating with MePCE in (C). Data are mean with SD; *P ≤ 0.05, n.s. not significant; unpaired two‐tailed t‐tests (n = 3 biological replicates).
- F
Quantification of hnRNP A1 co‐immunoprecipitating with LARP7 and MePCE in (B) and (C). Data are mean with SD; *P ≤ 0.05; unpaired two‐tailed t‐tests (n = 3 biological replicates).
- G
Western blot analysis of subcellular fractions for Calnexin, GAPDH, histone H3, hnRNP R and hnRNP A1. Cyt, cytosol; nuc+org, nuclear soluble proteins and organelles; chr, chromatin‐associated proteins.
- H
Western blot analysis of hnRNP R co‐immunoprecipitated by an anti‐hnRNP A1 antibody from subcellular fractions. Immunoprecipitation with mouse‐IgG antibody was used as control.
- I
Quantification of 7SK RNA in subcellular fractions by qPCR. Data are mean with SD; **P ≤ 0.01, n.s. not significant; two‐way ANOVA with Sidak's multiple comparisons test (n = 3 biological replicates).
- J
Quantification of 7SK RNA co‐immunoprecipitating with hnRNP A1 from subcellular fractions. Data are mean with SD; *P ≤ 0.05, n.s. not significant; two‐way ANOVA with Sidak's multiple comparisons test (n = 3 biological replicates).

- A
Western blot analysis of BRD4, hnRNP R, Cyclin T1, CDK9, α‐Tubulin and histone H3 in the input lysates used for co‐immunoprecipitation.
- B
Western blot analysis of hnRNP R, Cyclin T1, CDK9 and histone H3 co‐immunoprecipitated by an anti‐BRD4 antibody. Immunoprecipitation with rabbit‐IgG antibody was used as control.
- C
Quantification of CDK9 co‐immunoprecipitating with BRD4 in (B). Data are mean with SD; **P ≤ 0.01; unpaired two‐tailed t‐test (n = 3 biological replicates).
- D
Western blot analysis of BRD4 (long and short exposure) co‐immunoprecipitated by an anti‐CDK9 antibody. Immunoprecipitation with mouse‐IgG antibody was used as control.
- E
Quantification of BRD4 co‐immunoprecipitating with CDK9 in (D). Data are mean with SD; **P ≤ 0.01; unpaired two‐tailed t‐test (n = 3 biological replicates).
- F
Quantification of histone H3 co‐immunoprecipitating with BRD4 in (B). Data are mean with SD; **P ≤ 0.01; unpaired two‐tailed t‐test (n = 3 biological replicates).
- G
Western blot analysis of BRD4, hnRNP R, Cyclin T1, CDK9, α‐Tubulin and histone H3 in the input lysates used for co‐immunoprecipitation. Lysates were pre‐treated with RNase as indicated.
- H
Western blot analysis of hnRNP R, Cyclin T1, CDK9 and histone H3 co‐immunoprecipitated by an anti‐BRD4 antibody. Immunoprecipitation with rabbit‐IgG antibody was used as control.
- I
Western blot analysis of BRD4, hnRNP R, CDK9 and α‐Tubulin in the input lysates used for co‐immunoprecipitation.
- J
Western blot analysis of hnRNP R and CDK9 co‐immunoprecipitated by an anti‐BRD4 antibody. Immunoprecipitation with rabbit‐IgG antibody was used as control.
- K
Quantification of CDK9 co‐immunoprecipitating with BRD4 in (J). Data are mean with SD; ****P ≤ 0.0001; two‐way ANOVA with Sidak's multiple comparisons test (n = 3 biological replicates).
- L
Western blot analysis of phospho‐CDK9(Thr186) co‐immunoprecipitated by an anti‐BRD4 antibody. Immunoprecipitation with rabbit‐IgG antibody was used as control.
- M
Quantification of phospho‐CDK9(Thr186) co‐immunoprecipitating with BRD4 in (L). Data are mean with SD; **P ≤ 0.01; unpaired two‐tailed t‐test (n = 3 biological replicates).

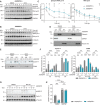
- A, B
Western blot analysis of Ser2‐phosphorylated and total RNA pol II levels in HNRNPR +/+ (A) and −/− (B) cells treated with DMSO or CHX for the indicated durations. GAPDH and α‐Tubulin served as loading control.
- C
Quantification of relative expression levels of Ser2‐phosphorylated and total RNA pol II in (A, B). Data are mean with SD; *P ≤ 0.05, **P ≤ 0.01, ***P ≤ 0.001; unpaired two‐tailed t‐tests (n = 4 biological replicates).
- D, E
Western blot analysis of subcellular fractions from cells treated with DMSO or CHX for Calnexin, GAPDH and histone H3 (D), and Cyclin T1 and CDK9 (E). Cyt, cytosol; nuc+org, nuclear soluble proteins and organelles; chr, chromatin‐associated proteins.
- F
Quantification of relative expression of Cyclin T1 and CDK9 in subcellular fractions in (E). Data are mean with SD; *P ≤ 0.05, **P ≤ 0.01, ***P ≤ 0.001, ****P ≤ 0.0001, n.s. not significant; one‐way ANOVA with Tukey's multiple comparisons test (n = 3 biological replicates).
- G
Western blot analysis of Cyclin T1 levels in HNRNPR +/+ and −/− cells treated with DMSO or MG132. α‐Tubulin served as loading control.
- H
Quantification of relative expression levels of Cyclin T1 in (G). Data are mean with SD; ***P ≤ 0.001, ****P ≤ 0.0001, n.s. not significant; two‐way ANOVA with Sidak's multiple comparisons test (n = 3 biological replicates).

- A
TPM expression values for mRNAs encoding Cylin T1, T2 and K from RNA‐seq data of wildtype HeLa cells (n = 4 biological replicates). Data are mean with SD (n = 4 biological replicates).
- B
Western blot analysis of Cyclin K, CDK9 and α‐Tubulin in the input lysates used for co‐immunoprecipitation.
- C
Western blot analysis of Cyclin K co‐immunoprecipitated by an anti‐CDK9 antibody. Immunoprecipitation with rabbit‐IgG antibody was used as control.
- D
Quantification of Cyclin K co‐immunoprecipitating with CDK9 in (C). Data are mean with SD; *P ≤ 0.05; unpaired two‐tailed t‐test (n = 3 biological replicates).

- A, B
Volcano plots showing the logarithmized adjusted P‐values (P adj) and fold changes of transcript alterations in HNRNPR −/− (A) and 7SK−/− (B) cells relative to their +/+ controls (n = 4 biological replicates for HNRNPR +/+, −/− and 7SK+/+; n = 2 biological replicates for 7SK−/−).
- C
Venn diagram depicting numbers of transcripts significantly altered in HNRNPR −/− relative to +/+ cells, and in 7SK−/− relative to +/+ cells, and their overlap.
- D
Scatter plot of the logarithmized fold changes (log2FC) of transcripts significantly altered in both HNRNPR −/− and 7SK−/− cells relative to their +/+ controls.
Similar articles
-
P-TEFb: The master regulator of transcription elongation.Mol Cell. 2023 Feb 2;83(3):393-403. doi: 10.1016/j.molcel.2022.12.006. Epub 2023 Jan 3. Mol Cell. 2023. PMID: 36599353 Free PMC article. Review.
-
The transcription-dependent dissociation of P-TEFb-HEXIM1-7SK RNA relies upon formation of hnRNP-7SK RNA complexes.Mol Cell Biol. 2007 Oct;27(20):6996-7006. doi: 10.1128/MCB.00975-07. Epub 2007 Aug 20. Mol Cell Biol. 2007. PMID: 17709395 Free PMC article.
-
Bromodomain and extra-terminal (BET) bromodomain inhibition activate transcription via transient release of positive transcription elongation factor b (P-TEFb) from 7SK small nuclear ribonucleoprotein.J Biol Chem. 2012 Oct 19;287(43):36609-16. doi: 10.1074/jbc.M112.410746. Epub 2012 Sep 5. J Biol Chem. 2012. PMID: 22952229 Free PMC article.
-
Two-pronged binding with bromodomain-containing protein 4 liberates positive transcription elongation factor b from inactive ribonucleoprotein complexes.J Biol Chem. 2012 Jan 6;287(2):1090-9. doi: 10.1074/jbc.M111.282855. Epub 2011 Nov 14. J Biol Chem. 2012. PMID: 22084242 Free PMC article.
-
7SK RNA, a non-coding RNA regulating P-TEFb, a general transcription factor.RNA Biol. 2009 Apr-Jun;6(2):122-8. doi: 10.4161/rna.6.2.8115. Epub 2009 Apr 6. RNA Biol. 2009. PMID: 19246988 Review.
Cited by
-
Conserved role of hnRNPL in alternative splicing of epigenetic modifiers enables B cell activation.EMBO Rep. 2024 Jun;25(6):2662-2697. doi: 10.1038/s44319-024-00152-3. Epub 2024 May 14. EMBO Rep. 2024. PMID: 38744970 Free PMC article.
-
An evolutionarily conserved tryptophan cage promotes folding of the extended RNA recognition motif in the hnRNPR-like protein family.Protein Sci. 2025 May;34(5):e70127. doi: 10.1002/pro.70127. Protein Sci. 2025. PMID: 40247750 Free PMC article.
-
Contributions of Folded and Disordered Domains to RNA Binding by HNRNPR.bioRxiv [Preprint]. 2025 May 1:2025.05.01.651718. doi: 10.1101/2025.05.01.651718. bioRxiv. 2025. PMID: 40654891 Free PMC article. Preprint.
-
P-TEFb: The master regulator of transcription elongation.Mol Cell. 2023 Feb 2;83(3):393-403. doi: 10.1016/j.molcel.2022.12.006. Epub 2023 Jan 3. Mol Cell. 2023. PMID: 36599353 Free PMC article. Review.
-
Single-molecule live imaging of subunit interactions and exchange within cellular regulatory complexes.Mol Cell. 2025 Aug 7;85(15):2854-2868.e7. doi: 10.1016/j.molcel.2025.06.028. Epub 2025 Jul 23. Mol Cell. 2025. PMID: 40706597
References
-
- Blighe K, Rana S, Lewis M (2018) EnhancedVolcano: publication‐ready volcano plots with enhanced colouring and labeling. https://github.com/kevinblighe/EnhancedVolcano
Publication types
MeSH terms
Substances
Associated data
- Actions
LinkOut - more resources
Full Text Sources
Molecular Biology Databases
Research Materials
Miscellaneous

