. 2022 Jul 21;19(9):1334-1351.
doi: 10.20892/j.issn.2095-3941.2022.0050.

Panoramic comparison between NK cells in healthy and cancerous liver through single-cell RNA sequencing

Affiliations

Panoramic comparison between NK cells in healthy and cancerous liver through single-cell RNA sequencing

Huan Liu et al. Cancer Biol Med. .

Abstract

Objective: NK cells play crucial roles in the immune defense mechanisms against viral infections and transformed cells. However, the developmental progression, transcriptomic landscape, and functional subtypes of liver NK cells are not well defined. Hepatocellular carcinoma (HCC) accounts for approximately 80% of primary liver cancer worldwide, yet the biological characteristics of NK cells in the HCC environment are unclear. Therefore, we aimed to determine these cells' roles in tumorigenesis and prognosis.

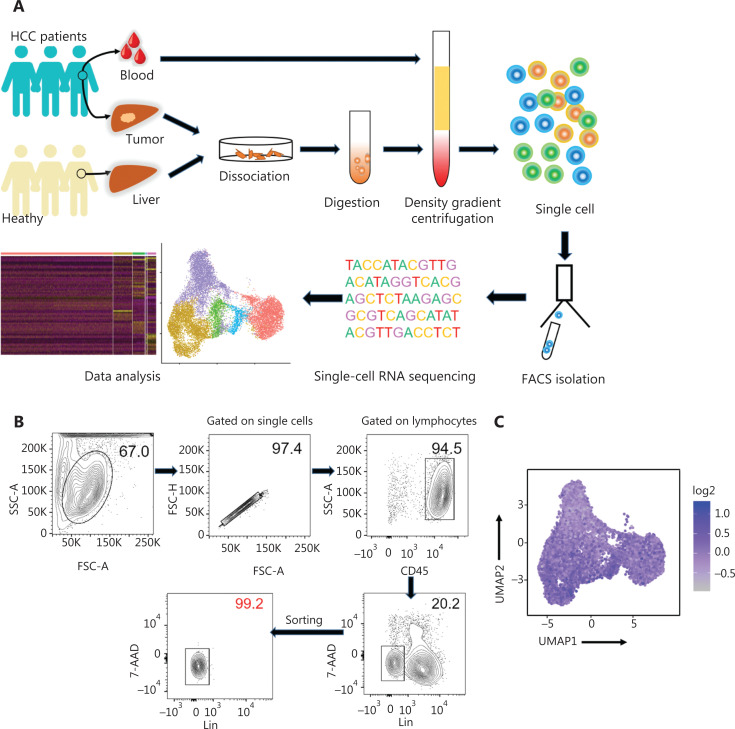
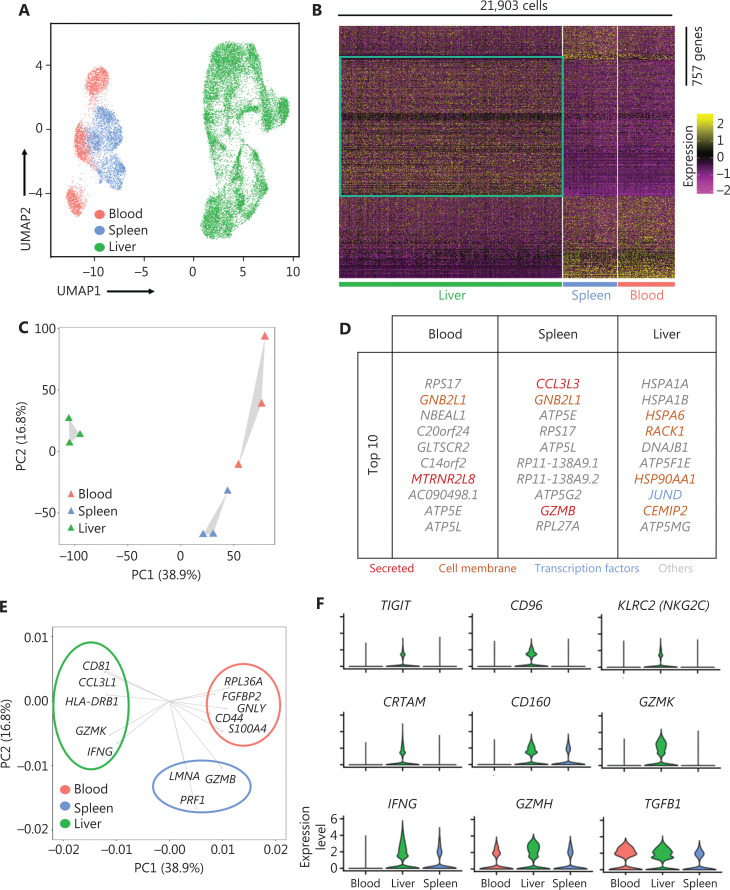
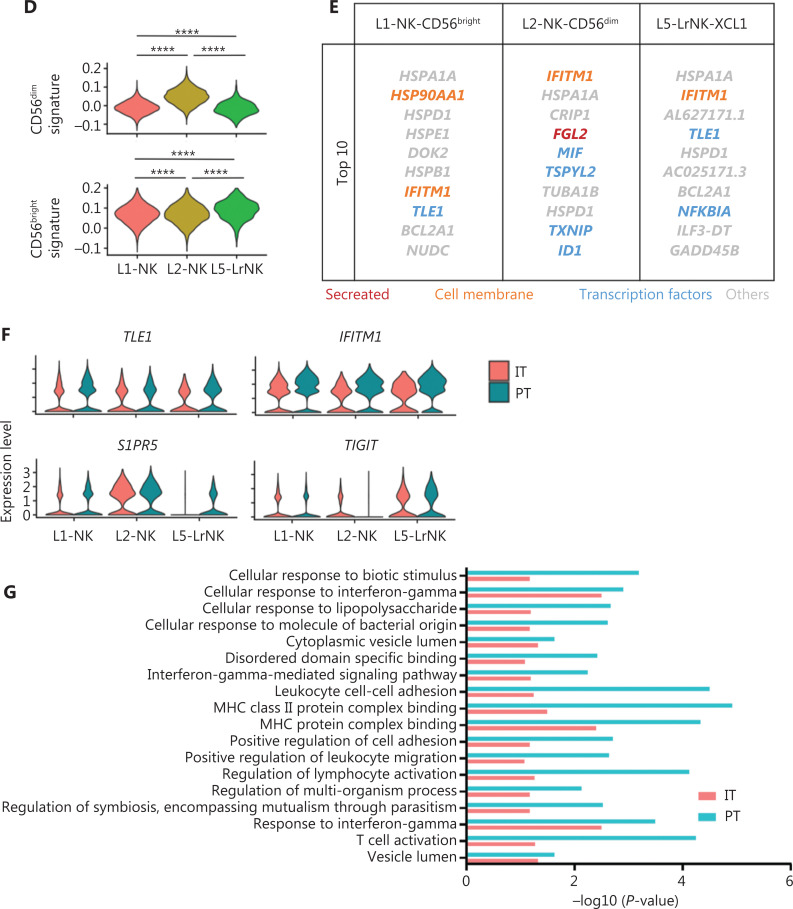
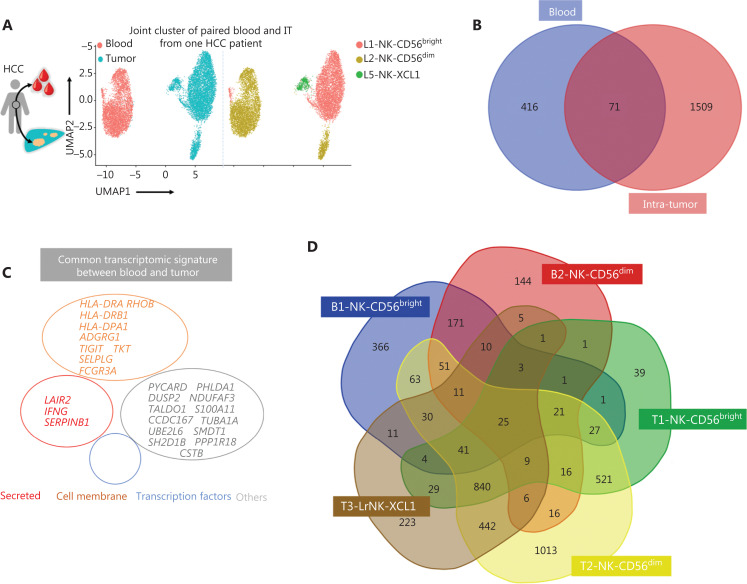
Methods: We compared the single-cell RNA sequencing profiles of NK cells purified from blood (n = 1), healthy liver tissues (n = 3), HCC tumor tissues (n = 4), and peritumor liver tissues (n = 1) to identify NK cell subsets. Furthermore, we performed bioinformatics analysis by using The Cancer Genome Atlas (TCGA) data to identify prognostic biomarkers simultaneously overexpressed in the blood and tumor tissues of patients with HCC.

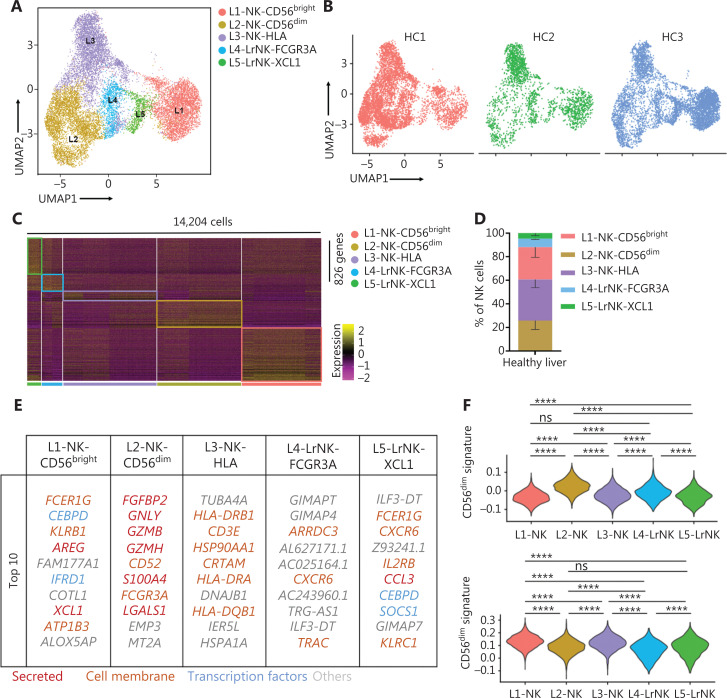
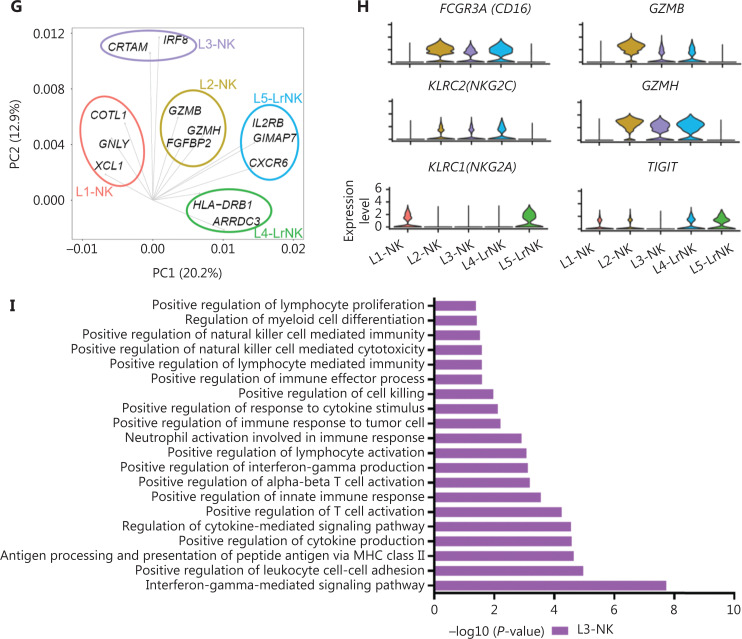
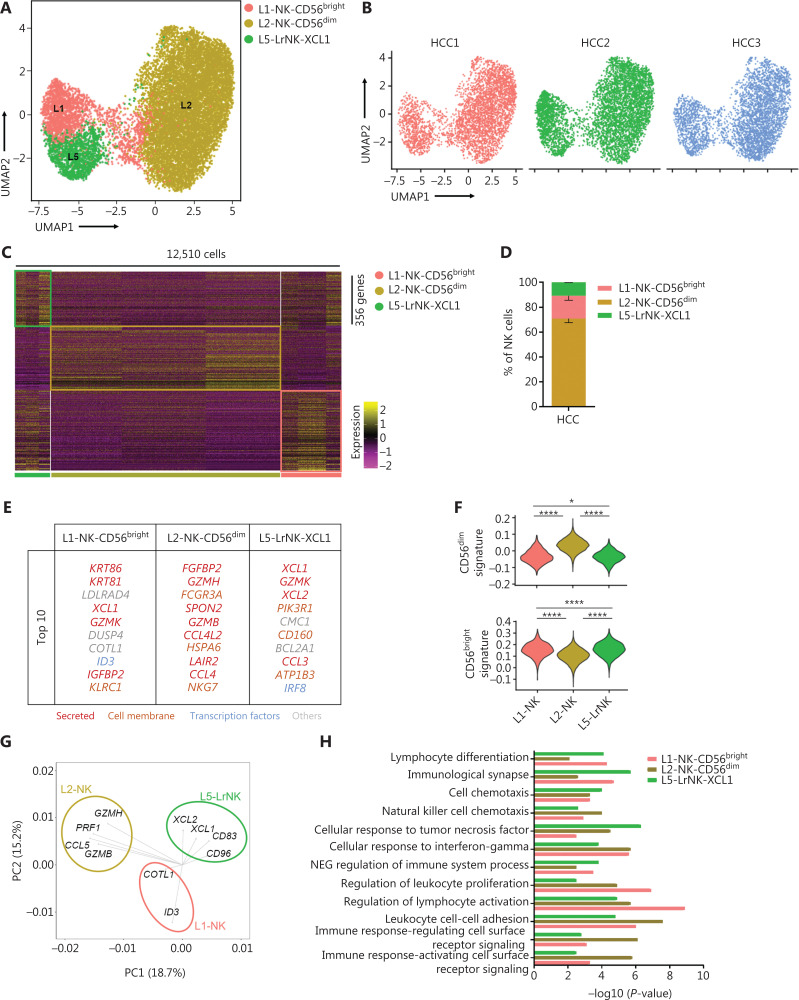
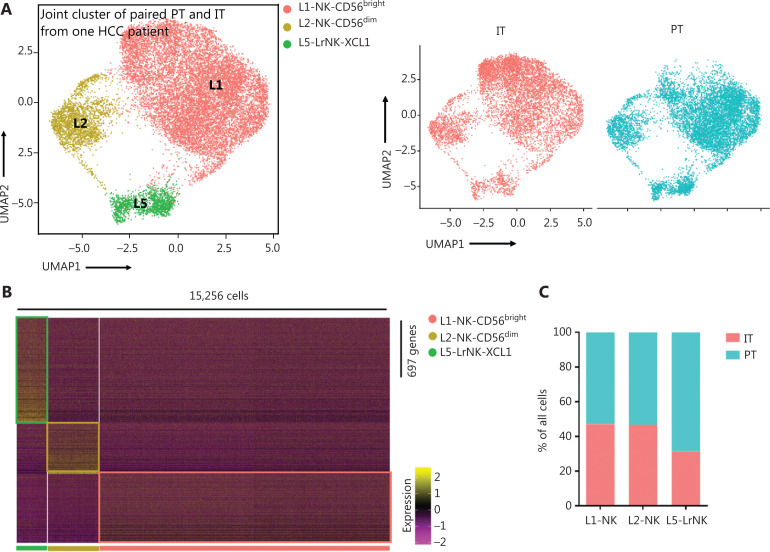
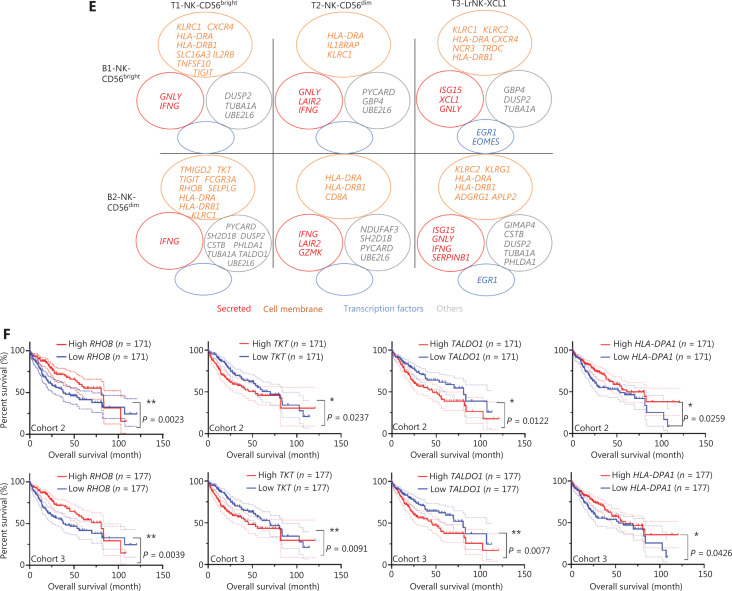
Results: Transcriptomic analysis revealed 5 NK cell subsets (L1-NK-CD56bright, L2-NK-CD56dim, L3-NK-HLA, L4-LrNK-FCGR3A, and L5-LrNK-XCL1) in the healthy liver tissues. However, the transitional L3 subset and the CXCR6+CD16+ L4 subset with strong anti-tumor activity were absent in the HCC and peritumor liver tissues. Furthermore, 4 common prognosis-associated genes (RHOB, TALDO1, HLA-DPA1, and TKT) were significantly overexpressed in the paired tumor tissue and blood.

Conclusions: Our study revealed 5 specific subsets of NK cells in healthy human liver tissues. However, only 3 of the 5 NK cell subsets were present in HCC and peritumor tissues. The cytotoxic NK cell subsets were absent in HCC tissues. Furthermore, we identified 4 potential non-invasive prognostic biomarkers in patients with HCC.

Keywords: Hepatocellular carcinoma; heterogeneity; natural killer cell; prognosis; single-cell RNA sequencing.


Conflict of interest statement

No potential conflicts of interest are disclosed.

Figures

Figure 1
Figure 1
Study design and basic information for single cell RNA-seq analysis of human innate lymphoid cells. (A) Scheme of the overall study design. We performed 10x Genomics scRNA-seq on innate lymphoid cells derived from the livers (n = 3) of healthy control donors, as well as blood (n = 1), tumor (n = 4), and tumor-adjacent liver tissue (n = 1) from treatment-naive patients with HCC. The output data were integrated and combined for downstream analysis. (B) Flow cytometry plot of a representative human liver sample, illustrating the gating strategy used to sort innate lymphoid cells. Human innate lymphoid cells were defined as living single-cell Lin- (CD34- CD3- CD14- CD1α- CD19- FcεRIα-) CD45+ 7-AAD- lymphocytes. SSC, side scatter; FSC, forward scatter. (C) UMAP plot showing NK cell feature scores. Feature genes, defined according to Crinier et al., included CD160, CD244, CHST12, CST7, GNLY, IL18RAP, IL2RB, KLRC1, KLRC3, KLRD1, KLRF1, PRF1, and XCL2.
Figure 2
Figure 2
Liver NK cells are highly distinct from spleen and peripheral blood NK cells. (A) UMAP plot of healthy donor NK cells from human blood (red, 3,763 cells), spleen (blue, 3,543 cells), and liver (green, 14,597 cells) samples. (B) Heatmap of 757 informative genes for distinguishing human blood (213 genes), spleen (189 genes), and liver (355 genes) NK cells. Cells are plotted in columns by organ source, and genes are shown in rows, ranked by adjusted P value < 0.05 (Wilcoxon rank sum test). Gene expression is color coded with a scale based on z-score distribution, from −2 (purple) to 2 (yellow). (C) PCA for the 3 human organ NK cell subsets from each sample, according to the mean expression of the genes. Each triangle represents 1 sample, colored by organ. (D) Top 10 genes significantly differentially expressed among the 3 human organ NK cell subsets. Genes are ranked by log2 fold-change. (E) Genes driving human blood, spleen, or liver NK cell identity (according to the loading value), colored by cell origin. (F) Expression distribution (violin plots) in each population (horizontal axes), for known NK cell genes.
Figure 3
Figure 3
High-throughput scRNA-seq identifies 5 NK cell subsets in the healthy human liver. (A) UMAP projection of NK cells from an integrated analysis of NK cells from 3 healthy control donors, showing the formation of 5 main subsets identified according to the gene expression characteristics of each subset. (B) UMAP plot of human liver NK cells from healthy livers, colored by donor (HC1: 6,234 cells; HC2: 2,124 cells; and HC3: 5,846 cells). (C) Heatmap of the 826 genes assessed with a Wilcoxon rank sum test separating the 14,204 NK cells into 5 main subsets, shown in different colors. Squares identify specific transcriptomic signatures of the distinct cell subsets. (D) The proportions for the 5 subsets defined among NK cells from the 3 healthy control donors across all liver NK cells. (E) Top 10 genes significantly differentially expressed (Wilcoxon rank sum test) among the 5 liver NK cell subsets. Genes are ranked by log2 fold-change. (F) Module scores of CD56dim and CD56bright gene expression programs defined by Hanna et al.. Violin plots representing the distribution of module scores for CD56dim (top) CD56bright (bottom) for each liver NK cell subset (Kruskal-Wallis ANOVA followed by Dunn’s multiple comparisons test). Nonsignificant (ns) P > 0.05; ****P < 0.0001. (G) PCA for the 5 liver NK cell subsets’ driving genes. (H) Violin plots comparing the expression of selected NK cell markers in this scRNA-seq dataset. The violin represents the probability density at each value. (I) Selected Gene Ontology terms using genes upregulated (log2 fold-change > 0.25) within the L3 subset with an adjusted P < 0.05.
Figure 3
Figure 3
High-throughput scRNA-seq identifies 5 NK cell subsets in the healthy human liver. (A) UMAP projection of NK cells from an integrated analysis of NK cells from 3 healthy control donors, showing the formation of 5 main subsets identified according to the gene expression characteristics of each subset. (B) UMAP plot of human liver NK cells from healthy livers, colored by donor (HC1: 6,234 cells; HC2: 2,124 cells; and HC3: 5,846 cells). (C) Heatmap of the 826 genes assessed with a Wilcoxon rank sum test separating the 14,204 NK cells into 5 main subsets, shown in different colors. Squares identify specific transcriptomic signatures of the distinct cell subsets. (D) The proportions for the 5 subsets defined among NK cells from the 3 healthy control donors across all liver NK cells. (E) Top 10 genes significantly differentially expressed (Wilcoxon rank sum test) among the 5 liver NK cell subsets. Genes are ranked by log2 fold-change. (F) Module scores of CD56dim and CD56bright gene expression programs defined by Hanna et al.. Violin plots representing the distribution of module scores for CD56dim (top) CD56bright (bottom) for each liver NK cell subset (Kruskal-Wallis ANOVA followed by Dunn’s multiple comparisons test). Nonsignificant (ns) P > 0.05; ****P < 0.0001. (G) PCA for the 5 liver NK cell subsets’ driving genes. (H) Violin plots comparing the expression of selected NK cell markers in this scRNA-seq dataset. The violin represents the probability density at each value. (I) Selected Gene Ontology terms using genes upregulated (log2 fold-change > 0.25) within the L3 subset with an adjusted P < 0.05.
Figure 4
Figure 4
High-throughput scRNA-seq identifies 3 NK cell subsets in liver cancer. (A) UMAP projection of NK cells from 3 patients with HCC, showing 3 main subsets (in different colors). The putative functional description for each subset is based on the characteristic gene expression profiles of each subset. (B) UMAP plot of human liver NK cells from tumor infiltrating cells, colored by patient (HCC1: 3,902 cells; HCC2: 4,799 cells; and HCC3: 3,809 cells). (C) Heatmap of the 356 genes tested with a Wilcoxon rank sum test separating the 12,510 HCC-infiltrating NK cells into 3 main subsets shown in different colors. Squares identify specific transcriptomic signatures of different cell subsets. (D) The fractions of 3 subsets defined among NK cells in 3 patients with HCC across all liver NK cells. (E) Top 10 genes significantly differentially expressed among the 3 liver NK subsets. Genes are ranked by log2 fold-change. (F) Module scores of CD56dim and CD56bright gene expression programs defined by Hanna et al.. Violin plots representing the distribution of module scores for CD56dim (top) CD56bright (bottom) for each liver NK cell subset (Kruskal-Wallis ANOVA followed by Dunn’s multiple comparisons test). *P < 0.05; ****P < 0.0001. (G) PCA for the driving genes of 3 liver NK cell subsets from HCC. (H) Selected Gene Ontology terms using genes upregulated (log2 fold-change > 0.25) within each subset with an adjusted P < 0.05.
Figure 5
Figure 5
Comparison of NK cells in the IT and PT of the same patient with HCC. (A) UMAP projection of NK cells from 1 patient with HCC (ID 101; 15,256 cells), depicting 3 main subsets (shown in different colors). The functional description for each subset was determined according to gene expression profiles. UMAP plot of human liver NK cells from IT (6,976 cells) and PT (8,280 cells) of a patient with HCC. (B) Heatmap of the 697 genes tested with a Wilcoxon rank sum test separating the 15, 256 paired IT and PT NK cells into 3 main subsets (shown in different colors). Squares identify specific transcriptomic signatures for the distinct cell subsets. (C) The proportions of the 3 subsets from the IT and PT of a patient with HCC. (D) Module scores of CD56dim and CD56bright gene expression programs defined by Hanna et al.. Violin plots representing the distribution of module scores for CD56dim (top) CD56bright (bottom) for each liver NK subset (Kruskal-Wallis ANOVA followed by Dunn’s multiple comparisons test). ****P < 0.0001. (E) Top 10 genes significantly overexpressed in PT compared with IT in 3 liver NK subsets. Genes are ranked by log2 fold-change. (F) Violin plots showing expression comparison of selected genes in NK cells. (G) Selected Gene Ontology terms using genes upregulated (log2 fold-change > 0.25) within each origin with an adjusted P < 0.05.
Figure 5
Figure 5
Comparison of NK cells in the IT and PT of the same patient with HCC. (A) UMAP projection of NK cells from 1 patient with HCC (ID 101; 15,256 cells), depicting 3 main subsets (shown in different colors). The functional description for each subset was determined according to gene expression profiles. UMAP plot of human liver NK cells from IT (6,976 cells) and PT (8,280 cells) of a patient with HCC. (B) Heatmap of the 697 genes tested with a Wilcoxon rank sum test separating the 15, 256 paired IT and PT NK cells into 3 main subsets (shown in different colors). Squares identify specific transcriptomic signatures for the distinct cell subsets. (C) The proportions of the 3 subsets from the IT and PT of a patient with HCC. (D) Module scores of CD56dim and CD56bright gene expression programs defined by Hanna et al.. Violin plots representing the distribution of module scores for CD56dim (top) CD56bright (bottom) for each liver NK subset (Kruskal-Wallis ANOVA followed by Dunn’s multiple comparisons test). ****P < 0.0001. (E) Top 10 genes significantly overexpressed in PT compared with IT in 3 liver NK subsets. Genes are ranked by log2 fold-change. (F) Violin plots showing expression comparison of selected genes in NK cells. (G) Selected Gene Ontology terms using genes upregulated (log2 fold-change > 0.25) within each origin with an adjusted P < 0.05.
Figure 6
Figure 6
Comparison of NK cells in the tumor and peripheral blood of the same patient with HCC. (A) UMAP plot of human liver NK cells from 1 patient with HCC tumor (6,820 cells) and peripheral blood (4,756 cells), colored by cell origin (left) and subset (right). (B) Venn diagram showing common genes elevated in NK cells from tumor tissue (relative to peritumor tissue, log2 fold-change > 0) and those from HCC blood (relative to healthy blood, log2 fold-change > 0). (C) Common transcriptomic signature between genes elevated in all NK cell subsets from tumor tissue (relative to peritumor tissue, log2 fold-change > 0) and those from HCC blood (relative to healthy blood, log2 fold-change > 0). (D) Venn diagram showing common genes among NK cell subsets from HCC blood and tumor tissue (log2 fold-change > 0). (E) Common subset-specific immune-associated transcriptomic signatures between NK cell subsets from HCC blood and tumor tissue (log2 fold-change > 0). (F) Kaplan–Meier survival curves for the duration of OS in months, according to the gene expression levels of RHOB, TALDO1, HLA-DPA1, and TKT in IT from patients with HCC from cohort 2 and cohort 3 (high densities, red line; low densities, blue line) (log-rank test). *P < 0.05; **P < 0.01.
Figure 6
Figure 6
Comparison of NK cells in the tumor and peripheral blood of the same patient with HCC. (A) UMAP plot of human liver NK cells from 1 patient with HCC tumor (6,820 cells) and peripheral blood (4,756 cells), colored by cell origin (left) and subset (right). (B) Venn diagram showing common genes elevated in NK cells from tumor tissue (relative to peritumor tissue, log2 fold-change > 0) and those from HCC blood (relative to healthy blood, log2 fold-change > 0). (C) Common transcriptomic signature between genes elevated in all NK cell subsets from tumor tissue (relative to peritumor tissue, log2 fold-change > 0) and those from HCC blood (relative to healthy blood, log2 fold-change > 0). (D) Venn diagram showing common genes among NK cell subsets from HCC blood and tumor tissue (log2 fold-change > 0). (E) Common subset-specific immune-associated transcriptomic signatures between NK cell subsets from HCC blood and tumor tissue (log2 fold-change > 0). (F) Kaplan–Meier survival curves for the duration of OS in months, according to the gene expression levels of RHOB, TALDO1, HLA-DPA1, and TKT in IT from patients with HCC from cohort 2 and cohort 3 (high densities, red line; low densities, blue line) (log-rank test). *P < 0.05; **P < 0.01.

References

    1. Vivier E, Artis D, Colonna M, Diefenbach A, Di Santo JP, Eberl G, et al. Innate Lymphoid Cells: 10 Years On. Cell. 2018;174:1054–66. - PubMed
    1. Mace EM, Orange JS. Emerging insights into human health and NK cell biology from the study of NK cell deficiencies. Immunol Rev. 2019;287:202–25. - PMC - PubMed
    1. Sun JC, Lanier LL. NK cell development, homeostasis and function: parallels with CD8(+) T cells. Nat Rev Immunol. 2011;11:645–57. - PMC - PubMed
    1. Zhang Q, Bi J, Zheng X, Chen Y, Wang H, Wu W, et al. Blockade of the checkpoint receptor TIGIT prevents NK cell exhaustion and elicits potent anti-tumor immunity. Nat Immunol. 2018;19:723–32. - PubMed
    1. Zhang C, Hu Y, Xiao W, Tian Z. Chimeric antigen receptor- and natural killer cell receptor-engineered innate killer cells in cancer immunotherapy. Cell Mol Immunol. 2021;18:2083–100. - PMC - PubMed

Publication types