. 2022 Aug 30;13(4):e0167222.
doi: 10.1128/mbio.01672-22. Epub 2022 Jul 20.

Impaired Succinate Oxidation Prevents Growth and Influences Drug Susceptibility in Mycobacterium tuberculosis

Affiliations

Impaired Succinate Oxidation Prevents Growth and Influences Drug Susceptibility in Mycobacterium tuberculosis

Cara Adolph et al. mBio. .

Abstract

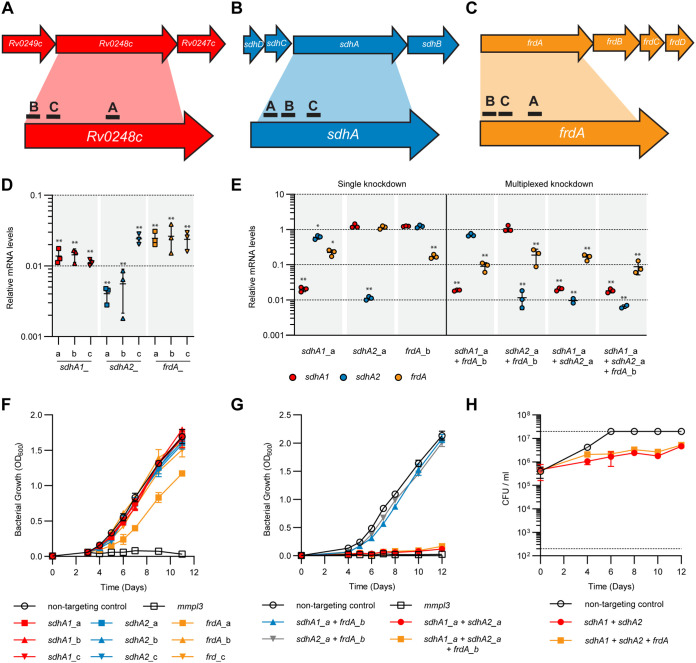
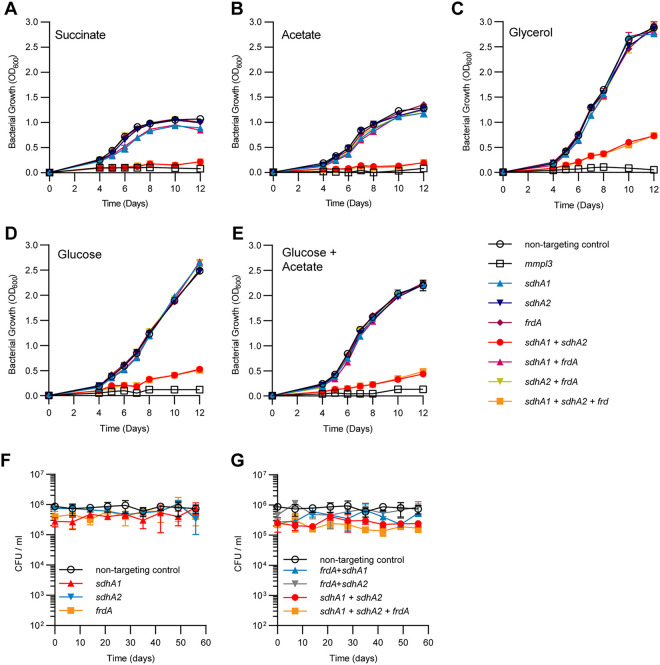
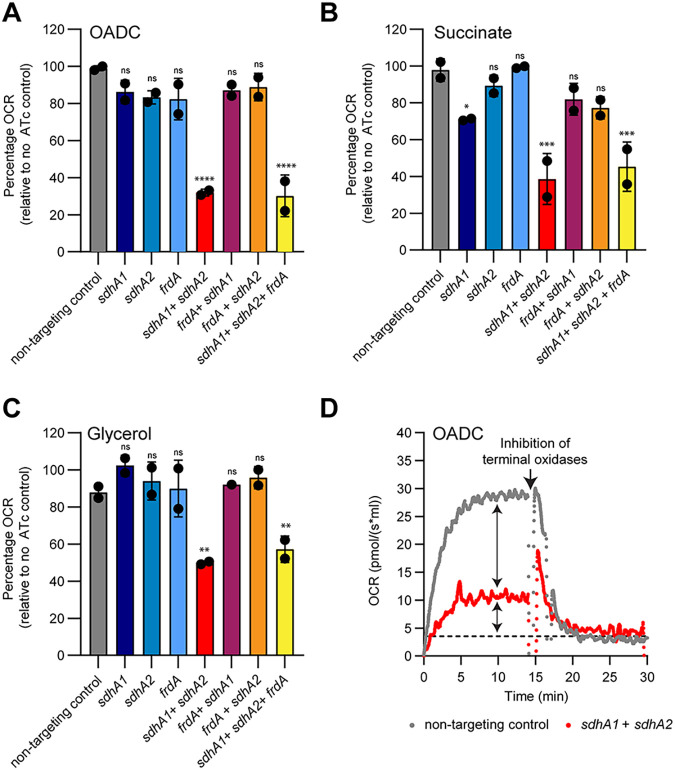
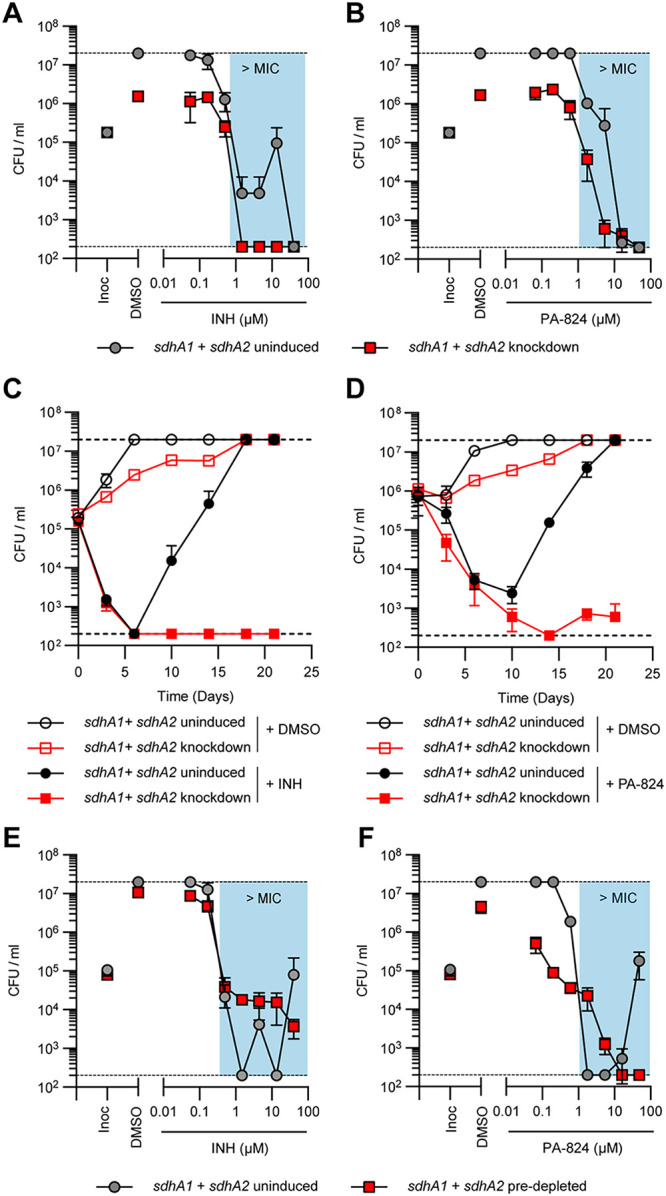
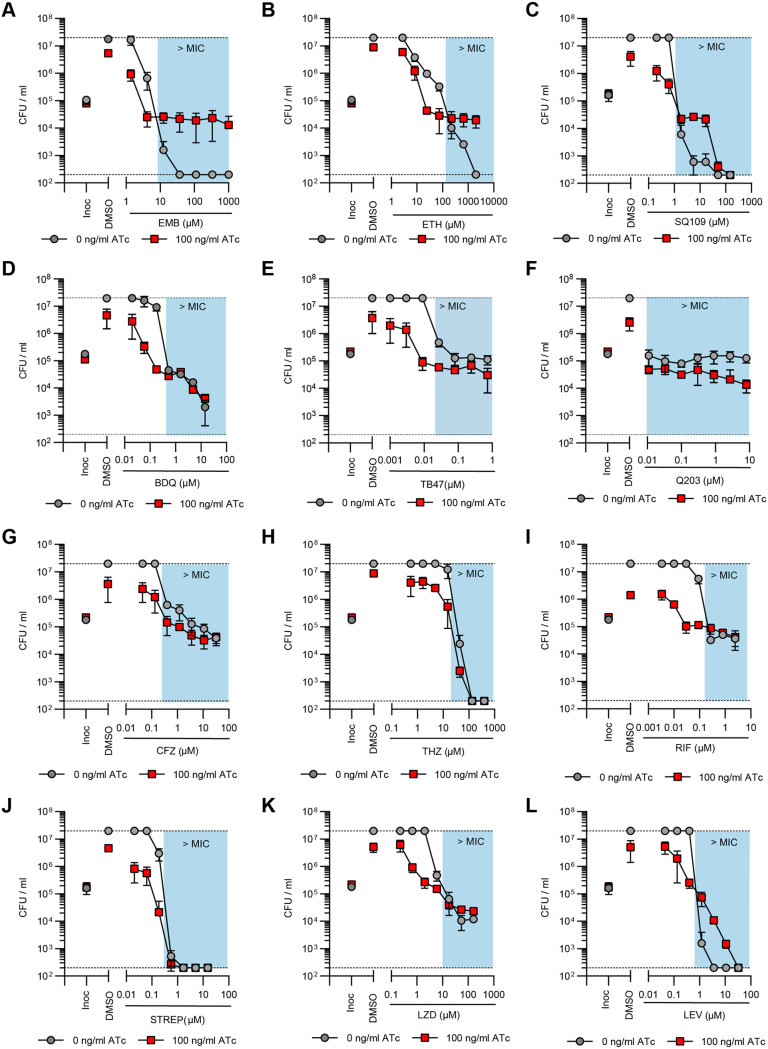
Succinate is a major focal point in mycobacterial metabolism and respiration, serving as both an intermediate of the tricarboxylic acid (TCA) cycle and a direct electron donor for the respiratory chain. Mycobacterium tuberculosis encodes multiple enzymes predicted to be capable of catalyzing the oxidation of succinate to fumarate, including two different succinate dehydrogenases (Sdh1 and Sdh2) and a separate fumarate reductase (Frd) with possible bidirectional behavior. Previous attempts to investigate the essentiality of succinate oxidation in M. tuberculosis have relied on the use of single-gene deletion mutants, raising the possibility that the remaining enzymes could catalyze succinate oxidation in the absence of the other. To address this, we report on the use of mycobacterial CRISPR interference (CRISPRi) to construct single, double, and triple transcriptional knockdowns of sdhA1, sdhA2, and frdA in M. tuberculosis. We show that the simultaneous knockdown of sdhA1 and sdhA2 is required to prevent succinate oxidation and overcome the functional redundancy within these enzymes. Succinate oxidation was demonstrated to be essential for the optimal growth of M. tuberculosis, with the combined knockdown of sdhA1 and sdhA2 significantly impairing the activity of the respiratory chain and preventing growth on a range of carbon sources. Moreover, impaired succinate oxidation was shown to influence the activity of cell wall-targeting antibiotics and bioenergetic inhibitors against M. tuberculosis. Together, these data provide fundamental insights into mycobacterial physiology, energy metabolism, and antimicrobial susceptibility. IMPORTANCE New drugs are urgently required to combat the tuberculosis epidemic that claims 1.5 million lives annually. Inhibitors of mycobacterial energy metabolism have shown significant promise clinically; however, further advancing this nascent target space requires a more fundamental understanding of the respiratory enzymes and pathways used by Mycobacterium tuberculosis. Succinate is a major focal point in mycobacterial metabolism and respiration; yet, the essentiality of succinate oxidation and the consequences of inhibiting this process are poorly defined. In this study, we demonstrate that impaired succinate oxidation prevents the optimal growth of M. tuberculosis on a range of carbon sources and significantly reduces the activity of the electron transport chain. Moreover, we show that impaired succinate oxidation both positively and negatively influences the activity of a variety of antituberculosis drugs. Combined, these findings provide fundamental insights into mycobacterial physiology and drug susceptibility that will be useful in the continued development of bioenergetic inhibitors.

Keywords: CRISPR interference; Mycobacterium tuberculosis; succinate dehydrogenase.


Conflict of interest statement

The authors declare no conflict of interest.

Figures

FIG 1
FIG 1
Single and multiplexed transcriptional repression of sdhA1, sdhA2, and frdA in M. tuberculosis using CRISPRi. (A to C) Location of sgRNAs targeting the catalytic subunits of Sdh1 (A), Sdh2 (B), and Frd (C) in M. tuberculosis. sgRNAs were coexpressed with a dCas9sth1 under the control of an ATc-inducible promoter. (D) CRISPRi achieves high-level knockdown of target genes in single repression constructs. RNA was harvested 72 h after inducing knockdown (100 ng/mL ATc) and quantified by qPCR. mRNA is expressed relative to a strain expressing a nontargeting control. Results are mean ± standard deviation for three technical triplicates. ** indicates a P value of <0.005 from a one-way analysis of variance (ANOVA) with a Dunnett correction comparing each sgRNA to the nontargeting control. (E) CRISPRi achieves high-level knockdown of sdhA1, sdhA2, and frdA in single, double, and triple gene repression constructs. Gene knockdown was quantified and visualized as in panel D. Statistical significance was calculated using a one-way analysis of variance and a Dunnett test for multiple comparisons of the gene expression in each strain against the nontargeting control; *, P < 0.01; **, P < 0.001. (F) Consequences of the single knockdown of sdhA1, sdhA2, and frdA for the growth of M. tuberculosis in 7H9 medium supplemented with OADC. Knockdown was induced at time zero with ATc (100 ng/mL). An mmpL3-targeting sgRNA, which has bactericidal consequences for the viability of M. tuberculosis (48), was included as a positive inhibition control. The means and standard deviation for three replicates are shown. (G and H) Consequences of multiplexed sdhA1, sdhA2, and frdA gene repression for the growth (G) and viability (H) of M. tuberculosis in 7H9 medium supplemented with OADC. Dotted horizontal lines in panel H represent the upper and lower limits of detection of CFU. The means and standard deviation for three replicates are shown. Data in panels G and H are representative of three independent experiments.
FIG 2
FIG 2
Succinate oxidation is essential for the optimal growth of M. tuberculosis but is dispensable for survival under nutrient starvation. (A to E) Growth profiles of M. tuberculosis single and multiplexed sdhA1, sdhA2, and frdA knockdown strains in 7H9 medium supplemented with 30 mM succinate (A), 0.2% acetate (B), 0.2% glycerol (C), 20 mM glucose (D), or a combination of 0.1% acetate and 10 mM glucose (E). Cultures were grown in 10-mL volumes from a starting OD600 of 0.005, and gene knockdown was induced at time zero with ATc (100 ng/mL). An mmpl3 knockdown strain was included as a positive inhibition control. The means and standard deviation for three replicates are shown. Each experiment was repeated twice. (F and G) Consequences of the single (F) or multiplexed (G) depletion of Sdh1, Sdh2, or Frd for the survival of M. tuberculosis under a nutrient starvation model of nonreplicating persistence. Before entering nutrient starvation, cells were predepleted of SDH and FRD enzymes by inducing transcriptional repression of target genes for 8 days. Cultures were then harvested, washed twice in PBS, and nutrient starved by inoculation into inkwells containing PBS plus tyloxapol. Viability was measured by enumerating CFU per milliliter over 8 weeks. Error bars represent the standard deviation from three replicates.
FIG 3
FIG 3
Succinate oxidation is the major contributor of electrons to the respiratory chain in M. tuberculosis. (A to C) Oxygen consumption rates (OCR) of the single and multiplexed sdhA1, sdhA2, and frdA knockdown strains when energized with OADC (A), succinate (B), or glycerol (C). Cultures were grown for 8 days in the presence of 100 ng/mL ATc to deplete cells of SDH/FRD enzymes in 7H9 medium containing the specified carbon sources before performing OCR measurements on cell suspensions. Data were normalized to the respective no-ATc control for each strain. 100% for OADC = ~30.0 pmol/(s × mL), for succinate = ~30.0 pmol/(s × mL), and for glycerol = ~35.0 pmol/(s × mL). Error bars represent the mean and standard deviation for two technical replicates, and data are representative of two independent experiments. Statistical significance was calculated using a one-way analysis of variance and a Dunnett test for multiple comparisons of each strain against the nontargeting control; ns, P > 0.05; *, P < 0.05; **, P < 0.01; ***, P < 0.001; and ****, P < 0.0001. (D) Chemical inhibition of both terminal oxidases with Q203 (400 nM) and ND-011992 (100 μM) demonstrates that succinate oxidation is the major contributor of electrons to the respiratory chain. Cultures were grown for 8 days in the presence of 100 ng/mL ATc to deplete cells of SDH/FRD enzymes in 7H9-OADC medium before performing OCR measurements on cell suspensions. Dashed horizonal lines in panel D represent the baseline OCR. Arrows represent the contribution of succinate oxidation to the OCR of M. tuberculosis and the residual OCR in the absence of succinate oxidation, respectively. Data are representative of two independent experiments.
FIG 4
FIG 4
Impaired succinate oxidation by the joint transcriptional repression of sdhA1 and sdhA2 alters INH and PA-824 susceptibility and resistance in M. tuberculosis. (A and B) Effect of the transcriptional repression of sdhA1 and sdhA2 on the susceptibility of M. tuberculosis to INH (A) and PA-824 (B) when gene knockdown was induced simultaneously with antibiotic challenge. Cultures were grown in 96-well plates from a starting OD600 of 0.005 with 0 or 100 ng/mL ATc and a 7-point, 3-fold dilution gradient of each drug. Viability was determined after 10 days of incubation, and CFU per milliliter was enumerated after 5 weeks. Results are means and standard deviations from three replicates and are representative of three independent experiments. (C and D) Viability of M. tuberculosis sdhA1 + sdhA2 knockdown strains treated with INH (C) or PA-824 (D). Cultures were grown in 7H9-OADC-PAN-KAN medium in 10-mL volumes from a starting OD600 of 0.005. Knockdown was induced with 100 ng/mL ATc on day 0, and CFU per milliliter was determined on stated days. INH was used at 13.5 μM and PA-824 at 1.8 μM. Results are the mean and standard deviation for three replicates and are representative of three experiments. (E and F) Susceptibility of M. tuberculosis transcriptionally repressing sdhA1 and sdhA2 to INH (E) and PA-824 (F) when cells were predepleted of SDH enzymes prior to antibiotic challenge. Cultures were treated with 0 or 100 ng/mL ATc for 6 days to deplete cells of SDH enzymes, before harvesting cells and inoculating them into 96-well plates containing a 7-point, 3-fold dilution gradient of each drug and 0 or 100 ng/mL ATc at a starting OD600 of 0.005. Viability was determined by plating for CFU per milliliter after a further 10 days of incubation. Results are the means and standard deviations for three replicates and are representative of three independent experiments. Blue boxes in panels A, B, E, and F denote concentrations above the MIC of the no-knockdown control. Dashed horizontal lines represent the upper and lower levels of detection. Inoc, CFU per milliliter at inoculation (i.e., time = 0).
FIG 5
FIG 5
Impaired succinate oxidation by the dual depletion of Sdh1 and Sdh2 synergizes with bioenergetic inhibitors in M. tuberculosis but attenuates the activity of cell wall inhibitors. (A to C) Effect of the joint transcriptional repression of sdhA1 and sdhA2 on the susceptibility of M. tuberculosis to the cell wall inhibitors ethambutol (EMB) (A), ethionamide (ETH) (B), and SQ109 (C). (D to H) Effect of the joint transcriptional repression of sdhA1 and sdhA2 on the susceptibility of M. tuberculosis to bioenergetic inhibitors: BDQ (D), TB47 (E), Q203 (F), clofazimine (CFZ) (G), and thioridazine (THZ) (H). (I to L) Effect of the joint transcriptional repression of sdhA1 and sdhA2 on the susceptibility of M. tuberculosis to inhibitors of transcription, translation, or DNA replication: rifampicin (RIF) (I), streptomycin (STREP) (J), linezolid (LZD) (K), and levofloxacin (LEV) (L). Cultures were predepleted of SDH enzymes by inducing gene knockdown (0 or 100 ng/mL ATc) for 6 days and then inoculated into 96-well plates at a starting OD600 of 0.005 with 0 or 100 ng/mL ATc and a 7-point, 3-fold dilution gradient of each drug. Viability was determined after 10 days of incubation, and CFU per milliliter was enumerated after 5 weeks. Blue boxes denote concentrations above the MIC of the no-knockdown control. Dashed horizontal lines represent the upper and lower levels of detection. Results are the mean and standard deviation from three replicates and are representative of at least two independent experiments. Inoc, CFU per milliliter at inoculation (i.e., time = 0).

References

    1. World Health Organization. 2021. Global tuberculosis report. World Health Organization, Geneva, Switzerland.
    1. World Health Organization. 2010. Guidelines for the treatment of tuberculosis, 4th ed. World Health Organization, Geneva, Switzerland.
    1. Rittershaus ESC, Baek S-H, Krieger IV, Nelson SJ, Cheng Y-S, Nambi S, Baker RE, Leszyk JD, Shaffer SA, Sacchettini JC, Sassetti CM. 2018. A lysine acetyltransferase contributes to the metabolic adaptation to hypoxia in Mycobacterium tuberculosis. Cell Chem Biol 25:1495–1505.e3. doi:10.1016/j.chembiol.2018.09.009. - DOI - PMC - PubMed
    1. Munoz-Elias EJ, McKinney JD. 2005. Mycobacterium tuberculosis isocitrate lyases 1 and 2 are jointly required for in vivo growth and virulence. Nat Med 11:638–644. doi:10.1038/nm1252. - DOI - PMC - PubMed
    1. Marrero J, Rhee KY, Schnappinger D, Pethe K, Ehrt S. 2010. Gluconeogenic carbon flow of tricarboxylic acid cycle intermediates is critical for Mycobacterium tuberculosis to establish and maintain infection. Proc Natl Acad Sci USA 107:9819–9824. doi:10.1073/pnas.1000715107. - DOI - PMC - PubMed

Publication types