. 2022 Jul 8;11(7):16.
doi: 10.1167/tvst.11.7.16.

Ocular Surface Immune Cell Profiles in Contact Lens-Induced Discomfort

Affiliations

Ocular Surface Immune Cell Profiles in Contact Lens-Induced Discomfort

Archana Padmanabhan Nair et al. Transl Vis Sci Technol. .

Abstract

Purpose: Contact lens-induced discomfort (CLD) remains a primary factor in discontinuation or prevention of contact lens wear. Thus, we investigated the role of ocular surface immune cells in subjects with CLD.

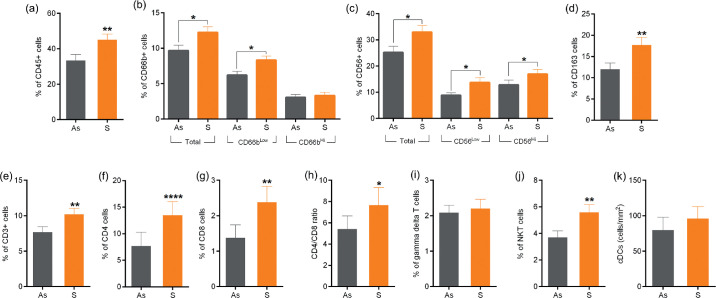
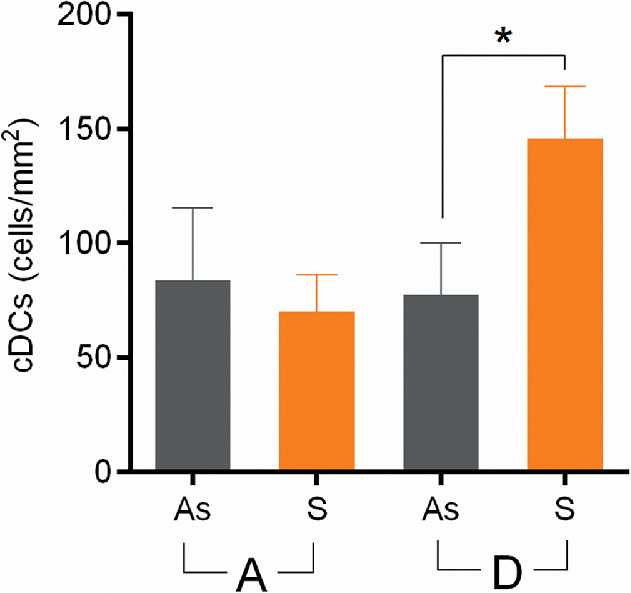
Methods: Habitual contact lens (CL) wearers with CLD (n = 19; 38 eyes) and without CLD (n = 21; 42 eyes) as determined by the Contact Lens Dry Eye Questionnaire-8 was included in a trial. Enrolled subjects used either of the two types of CL (designated as CL-A or CL-D). Ocular surface cells from the bulbar conjunctiva were obtained by impression cytology. The collected cells were phenotyped using fluorochrome-conjugated antibodies specific for leukocytes (CD45+), neutrophils (CD66b+,High,Low), macrophages (CD163+), T cells (CD3+CD4+, CD3+CD8+), natural killer (NK) cells (CD56+, High, Low), natural killer T (NKT) cells (CD3+CD56+), and gamma delta T (γδT) cells (CD3+γδTCR+) by flow cytometry. Further, corneal dendritic cell density (cDCD) was also determined using in vivo confocal microscopy.

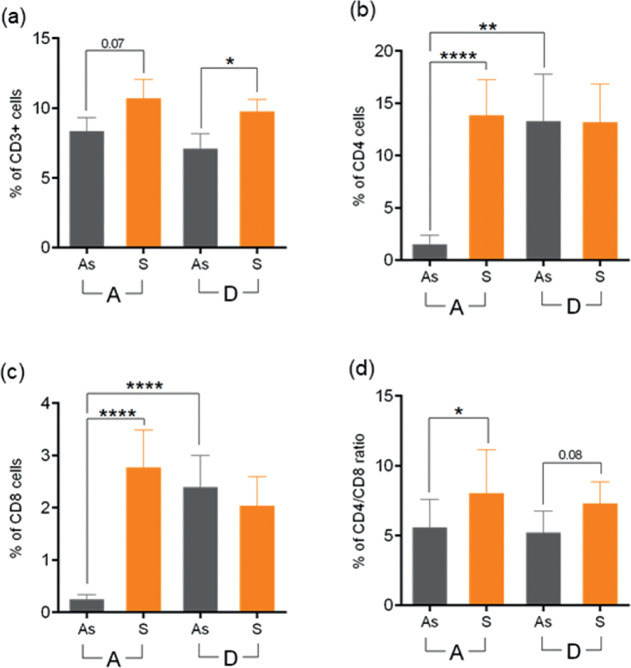
Results: Significantly higher proportions of CD45+ cells were observed in subjects with CLD compared to those without CLD. The percentages of CD66bTotal,Low, CD163+, pan T cells, CD4+T cells, CD8+T cells, CD56Total,High,Low (NK) cells, and NKT cells, as well as the CD4/CD8 ratio, were significantly higher in CLD subjects. The proportion of T cells (CD4, CD8, CD4/CD8 ratio, NKT cells) and macrophages exhibited a direct association with discomfort score. The percentages of CD45+, CD66bTotal,Low, CD163+, CD3+, CD56Total,High,Low, and NKT cells and cDCD were significantly higher in CLD subjects wearing CL-D. The percentages of CD66bHigh, CD4+T cells, CD8+T cells, NKT cells, and CD4/CD8 ratio were significantly higher in CLD subjects wearing CL-A.

Conclusions: Increased proportions of ocular surface immune cells are observed in CLD, and the lens type could impact the immune cells associated with CLD.

Translational relevance: The association between the proportion of altered ocular surface immune cell subsets and contact lens-induced discomfort underpins the importance of considering immune-related aspects during contact lens development and in the clinical management of ocular surface pain.


Conflict of interest statement

Disclosure: A.P. Nair, None; S. Sethu, None; H. Nagaraj, None; V. Kumar, None; S. Nagaraj, None; Z. Fadli, Johnson & Johnson Vision (E); C. Scales, Johnson & Johnson Vision (E); M. Chemaly, Johnson & Johnson Vision (E); X.-Y. Song, Johnson & Johnson Vision (E); A. Ghosh, None; B. Liang, Johnson & Johnson Vision (E)

Figures

Figure 1.
Figure 1.
CLDEQ-8 scores for CLD subjects wearing the different lens types. The graph indicates the CLDEQ-8 scores for subjects without CLD (As) and with CLD (S). A, CL-A users; D, CL-D users. CL-A As (20 eyes, n = 10), CL-A S (18 eyes, n = 9), CL-D As (22 eyes, n = 11), and CL-D S (20 eyes, n = 10). The bar graph represents mean ± SEM. *P < 0.05, **P < 0.01, ***P < 0.001 (Mann–Whitney test).
Figure 2.
Figure 2.
Dendritic cells at the level of subbasal nerve plexus in the cornea. The representative image for each of the study categories shows dendritic cells (indicated by yellow arrows) at the subbasal nerve plexus region. Panels shown are representative IVCM images with frame size 400 × 400 µm. (a) Representative image from CL-A user without CLD (asymptomatic). (b) Representative image from CL-D user without CLD (asymptomatic). (c) Representative image from CL-A user with CLD (symptomatic). (d) Representative image from CL-D user with CLD (symptomatic).
Figure 3.
Figure 3.
VAS score in CLD subjects wearing the different lens types after 2 weeks of CL wear. The graph indicates the VAS scores in subjects without CLD (As) and with CLD (S). A, CL-A users; D, CL-D users. CL-A As (20 eyes, n = 10), CL-A S (18 eyes, n = 9), CL-D As (22 eyes, n = 11), and CL-D S (20 eyes, n = 10). The bar graph represents mean ± SEM. *P < 0.05, **P < 0.01, ***P < 0.001 (Mann–Whitney test).
Figure 4.
Figure 4.
Profiles of ocular surface immune cell subsets in CLD. (a) The graph indicates the percentage of CD45+ cells (pan leukocyte marker) in the impression cytology samples from subjects without CLD (As, asymptomatic) and with CLD (S, symptomatic) as determined by flow cytometry. (b) The graph indicates the percentage of CD45+CD66bTotal (neutrophils), CD45+CD66bLow (inactive neutrophils), and CD45+CD66bHigh (activated neutrophils). (c) The graph indicates the percentages of NK cell subtypes (CD45+CD56Total, CD45+CD56Low, CD45+CD56High). Other graphs indicate (d) CD45+CD163+ cells (macrophages), (e) CD45+CD3+ cells (pan T cells), (f) CD45+CD3+CD4+ cells (T helper cells), (g) CD45+CD3+CD8+ cells (cytotoxic T cells), (h) CD4+/CD8+ ratio, (i) CD45+CD3+γδTCR+ cells (γδT cells), and (j) CD45+CD3+CD56+ cells (NKT cells). (k) The graph indicates the average cDCD (cells/mm2) as determined by IVCM in subjects without CLD (As) and with CLD (S). (a–j) As (42 eyes, n = 21); S (38 eyes, n = 19). (k) As (14 eyes, n = 7); S (12 eyes, n = 6). The bar graph represents mean ± SEM. *P < 0.05, **P < 0.01, ****P < 0.0001 (Mann–Whitney test).
Figure 5.
Figure 5.
Neutrophil and macrophage profiles for CLD subjects wearing the different lens types. The graphs indicate the percentage of (a) CD45+ (pan leukocyte marker); (b) CD45+CD66bTotal (neutrophils); (c) CD45+CD66bLow (inactive neutrophils); (d) CD45+CD66bHigh (activated neutrophils); and (e) CD45+CD163+ (macrophages) in the impression cytology samples from subjects without CLD (As) and with CLD (S) as determined by flow cytometry. A, CL-A users; D, CL-D users. CL-A As (20 eyes, n = 10), CL-A S (18 eyes, n = 9), CL-D As (22 eyes, n = 11), CL-D S (20 eyes, n = 10). The bar graph represents mean ± SEM. *P < 0.05, **P < 0.01, ***P < 0.001 (Mann–Whitney test).
Figure 6.
Figure 6.
NK cells subsets and γδT cell profiles for CLD subjects wearing the different lens types. The graph indicates the percentage of (a) CD45+CD56Total (total NK) cells; (b) CD45+CD56Low (cytotoxic NK) cells; (c) CD45+CD56High (cytokine-producing low cytotoxic NK) cells; (d) CD45+CD3+CD56+ (NKT) cells; and (e) CD45+CD3+γδTCR+ cells in the impression cytology samples from subjects without CLD (As) and with CLD (S) as determined by flow cytometry. A, CL-A users; D, CL-D users. CL-A As (20 eyes, n = 10), CL-A S (18 eyes, n = 9), CL-D As (22 eyes, n = 11), CL-D S (20 eyes, n = 10). The bar graph represents mean ± SEM. *P < 0.05, **P < 0.01 (Mann–Whitney test).
Figure 7.
Figure 7.
CD4 and CD8 T-cell profiles for CLD subjects wearing the different lens types. The graph indicates the percentage of (a) CD45+CD3+ (pan T cell marker) cells; (b), CD45+CD3+CD4+ (CD4 T helper) cells; (c) CD45+CD3+CD8+ (CD8 cytotoxic T) cells; and (d) CD4+/CD8+ T-cell ratio in the impression cytology samples from subjects without CLD (As) and with CLD (S) as determined by flow cytometry. A, CL-A users; D, CL-D users. CL-A As (20 eyes, n = 10), CL-A S (18 eyes, n = 9), CL-D As (22 eyes, n = 11), CL-D S (20 eyes, n = 10). The bar graph represents mean ± SEM. *P < 0.05, **P < 0.01, ****P < 0.0001 (Mann–Whitney test).
Figure 8.
Figure 8.
cDCD changes in CLD. The graph indicates the average cDCD (cells/mm2) in subjects without CLD (As) and with CLD (S). A, CL-A users; D, CL-D users. CL-A As (4 eyes, n = 2), CL-A S (8 eyes, n = 4), CL-D As (10 eyes, n = 5), CL-D S (4 eyes, n = 2). The bar graph represents mean ± SEM. *P < 0.05 (Mann–Whitney test).

References

    1. Dumbleton K, Caffery B, Dogru M, et al. .. The TFOS International Workshop on Contact Lens Discomfort: report of the subcommittee on epidemiology. Invest Ophthalmol Vis Sci. 2013; 54: TFOS20–TFOS36. - PubMed
    1. Dumbleton K, Woods CA, Jones LW, Fonn D.. The impact of contemporary contact lenses on contact lens discontinuation. Eye Contact Lens. 2013; 39: 93–99. - PubMed
    1. Pritchard N, Fonn D, Brazeau D.. Discontinuation of contact lens wear: a survey. Int Contact Lens Clin. 1999; 26: 157–162. - PubMed
    1. Young G, Veys J, Pritchard N, Coleman S.. A multi-centre study of lapsed contact lens wearers. Ophthalmic Physiol Opt. 2002; 22: 516–527. - PubMed
    1. Richdale K, Sinnott LT, Skadahl E, Nichols JJ.. Frequency of and factors associated with contact lens dissatisfaction and discontinuation. Cornea. 2007; 26: 168–174. - PubMed

Publication types