. 2022 Jul 8;8(27):eabm1883.
doi: 10.1126/sciadv.abm1883. Epub 2022 Jul 8.

On the semantic representation of risk

Affiliations

On the semantic representation of risk

Dirk U Wulff et al. Sci Adv. .

Abstract

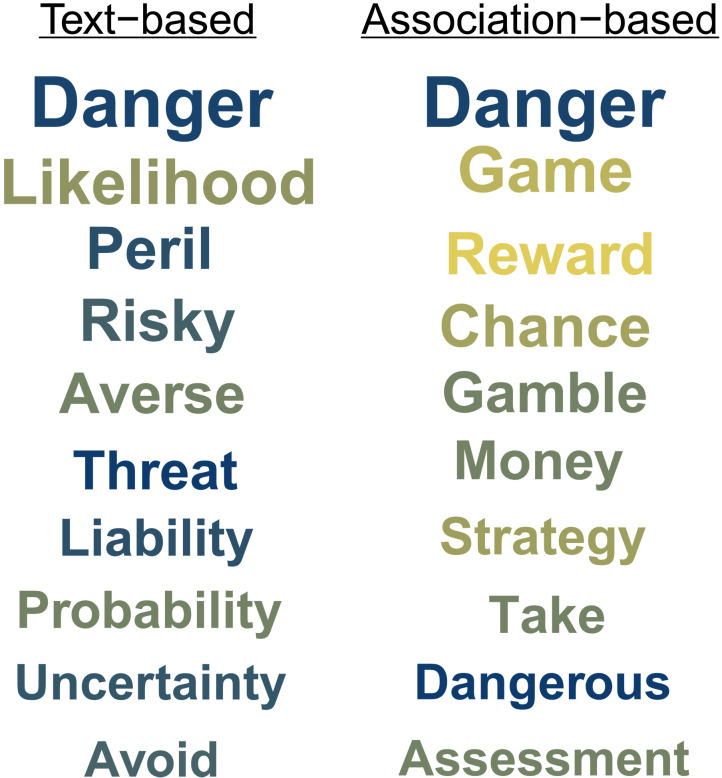
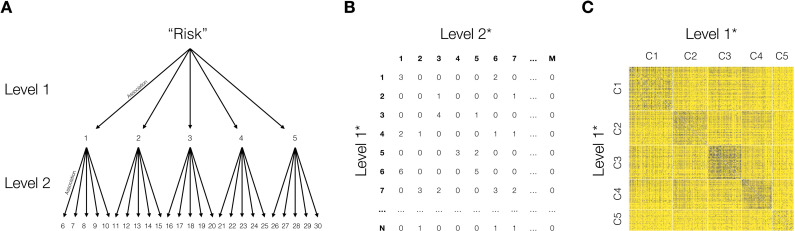
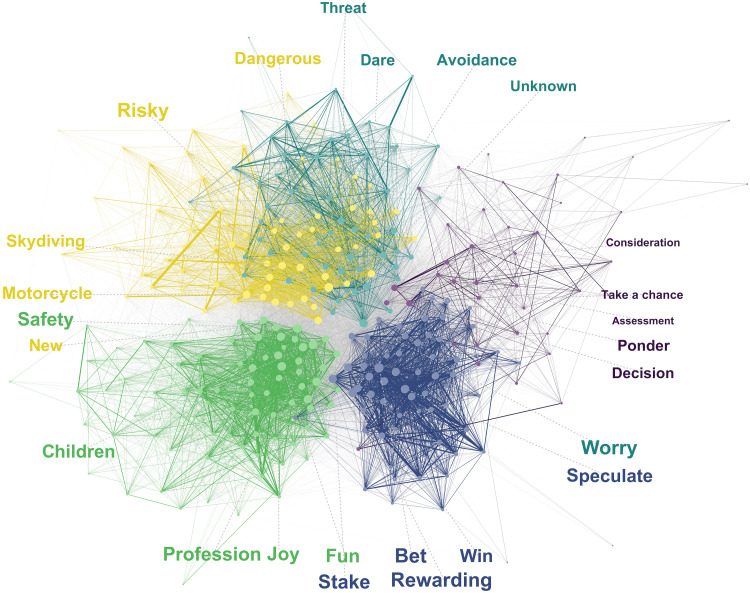
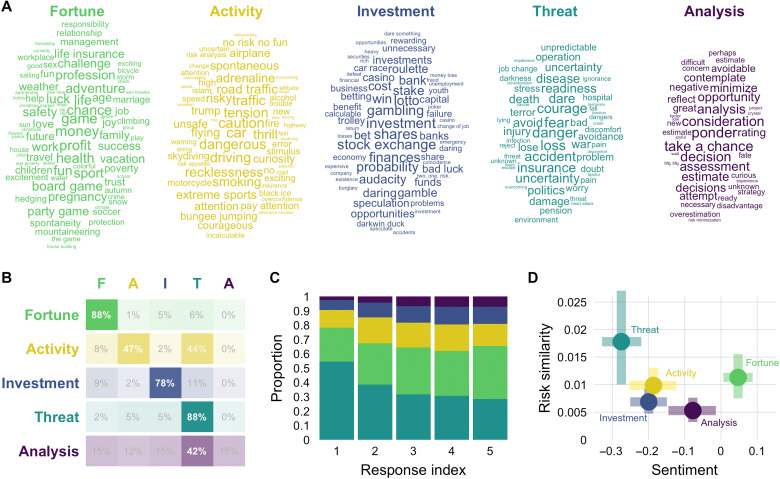
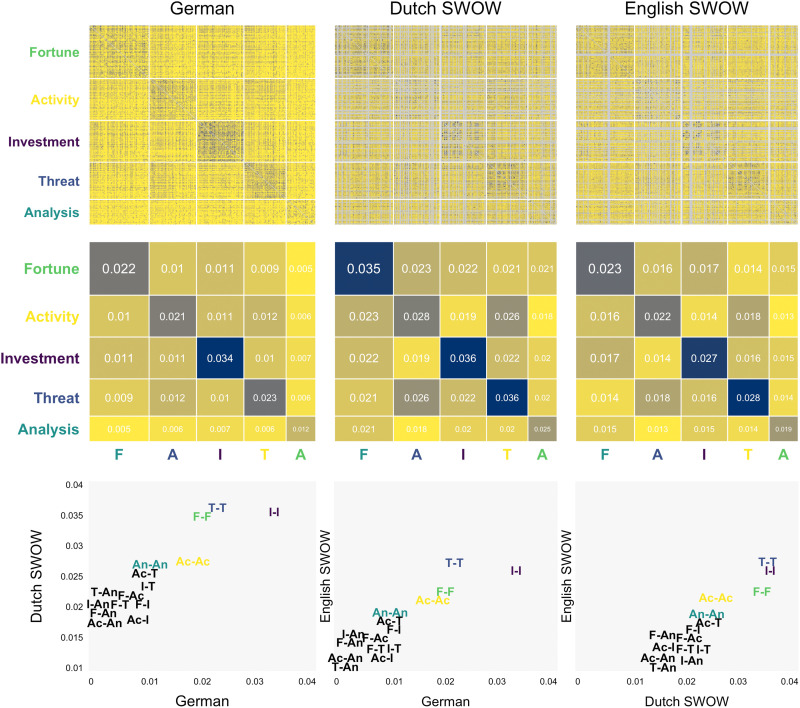
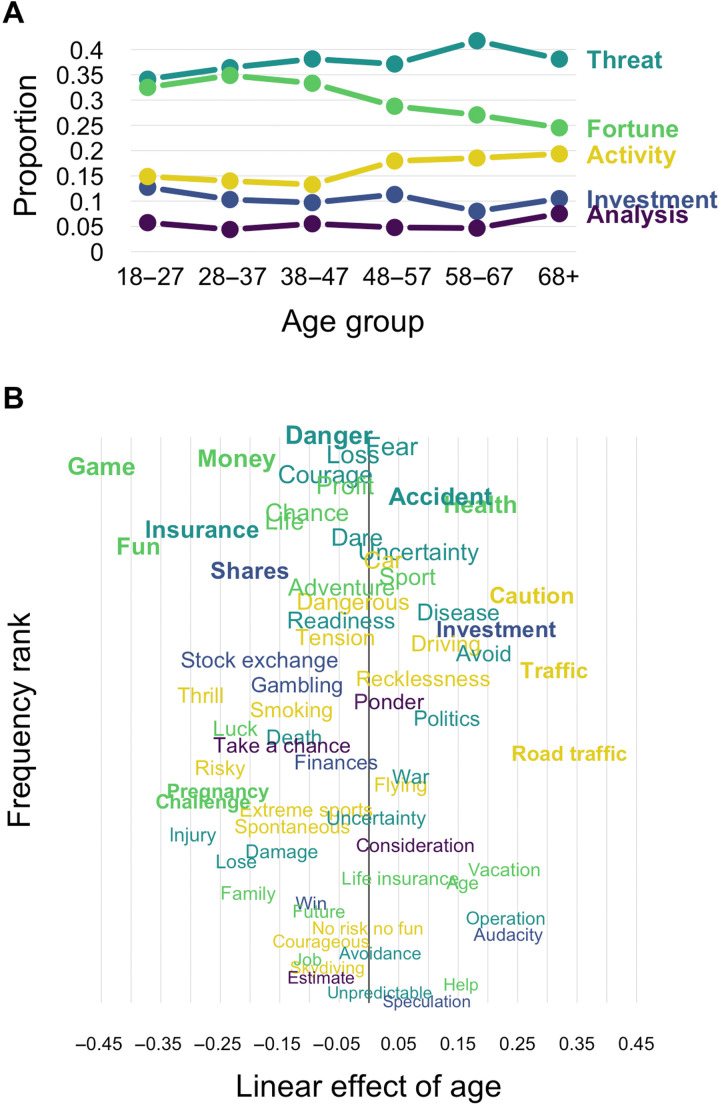
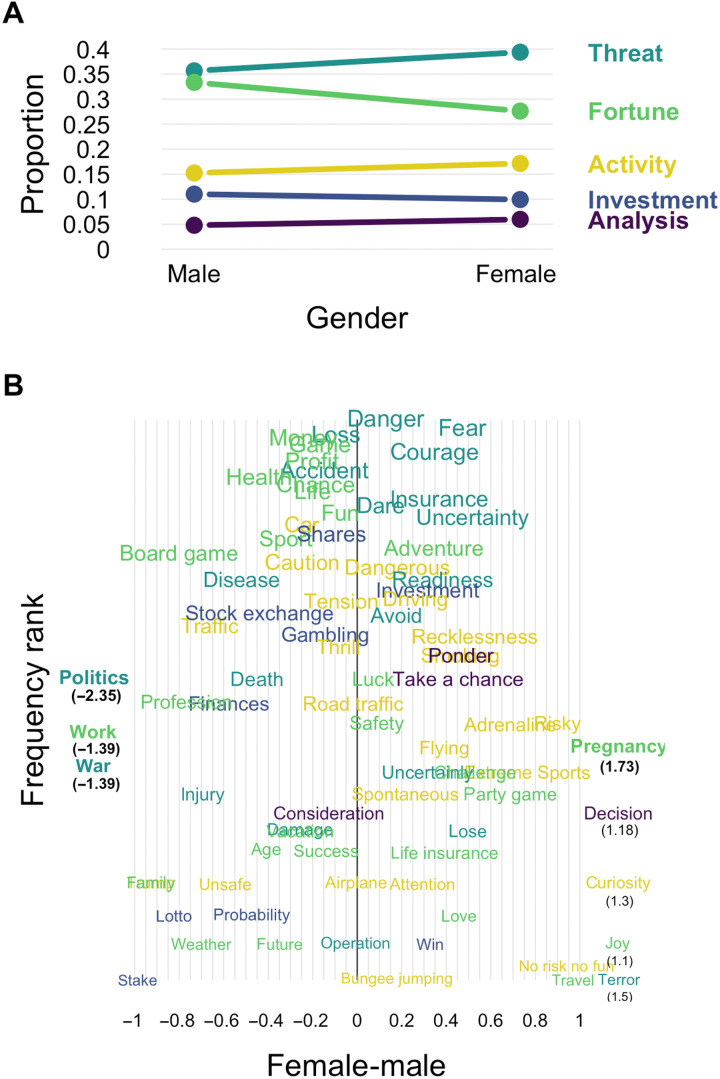
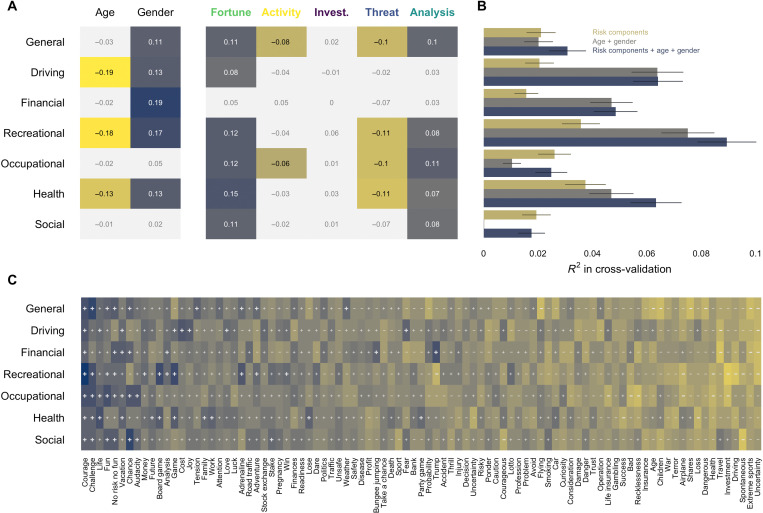
What are the defining features of lay people's semantic representation of risk? We contribute to mapping the semantics of risk based on word associations to provide insight into both universal and individual differences in the representation of risk. Specifically, we introduce a mini-snowball word association paradigm and use the tools of network and sentiment analysis to characterize the semantics of risk. We find that association-based representations not only corroborate but also extend those extracted from past survey- and text-based approaches. Crucially, we find that the semantics of risk show universal properties and individual and group differences. Most notably, while semantic clusters generalize across languages, their frequency varies systematically across demographic groups, with older and female respondents showing more negative connotations and mentioning more often certain types of activities (e.g., recreational activities) relative to younger adults and males, respectively. Our work has general implications for the measurement of risk-related constructs by suggesting that "risk" can mean different things to different individuals.


Figures

Fig. 1.
Fig. 1.. Comparison of text-based and free association–based approaches to the semantics of risk.
Left column shows the 10 words with the highest cosine similarity to the word “risk” based on the fastText pretrained Word2Vec representation from Mikolov et al. (23). Right column shows the 10 most frequent associations in the English Small World of Words (SWOW) free association database from De Deyne et al. (24). The words’ size reflects cosine and retrieval frequency, respectively. The words’ color reflects sentiment based on the SentiWordNet sentiment dictionary (57).
Fig. 2.
Fig. 2.. Construction of the semantic network of risk.
(A) Mini-snowball word association approach used to generate level 1 and level 2 associates of the word “risk” (numbers represent each of the 30 word associates provided by each respondent). (B) Level 1 by level 2 co-occurrence matrix, which served as the basis for determining the relatedness among the level 1 responses (numbers represent unique associates). (C) Relatedness matrix between level 1 associates, determined by calculating the Jaccard similarity between rows in the co-occurrence matrix shown in (B) and ordered according to a clustering algorithm (see main text for details; C, component). The asterisk (*) indicates that only the subset of level 1 associates are included that were produced at least three times across all participants.
Fig. 3.
Fig. 3.. The semantic network of risk.
Nodes represent the 307 distinct level 1 associates sized according to their importance for the network (PageRank). Edges represent the relatedness between nodes sized by the magnitude of the Jaccard index. Colors represent the five components identified by the Louvain algorithm (31). For each component, the five most important words are shown sized by importance. Gray lines in the background represent between-component edges. The layout of the nodes was determined using the Fruchterman-Reingold algorithm (58) including a minor edge weight bias for within-component edges to increase visual separation of the components.
Fig. 4.
Fig. 4.. The semantic components of risk.
(A) Word clouds of all words contained in the respective component, with the size reflecting the retrieval frequency rank of the word. (B) Cluster stability. (C) Retrieval proportions for each of the five components from the first up to the fifth associate of risk. (D) Average sentiment and proximity to risk for each of the five components. Error bars indicate bootstrapped 95% confidence intervals.
Fig. 5.
Fig. 5.. The semantic network of risk in other languages.
The top row shows the Jaccard similarities for all pairs of words in the semantic network of risk based on the current data and data from the Dutch and English SWOW projects. The latter two provide estimates for pairs involving 244 and 253 of the 307 terms in the network of risk. Missing terms in the Dutch and English SWOW are indicated by gray lines. The middle row shows the average similarities within and between risk components for all three languages. The bottom row illustrates the correlation between component similarities for pairs of languages.
Fig. 6.
Fig. 6.. The semantic representation of risk across age.
(A) Proportion of retrievals falling into each of the five components across the different age groups. (B) Word-level changes in retrieval frequencies of words in terms of the linear effect of age. Specifically, the panel shows the unstandardized effect of a predictor coding age group predicting the log-scaled relative retrieval frequencies. Words in bold showed a significant age difference in retrieval frequencies at the 0.05 level as determined by a log linear model.
Fig. 7.
Fig. 7.. The semantic representation of risk by gender.
(A) Proportion of retrievals falling into each of the five components across genders. (B) Word-level changes in retrieval frequencies of words in terms of the difference of genders. Specifically, the panel shows the difference between the log relative retrieval frequencies. Words in bold showed a significant gender difference in retrieval frequencies at the 0.05 level as determined by a chi-square test for stochastic independence.
Fig. 8.
Fig. 8.. Linking the semantic representation of risk to self-reported risk taking.
(A) Standardized coefficients for regressions predicting self-reported risk taking from a joint set of predictors including age, gender, and the similarity of people’s responses to each of the five risk components separately for each of the seven risk-taking propensity items. Cells shown in color are significant at α = 0.05. (B) Coefficient of determination (R2) in cross-validation achieved by models predicting self-reported risk-taking propensity either by the five risk components, by age and gender, or by all predictors combined. Errors bars reflect SEs according to the corrected resampled t test (59). (C) Correlation between retrieving or not retrieving a term at level 1 and the self-reported risk-taking items. Pluses and minuses reflect the direction of correlation. Bold font is used to signify correlations > ∣ 0.05∣.

References

    1. Starr C., Social benefit versus technological risk: What is our society willing to pay for safety? Science 165, 1232–1238 (1969). - PubMed
    1. Li Y., Hills T., Hertwig R., A brief history of risk. Cognition 203, 104344 (2020). - PMC - PubMed
    1. Aven T., The risk concept—Historical and recent development trends. Reliab. Eng. Syst.Saf. 99, 33–44 (2012).
    1. Boholm M., The semantic field of risk. Saf. Sci. 92, 205–216 (2017).
    1. Boudia S., Jas N., Introduction: Risk and ‘risk society’ in historical perspective. Hist. Technol. 23, 317–331 (2007).