. 2022 Jul 15;8(28):eabm1971.
doi: 10.1126/sciadv.abm1971. Epub 2022 Jul 15.

Mapping microstructural gradients of the human striatum in normal aging and Parkinson's disease

Affiliations

Mapping microstructural gradients of the human striatum in normal aging and Parkinson's disease

Elior Drori et al. Sci Adv. .

Abstract

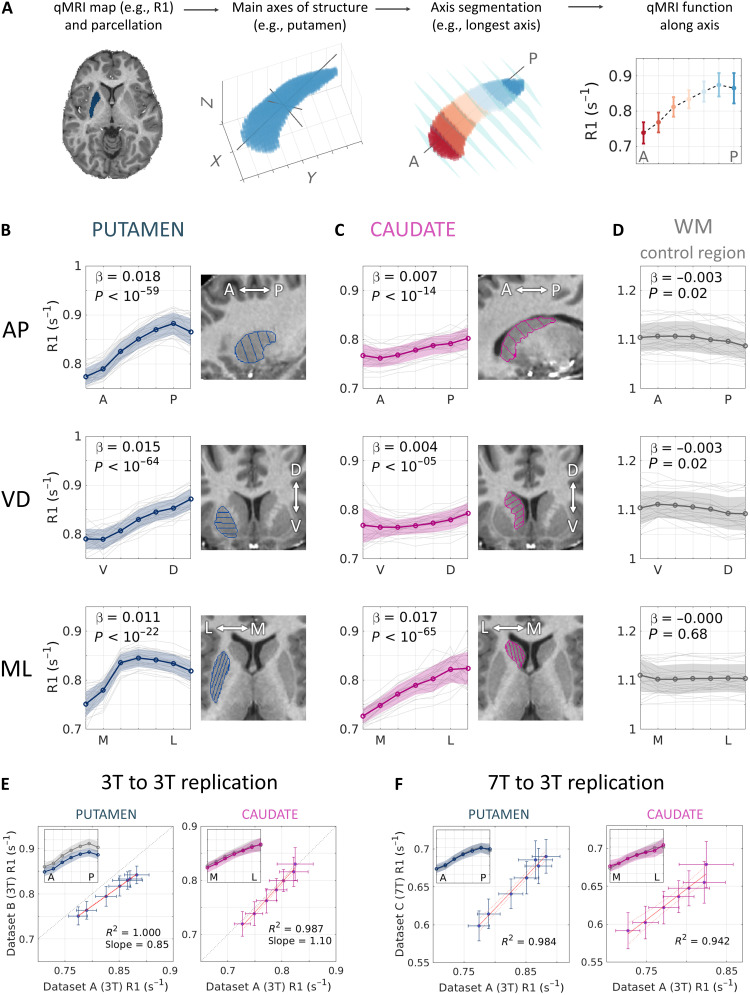
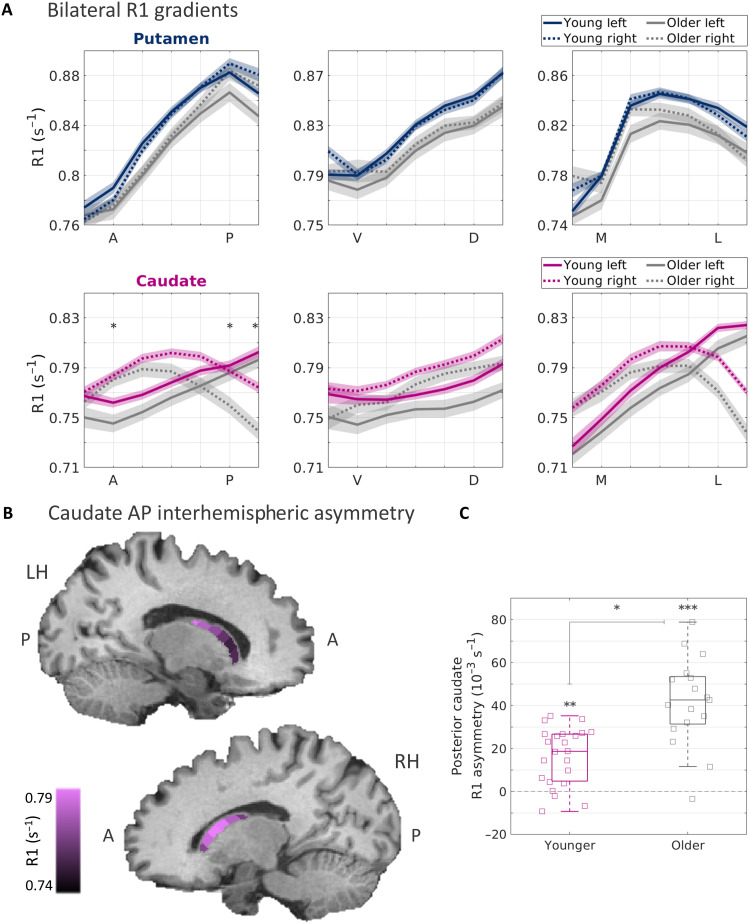
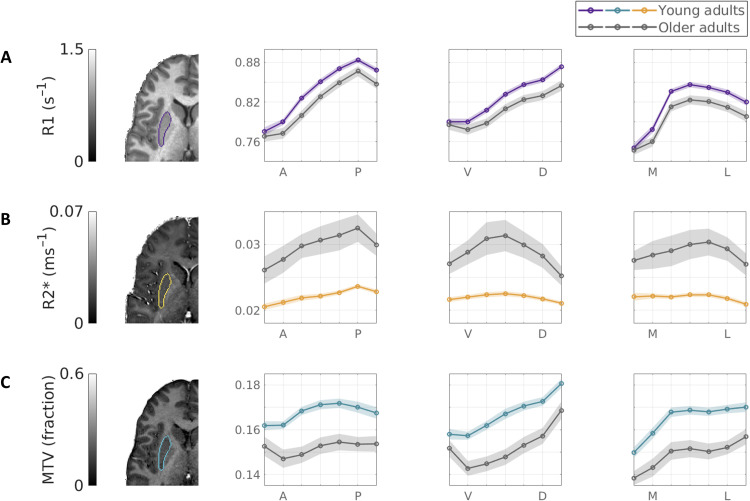
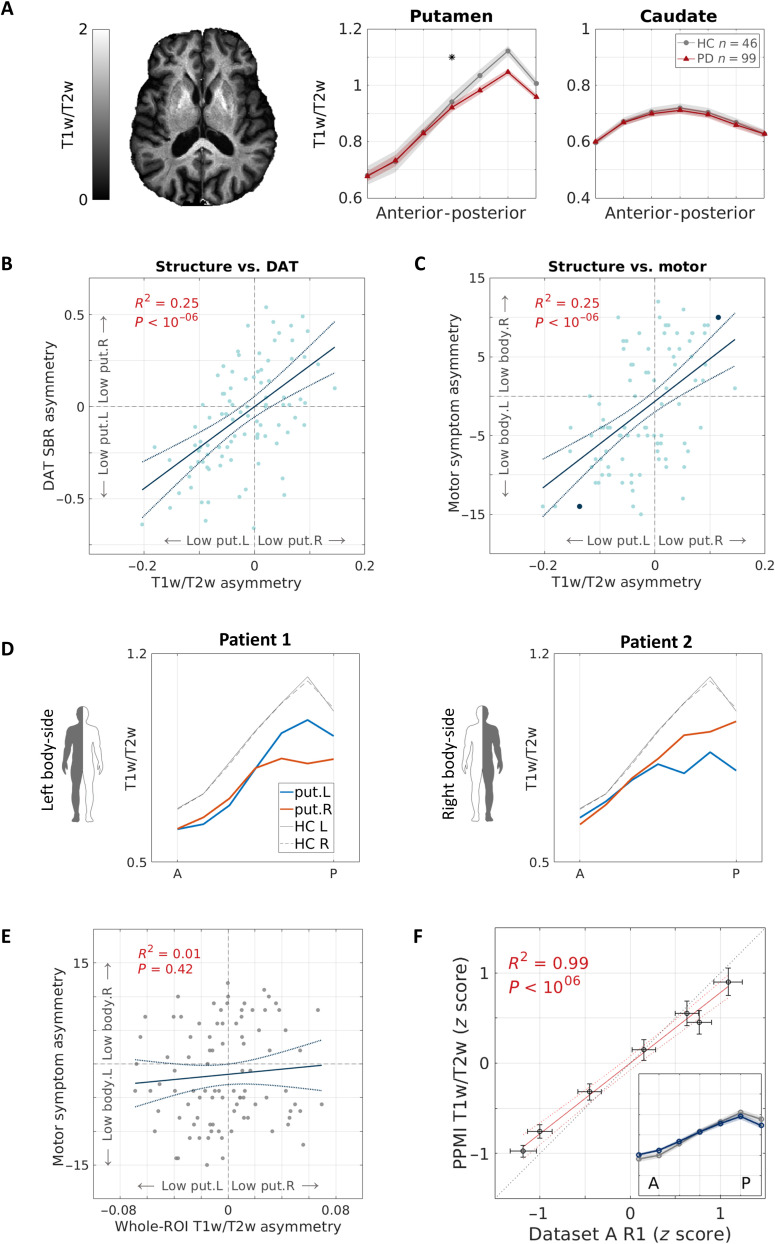
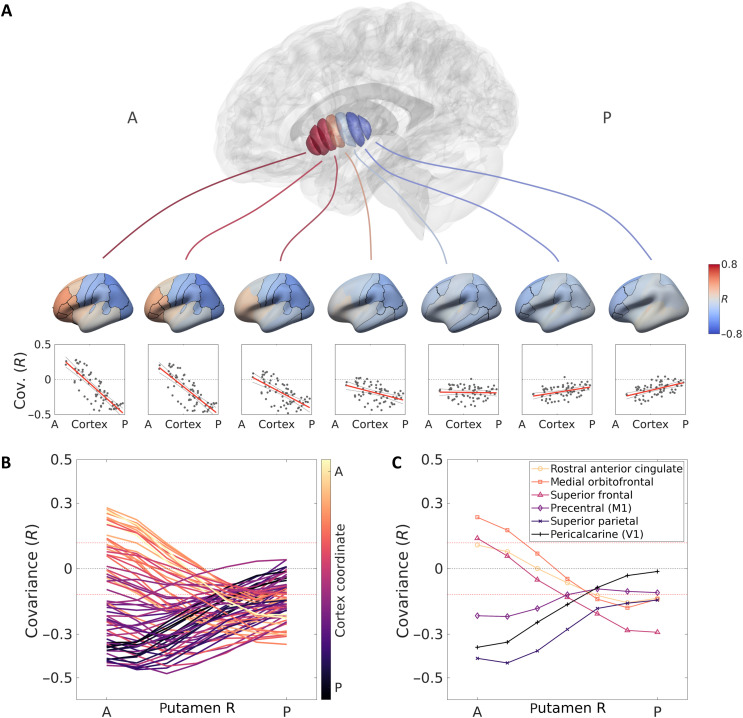
Mapping structural spatial change (i.e., gradients) in the striatum is essential for understanding the function of the basal ganglia in both health and disease. We developed a method to identify and quantify gradients of microstructure in the single human brain in vivo. We found spatial gradients in the putamen and caudate nucleus of the striatum that were robust across individuals, clinical conditions, and datasets. By exploiting multiparametric quantitative MRI, we found distinct, spatially dependent, aging-related alterations in water content and iron concentration. Furthermore, we found cortico-striatal microstructural covariation, showing relations between striatal structural gradients and cortical hierarchy. In Parkinson's disease (PD) patients, we found abnormal gradients in the putamen, revealing changes in the posterior putamen that explain patients' dopaminergic loss and motor dysfunction. Our work provides a noninvasive approach for studying the spatially varying, structure-function relationship in the striatum in vivo, in normal aging and PD.


Figures

Fig. 1.
Fig. 1.. Microstructural gradients in the striatum revealed in vivo.
(A) Automatic computation of the putamen’s AP axis in a single subject and calculation of a microstructural gradient along it. (B and C) R1 gradients along three axes of the left putamen (B) and caudate (C) in 23 young adults (dataset A). The typical spatial change between segments is represented by the fixed effect β, estimated using a mixed-effects model for each axis. The sign of β denotes a positive or negative gradient, i.e., an increase or decrease in R1 (s−1) along the axis. (In subsequent analyses, cases of a nonlinear change along the axis are approximated using two linear models. See Methods and table S1.) P values are FDR-corrected. (D) The R1 functions along axes of a control white matter (WM) region show almost no change, ruling out image bias as an explanation for the measured striatum gradients. (E and F) Replications in two independent datasets (datasets B and C) in 3T (E) and 7T (F). The agreement between datasets is shown in each panel using linear regression between the average R1 functions along the putamen AP axis and along the caudate ML axis. Insets: R1 spatial functions from dataset A (gray) and dataset B or C (color). Data in (F) are z-scored since different strength fields yield different R1 ranges. Shaded areas and error bars represent ±1 SD.
Fig. 2.
Fig. 2.. Striatal R1 gradients reveal aging-related changes.
(A) R1 functions along the main axes of the left and right putamen (blue) and caudate (pink), averaged across 23 younger adults and 17 older adults (gray) from dataset A. Shaded areas represent ±1 SEM. The interhemispheric asymmetry along the AP axis is increased in the older group, as reflected by a three-way interaction effect of age group, hemisphere, and position (P < 0.001; see table S1). Asterisks represent segments along the AP axis where the interhemispheric difference was significantly higher in the older group, as shown in (C). (B) Visualization of the mean R1 gradients along the AP axis of the left and right caudate of the older group, overlaid on a T1-weighted image of a sample older adult. (C) Interhemispheric asymmetry is quantified for the posterior segments of the caudate AP axis (averaged across the two most posterior segments). Asymmetry is expressed as the within-subject, left-minus-right difference in R1 values. In each boxplot, the midline and edges represent the median and the 25th to 75th percentiles, respectively. *P < 10−4, **P < 10−5, and **P < 10−6. All P values are FDR-corrected.
Fig. 3.
Fig. 3.. Multiparametric aging-related gradient change along the main striatal axes.
Spatial qMRI functions along the three main axes of the left putamen in younger adults (N = 17; color) and older adults (N = 16; gray) reveal distinct profiles of change in different biophysical sources. While the tissue longitudinal relaxation rate R1 (A) shows the most significant spatial effects, the iron content correlate R2* (B) shows significant nonlinear spatial change and substantial aging-related increases, and the MTV, or nonwater fraction (C), shows significant decreases in aging. Shaded area is ±1 SEM.
Fig. 4.
Fig. 4.. Putamen gradients reveal microstructure decreases in PD, associated with dopaminergic and motor deficits.
(A) T1w/T2w spatial functions are shown for older PD patients (N = 99) and matched healthy controls (N = 46) in the AP axes of the putamen and caudate (averaged across hemispheres). The gradient significantly differs between groups, showing a decrease in posterior subregions in PD (linear mixed-effects model, PFDR < 0.05). The image shows a representative T1w/T2w axial slice of a PD patient, generated using the PPMI data. (B and C) Microstructural asymmetry in the posterior putamen of PD patients is positively correlated with (B) ipsilateral asymmetry in dopamine transporter binding ratio in the putamen, quantified by DaTSCAN SPECT, and (C) contralateral body-side motor signs. Solid and dashed lines represent the linear fit and 95% confidence interval, respectively. Highlighted in blue are two subjects shown in (D). (D) Individual putamen AP gradients of two PD patients who exhibit motor sign dominance in the left body side (patient 1) and the right body side (patient 2). Both patients show an asymmetric decrease in the posterior putamen that is associated contralaterally to the body side more affected by motor signs. (E) In contrast with our spatial approach, whole-putamen T1w/T2w L-R asymmetry did not show a meaningful correlation with motor asymmetry. R2 = 0.01, P = 0.42. (F) Semiquantitative T1w/T2w and quantitative R1 gradients along the AP axis of the putamen show high similarity. Data points represent the seven segments along the putamen’s AP axis. We plotted the z-scored, quantitative data of older healthy adults (dataset A, x axis) against the z-scored, semiquantitative data of healthy controls (PPMI data, y axis). Inset: z-scored T1w/T2w gradient (color) and z-scored R1 gradient (gray). Shaded area = ±1 SEM. put, putamen; HC, healthy controls; L, left; R, right.
Fig. 5.
Fig. 5.. Microstructural gradient of cortico-striatal covariation shows fronto-limbic to sensorimotor separation.
(A) Segments along the putamen’s AP axis show distinct profiles of microstructural covariation with cortical regions. Anterior segments of the putamen display differentiative profiles, showing positive covariance with frontal cortical regions and negative covariance with parieto-occipital regions. This differentiation attenuates toward posterior segments of the putamen that show only negative covariance (results are shown for the right putamen). (Similar results are obtained for the left putamen and for the caudate; see fig. S20.) (B) Each of 68 cortical regions (defined by the Desikan-Killiany atlas) is colored with respect to its location on the brain’s AP axis (y coordinate of the region’s centroid). Profiles of covariation with putamen segments are different for frontal (yellow) and posterior (purple) cortical regions. Red dashed lines indicate bounds of significant covariance (corrected for multiple comparisons). (C) Isolation of example cortical profiles from (B), showing positive covariation of frontal and limbic regions and negative covariation of motor and sensory regions with the anterior putamen, and a gradual change of this trend toward the posterior putamen.

Similar articles

Cited by

References

    1. Redgrave P., Rodriguez M., Smith Y., Rodriguez-Oroz M. C., Lehericy S., Bergman H., Agid Y., DeLong M. R., Obeso J. A., Goal-directed and habitual control in the basal ganglia: Implications for Parkinson’s disease. Nat. Rev. Neurosci. 11, 760–772 (2010). - PMC - PubMed
    1. Cass W. A., Grondin R., Andersen A. H., Zhang Z., Hardy P. A., Hussey-Andersen L. K., Rayens W. S., Gerhardt G. A., Gash D. M., Iron accumulation in the striatum predicts aging-related decline in motor function in rhesus monkeys. Neurobiol. Aging 28, 258–271 (2007). - PubMed
    1. Crittenden J. R., Graybiel A. M., Basal ganglia disorders associated with imbalances in the striatal striosome and matrix compartments. Front. Neuroanat. 5, 59 (2011). - PMC - PubMed
    1. Graybiel A. M., Ragsdale C. W., Histochemically distinct compartments in the striatum of human, monkeys, and cat demonstrated by acetylthiocholinesterase staining. Proc. Natl. Acad. Sci. U.S.A. 75, 5723–5726 (1978). - PMC - PubMed
    1. Prensa L., Giménez-Amaya J. M., Parent A., Chemical heterogeneity of the striosomal compartment in the human striatum. J. Comp. Neurol. 413, 603–618 (1999). - PubMed