. 2022 Jul 15;8(28):eabm3596.
doi: 10.1126/sciadv.abm3596. Epub 2022 Jul 13.

Tracking the immune response by MRI using biodegradable and ultrasensitive microprobes

Affiliations

Tracking the immune response by MRI using biodegradable and ultrasensitive microprobes

Sara Martinez de Lizarrondo et al. Sci Adv. .

Abstract

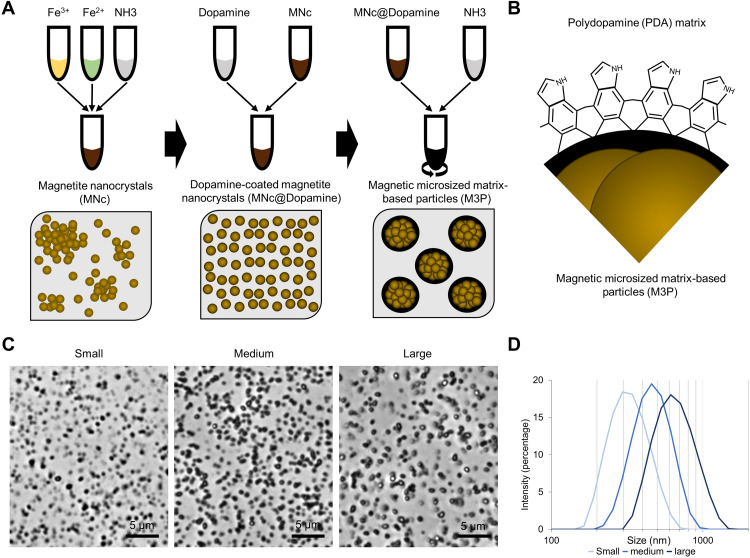
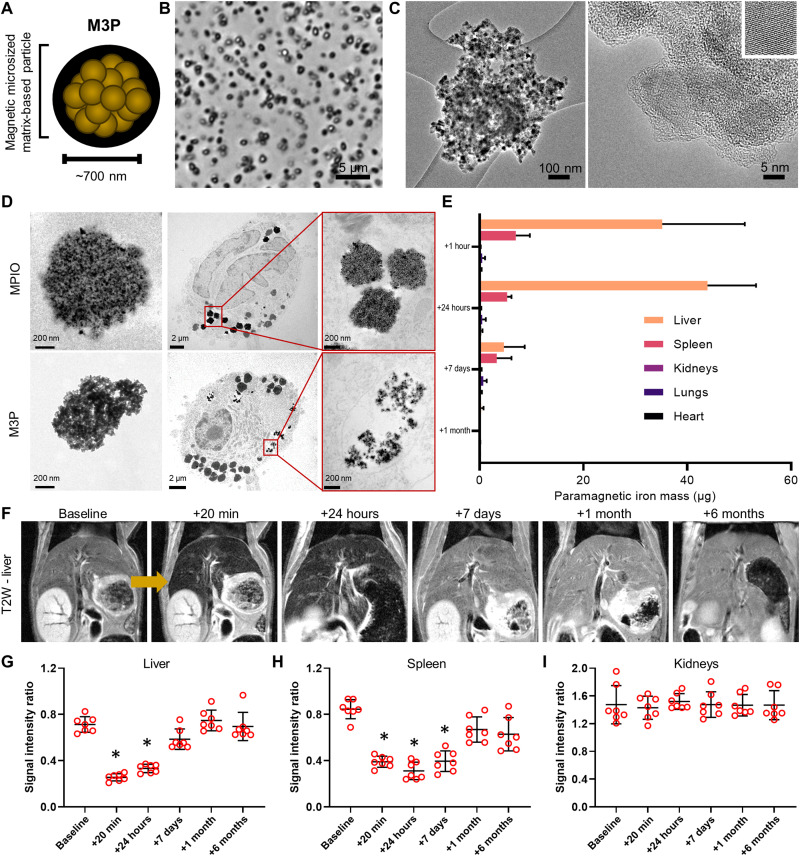
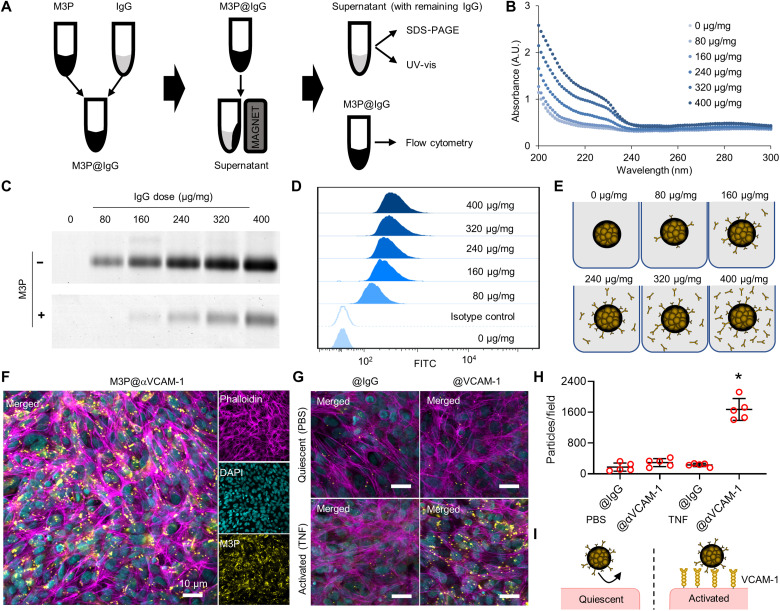
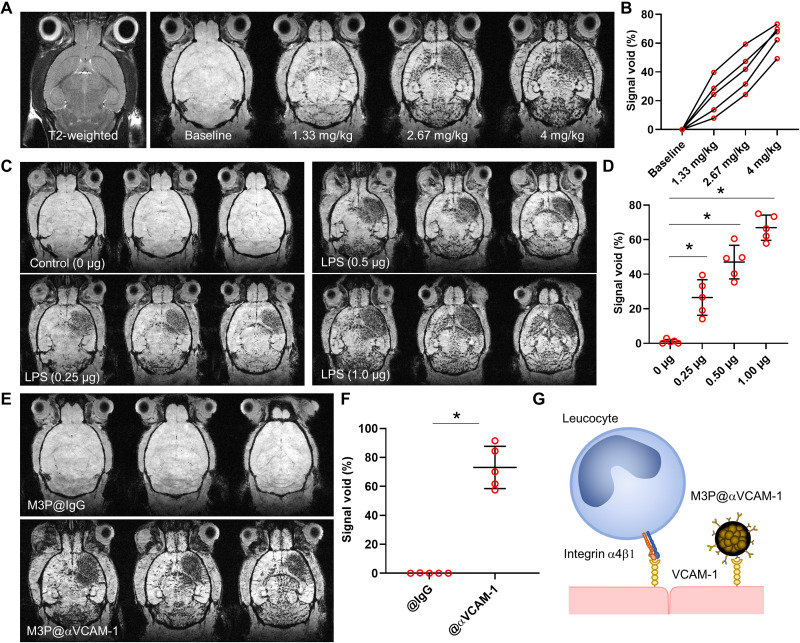
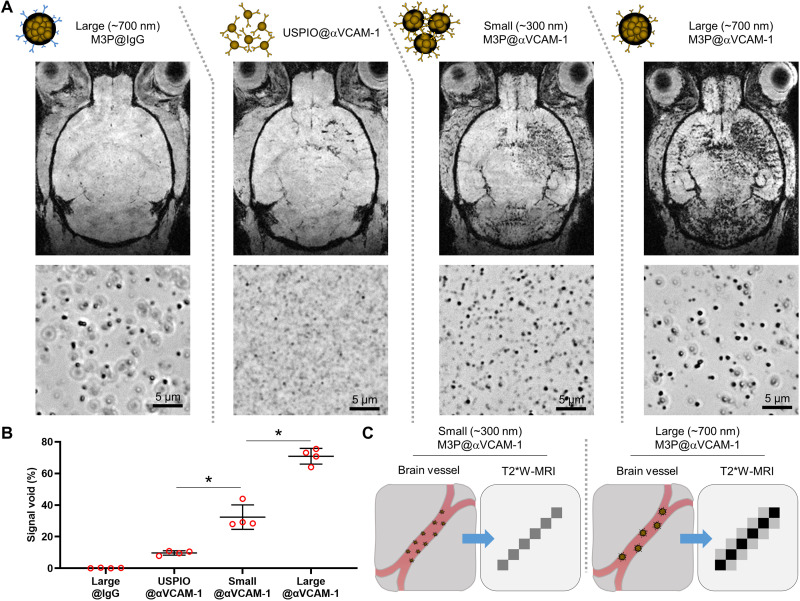
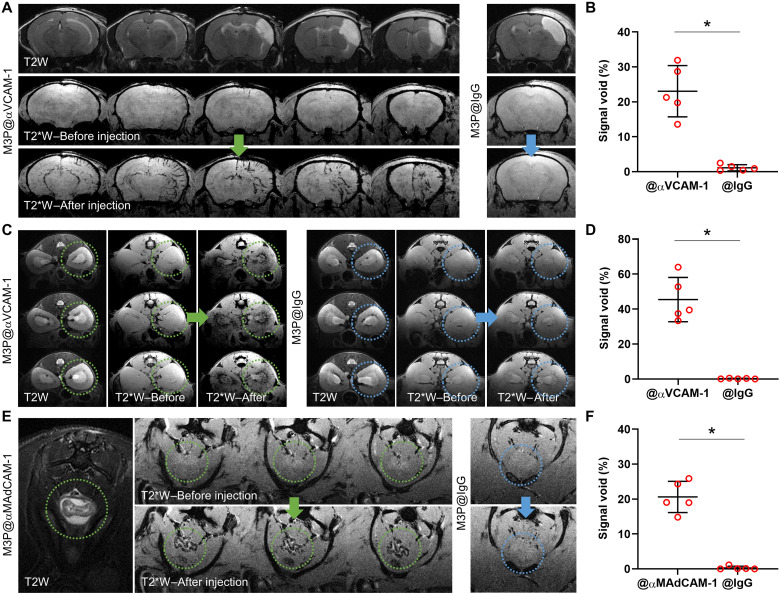
Molecular magnetic resonance imaging (MRI) holds great promise for diagnosis and therapeutic monitoring in a wide range of diseases. However, the low intrinsic sensitivity of MRI to detect exogenous contrast agents and the lack of biodegradable microprobes have prevented its clinical development. Here, we synthetized a contrast agent for molecular MRI based on a previously unknown mechanism of self-assembly of catechol-coated magnetite nanocrystals into microsized matrix-based particles. The resulting biodegradable microprobes (M3P for microsized matrix-based magnetic particles) carry up to 40,000 times higher amounts of superparamagnetic material than classically used nanoparticles while preserving favorable biocompatibility and excellent water dispersibility. After conjugation to monoclonal antibodies, targeted M3P display high sensitivity and specificity to detect inflammation in vivo in the brain, kidneys, and intestinal mucosa. The high payload of superparamagnetic material, excellent toxicity profile, short circulation half-life, and widespread reactivity of the M3P particles provides a promising platform for clinical translation of immuno-MRI.


Figures

Fig. 1.
Fig. 1.. Synthesis of M3P.
(A) Schematic representation of the main step of M3P synthesis. First, MNc were produced by coprecipitation of ferric (Fe3+) and ferrous chloride (Fe2+) in the presence of ammonia (NH3). Second, MNc were stabilized by a coating with dopamine (MNc@Dopamine). Third, PDA matrix was initiated by the addition of different doses of ammonia under mechanical stirring, leading to the formation of M3P. (B) Schematic representation of the surface and inner structure of M3P. (C) Representative phase microscopy images of production of M3P of different sizes obtained by using different concentrations of ammonia during synthesis. (D) Size distribution of M3P as assessed by dynamic light scattering (representative of three independent experiments in three independent batches).
Fig. 2.
Fig. 2.. Large M3P are degraded in vitro and in vivo.
(A) Schematic representation of large M3P. (B) Representative phase microscopy image of one batch of large M3P. (C) Representative high-resolution transmission electron microscopy (TEM) of a large M3P. The small insert on the upper right depicts the crystalline structure of one clustered MNc. (D) Representative TEM images of commercial MPIO (top) and M3P (down) before (left) and 96 hours (middle and right) after incubation with macrophages. (E) Mass of paramagnetic iron in the liver, spleen, kidneys, lungs, and heart at different time points after intravenous injection of large M3P (4 mg/kg), as assessed by electronic paramagnetic resonance. (F) Representative longitudinal T2-weighted images of the liver at baseline and at different time points after intravenous injection of large M3P (4 mg/kg). (G) Evolution of the signal intensity on T2-weighted imaging in the liver (n = 7 per group). Ratio was calculated by taking the signal of the paravertebral muscles as reference. (H) Evolution of the signal intensity on T2-weighted imaging in the spleen (n = 7 per group). (I) Evolution of the signal intensity on T2-weighted imaging in the right kidney (n = 7 per group). *P < 0.05 versus baseline.
Fig. 3.
Fig. 3.. Complexation of immunoglobulins to M3P.
(A) Schematic representation of the methods for complexation and characterization of M3P. (B) UV-vis spectroscopy of the supernatant of M3P@IgG after complexation to different doses of IgG (from 80 to 400 μg/mg). A.U., arbitrary units. (C) SDS-PAGE of the supernatant of M3P@IgG after complexation to different doses of IgG. (D) Flow cytometry of M3P@IgG after complexation to different doses of IgG (rat) using anti-rat or control (anti-goat) secondary antibodies. (E) Schematic representation of M3P@IgG and its supernatant according to the dose of IgG used during complexation. (F) Representative immunofluorescence images of anti-human M3P@αVCAM-1 after incubation with activated human cerebral endothelial cells (hCMECD/3). (G) Representative immunofluorescence images of anti-human M3P@αVCAM-1 or control M3P@IgG after incubation with quiescent (treated with PBS) or activated (treated with TNF) hCMECD/3. (H) Corresponding quantification of the number of particles per field (n = 5 per group). *P < 0.05 versus all other groups. (I) Schematic representation of the main findings revealing selective binding of M3P@αVCAM-1 on activated human endothelial cells. DAPI, 4′,6-diamidino-2-phenylindole.
Fig. 4.
Fig. 4.. Ultrasensitive molecular imaging of VCAM-1 in the inflamed brain.
(A) Representative T2-weighted image and T2*-weighted images at baseline and 10 min after successive intravenous injection of M3P targeted against VCAM-1 using monoclonal antibodies (M3P@αVCAM-1) up to 4 mg/kg (equivalent iron) 24 hours after injection of 1 μg of LPS in the right striatum. (B) Corresponding quantification of M3P@αVCAM-1 induced signal void in the right striatum (n = 5). (C) Representative T2*-weighted images (three slices per animal) after intravenous injection of M3P@αVCAM-1 (4 mg/kg) 24 hours after injection of different doses of LPS in the right striatum (from 0 to 1.0 μg). (D) Corresponding quantification of M3P@αVCAM-1 induced signal void in the right striatum (n = 5 per group). (E) Representative T2*-weighted images (three slices per animal) after intravenous injection of M3P@IgG or M3P@αVCAM-1 (4 mg/kg) 24 hours after injection of 1 μg of LPS in the right striatum. (F) Corresponding quantification of signal void in the right striatum (n = 5 per group). (G) Schematic representation of the findings that M3P@αVCAM-1 binds VCAM-1 on the surface of endothelial cells, thereby mimicking activated leucocytes. *P < 0.05.
Fig. 5.
Fig. 5.. Clustering M3P into submicrometric particles improves sensitivity of molecular MRI of VCAM-1.
(A) Top: Schematic representation of the particles. Middle: Representative T2*-weighted images after intravenous injection of the corresponding particles (4 mg/kg) 24 hours after injection of 1 μg of LPS in the right striatum. Bottom: Representative phase microscopy images of the particles after conjugation to control IgG or anti–VCAM-1 antibodies. (B) Corresponding quantification (n = 4 per group). (C) Schematic representation of the findings that large M3P (700 nm) provides better sensitivity than small M3P (300 nm). *P < 0.05.
Fig. 6.
Fig. 6.. Molecular imaging of endothelial activation in clinically relevant experimental models.
(A) Representative T2-weighted and T2*-weighted images before and after intravenous injection of M3P@αVCAM-1 (left) or M3P@IgG (right) (4 mg/kg) 24 hours after ischemic stroke induction by electrocoagulation of the right middle cerebral artery. (B) Corresponding quantification of signal void in the right hemisphere (n = 5 per group). (C) Representative T2-weighted and T2*-weighted images before and after intravenous injection of M3P@αVCAM-1 (left) or M3P@IgG (right) (4 mg/kg) 48 hours after acute kidney injury (rhabdomyolysis) induced by intramuscular injection of 50% glycerol. Yellow and blue dotted circles indicate the localization of the right kidney. (D) Corresponding quantification of signal void in the kidney medulla (n = 5 per group). (E) Representative T2-weighted and T2*-weighted images before and after intravenous injection of M3P@αMAdCAM-1 (left) or M3P@IgG (right) (4 mg/kg) in an acute colitis model induced by 5-day treatment with 2.0% of dextran sodium sulfate in the drinking water. Yellow and blue dotted circles indicate the localization of the descending colon. (F) Corresponding quantification of signal void in the descending colon (n = 5 per group). *P < 0.05.

References

    1. Lohrke J., Frenzel T., Endrikat J., Alves F. C., Grist T. M., Law M., Lee J. M., Leiner T., Li K.-C., Nikolaou K., Prince M. R., Schild H. H., Weinreb J. C., Yoshikawa K., Pietsch H., 25 years of contrast-enhanced MRI: Developments, current challenges and future perspectives. Adv. Ther. 33, 1–28 (2016). - PMC - PubMed
    1. Caravan P., Strategies for increasing the sensitivity of gadolinium based MRI contrast agents. Chem. Soc. Rev. 35, 512–523 (2006). - PubMed
    1. James M. L., Gambhir S. S., A molecular imaging primer: Modalities, imaging agents, and applications. Physiol. Rev. 92, 897–965 (2012). - PubMed
    1. Rich L. J., Bagga P., Wilson N. E., Schnall M. D., Detre J. A., Haris M., Reddy R., 1H magnetic resonance spectroscopy of 2H-to-1H exchange quantifies the dynamics of cellular metabolism in vivo. Nat. Biomed. Eng. 4, 335–342 (2020). - PMC - PubMed
    1. Laurent S., Forge D., Port M., Roch A., Robic C., Vander Elst L., Muller R. N., Magnetic iron oxide nanoparticles: Synthesis, stabilization, vectorization, physicochemical characterizations, and biological applications. Chem. Rev. 108, 2064–2110 (2008). - PubMed