. 2022 Jul 15;8(28):eabo3583.
doi: 10.1126/sciadv.abo3583. Epub 2022 Jul 15.

Pluripotency factors regulate the onset of Hox cluster activation in the early embryo

Affiliations

Pluripotency factors regulate the onset of Hox cluster activation in the early embryo

María Tiana et al. Sci Adv. .

Abstract

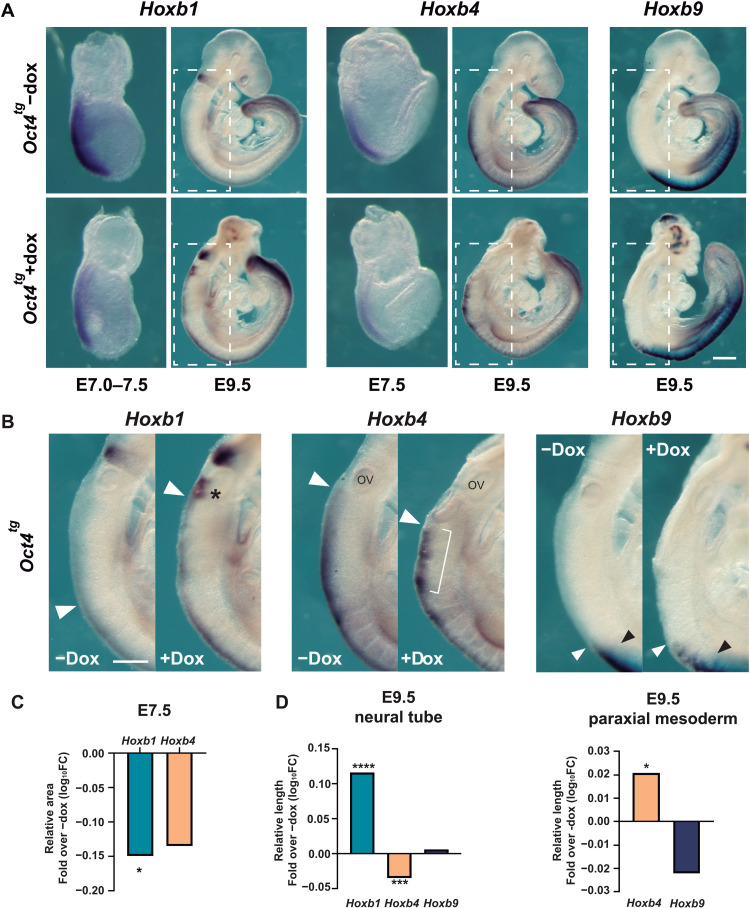
Pluripotent cells are a transient population of the mammalian embryo dependent on transcription factors, such as OCT4 and NANOG, which maintain pluripotency while suppressing lineage specification. However, these factors are also expressed during early phases of differentiation, and their role in the transition from pluripotency to lineage specification is largely unknown. We found that pluripotency factors play a dual role in regulating key lineage specifiers, initially repressing their expression and later being required for their proper activation. We show that Oct4 is necessary for activation of HoxB genes during differentiation of embryonic stem cells and in the embryo. In addition, we show that the HoxB cluster is coordinately regulated by OCT4 binding sites located at the 3' end of the cluster. Our results show that core pluripotency factors are not limited to maintaining the precommitted epiblast but are also necessary for the proper deployment of subsequent developmental programs.


Figures

Fig. 1.
Fig. 1.. Oct4 and Nanog coordinate developmental programs in the postgastrulation mouse embryo.
(A) Diagram showing the windows of dox treatment used to induce Oct4 or Nanog expression at postimplantation stages of mouse development. (B) Gene expression changes driven by expression of Oct4 or Nanog for 3 days up to E7.5 or E9.5; unsupervised hierarchical clustering of genes differentially expressed in at least one condition segregated genes into 10 groups according to behavior (clusters #1 to #10). (C) Enrichment in genes located in the vicinity of chromatin immunoprecipitation sequencing (ChIP-seq)–defined OCT4 or NANOG binding peaks, shown as the log10 ratio of each cluster versus genes differentially expressed in at least one of the conditions analyzed. Two-tailed Student’s t test; adj *P < 0.01. (D) Representative examples of developmental genes showing opposite behaviors in response to Oct4 and Nanog; genes are either early epiblast markers that are up-regulated early and down-regulated late (clusters #6 and #10; right) or later lineage specifiers that are down-regulated early and up-regulated late (cluster #8; left). Expression differences between dox-treated and untreated embryos are shown as logFC (fold change) of counts per million from RNA sequencing (RNA-seq) data.
Fig. 2.
Fig. 2.. Pluripotency factors mediate a global switch from Hox gene repression to activation.
(A) Schematic representation of the four mouse Hox clusters, indicating gene expression changes induced by Oct4 or Nanog at E7.5 or E9.5, as identified in the RNA-seq analysis. Yellow, down-regulated; blue, up-regulated; gray, unchanged. (B) Diagram depicting the nested windows of 1.5-day dox treatment for Oct4 induction between E5.5 and E9.5. (C) Changes in the expression of selected Hox genes (Hoxa1, Hoxb1, Hoxb4, and Hoxb9) induced by Oct4 during development, shown as log ratios of reverse transcription quantitative polymerase chain reaction (RT-qPCR)–measured relative RNA levels in untreated and dox-treated embryos as in B; *P < 0.05 by two-tailed Student’s t test.
Fig. 3.
Fig. 3.. Coordinated response of HoxB cluster to Oct4 overexpression.
(A) In situ hybridization analysis of HoxB cluster gene expression in E7.5 and E9.5 untreated (control, top row) and dox-treated (bottom row) Oct4tg embryos. n (E7.5, −/+ dox) = 8/12 (Hoxb1), 4 per condition (Hoxb4); n (E9.5) = 3 per condition. Scale bars, 140 μm (E7.0 to 7.5), 170 μm (E7.5), and 380 μm (E9.5). (B) Close-up views of E9.5 embryos shown in (A). The expression of Hoxb1 is expanded anteriorly (white arrowhead) in dox-treated Oct4tg embryos, and higher levels of expression are observed in presumptive rhombomere 6 (asterisk). Neural expression of Hoxb4 shows a patchy and disorganized pattern upon dox treatment (bracket) and is retarded more posterior (white arrowhead). Expression in the somites is shifted to the anterior part of the region. Neural expression of Hoxb9 is shifted anteriorly (white arrowhead) in relation to its limit of expression in the paraxial mesoderm (black arrowhead). n = 3. Scale bar, 250 μm. (C) Quantification of the positive area of in situ experiments in E7.5 embryos shown in (A), normalized by the total area of the embryo. Results are shown as log10; *P < 0.05 by two-tailed Student’s t test. (D) Quantification of the length of the positive area of in situ experiments in the neural tube (left) and paraxial mesoderm (right) of E9.5 embryos shown in (A), normalized by the total length of the embryo measured from the otic vesicle to the end of the tail. Results are shown as log10; analysis was performed by unpaired two-tailed Student’s t test. *P < 0.05; ***P < 0.001; ****P < 0.0001.
Fig. 4.
Fig. 4.. Oct4 is required for correct HoxB expression.
(A) Diagram depicting the experimental procedure followed with the loss-of-function model. (B) Changes in the expression of selected HoxB genes (Hoxb1, Hoxb4, and Hoxb9) induced by Oct4 deletion at E6.5 and analyzed at E7.5, E8.5, and E9.5. Results are shown as log ratios of RT-qPCR relative to untreated embryos. Analysis was performed by unpaired two-tailed Student’s t test. *P < 0.05; **P < 0.01; ***P < 0.001; ****P < 0.0001. n (−/+ tam) = 6/16 (E7.5), 8/14 (E8.5), 7/9 (E9.5 mild), and 10/7 (E9.5 severe). (C) In situ hybridization analysis of HoxB cluster gene expression at E9.5. Images show Oct4fl/fl-untreated embryos (top row) and 4-OH–treated embryos with mild (middle row) and severe phenotype (bottom row). n (−/+ tam) = 5/6 (Hoxb1), 4/8 (Hoxb4), and 7/7 (Hoxb9). Scale bar, 380 μm. (D) Changes in the expression of Hoxb1, Hoxb4, and Hoxb9 in ZHBTc4 ES cells with different levels of Oct4 up to 6 days of differentiation to mesoderm or anterior neural (hindbrain) lineages. mRNA levels were measured by RT-qPCR in ZHBTc4 ES cells treated with tetracycline from day 3 to day 6 (Oct4 WT), from day 0 to day 6 (cells that do not express Oct4 along differentiation; Oct4 LoF), and untreated ZHBTc4 (cells that express constitutively Oct4 along differentiation; Oct4 GoF). Statistical significance was calculated by two-way analysis of variance (ANOVA) followed by Tukey’s test (n = 3). *P < 0.05; **P < 0.01; ***P < 0.001; ****P < 0.0001.
Fig. 5.
Fig. 5.. Pluripotency factor binding sites establish long-distance contacts in the HoxB cluster.
(A) ChIP-seq binding profiles for OCT4 and NANOG (27) along the HoxB cluster (mm9; chr11:96,029,042-96,307,981; reversed). Distribution of histone marks for active transcription (H3K4m3), repression (H3K27m3), and active regulatory elements (H3K4m1 and H3K27ac) in Bruce4 ES cells (60) is shown below. Red arrowheads indicate two strong binding sites neighboring Hoxb1 at the anterior end of the cluster. (B) ChIP-qPCR of OCT4 binding to the P-site and D-site in ES cells (left, n = 4) and in untreated (−dox) and treated (+dox) E9.5 Oct4tg embryos (right, n = 3). Enrichment is shown as percentage of input for immunoglobulin G (IgG) (negative control) and anti-OCT4 antibody. Horizontal bars indicate means. *P < 0.05 by two-tailed Student’s t test. (C) Chromatin interaction profile established from viewpoints located at the P-site and D-site in a 1-Mb window surrounding the HoxB cluster (mm9; chr11:95,725,993-96,725,993) in ES cells, and untreated (−dox) and treated (+dox) E9.5 Oct4tg embryos. Distribution of normalized reads in two replicates is shown, with significant interactions below. Asterisks indicate novel intracluster interactions established in dox-treated embryos, and boxed regions (dashed line) indicate the interactions established toward the Hoxb13 region.
Fig. 6.
Fig. 6.. OCT4 D-site is required for correct expression of HoxB genes during differentiation.
(A) Changes in the expression of Hoxb1, Hoxb4, and Hoxb9 as a consequence of the deletion of the distal OCT4 binding site up to 6 days of differentiation (d3 to d6) of ES cells to mesoderm or anterior neural (hindbrain) lineages. RNA expression was measured by RT-qPCR and normalized to Actb in two independent deleted homozygous clones (#30, dark yellow; #57, light yellow). Statistical significance was calculated by two-way ANOVA followed by Dunnett’s test (n = 3). *P < 0.05; **P < 0.01; ***P < 0.001; ****P < 0.0001. (B) Expression of Hoxb1, Hoxb4, and Hoxb9 quantified by RT-qPCR in E7.5 HoxB D-siteΔ/Δ embryos normalized by their expression in control embryos (n = 10). Results are shown as log10; *P < 0.05; **P < 0.01 by two-tailed Student’s t test. (C) Quantification of the positive area of in situ experiments shown in (D), normalized by the total area of the embryo. Results are shown as log10; *P < 0.05 by two-tailed Student’s t test. (D) Expression of Hoxb1 (top) and Hoxb4 (bottom) in E7.5 early head-fold stage HoxB D-siteΔ/Δ (right) embryos compared to controls (left); n (control/HoxB D-siteΔ/Δ) = 4/6 (Hoxb1) and 4/7 (Hoxb4). Scale bar, 200 μm.

Similar articles

Cited by

References

    1. Nichols J., Smith A., Pluripotency in the embryo and in culture. Cold Spring Harb. Perspect. Biol. 4, a008128 (2012). - PMC - PubMed
    1. Osorno R., Tsakiridis A., Wong F., Cambray N., Economou C., Wilkie R., Blin G., Scotting P. J., Chambers I., Wilson V., The developmental dismantling of pluripotency is reversed by ectopic Oct4 expression. Development 139, 2288–2298 (2012). - PMC - PubMed
    1. Downs K. M., Systematic localization of Oct-3/4 to the gastrulating mouse conceptus suggests manifold roles in mammalian development. Dev. Dyn. 237, 464–475 (2008). - PubMed
    1. Zhang M., Leitch H. G., Tang W. W. C., Festuccia N., Hall-Ponsele E., Nichols J., Surani M. A., Smith A., Chambers I., Esrrb complementation rescues development of Nanog-Null germ cells. Cell Rep. 22, 332–339 (2018). - PMC - PubMed
    1. Hart A. H., Hartley L., Ibrahim M., Robb L., Identification, cloning and expression analysis of the pluripotency promoting Nanog genes in mouse and human. Dev. Dyn. 230, 187–198 (2004). - PubMed