. 2022 Jul 15;8(28):eabo5668.
doi: 10.1126/sciadv.abo5668. Epub 2022 Jul 13.

Cis-regulatory chromatin loops analysis identifies GRHL3 as a master regulator of surface epithelium commitment

Affiliations

Cis-regulatory chromatin loops analysis identifies GRHL3 as a master regulator of surface epithelium commitment

Huaxing Huang et al. Sci Adv. .

Abstract

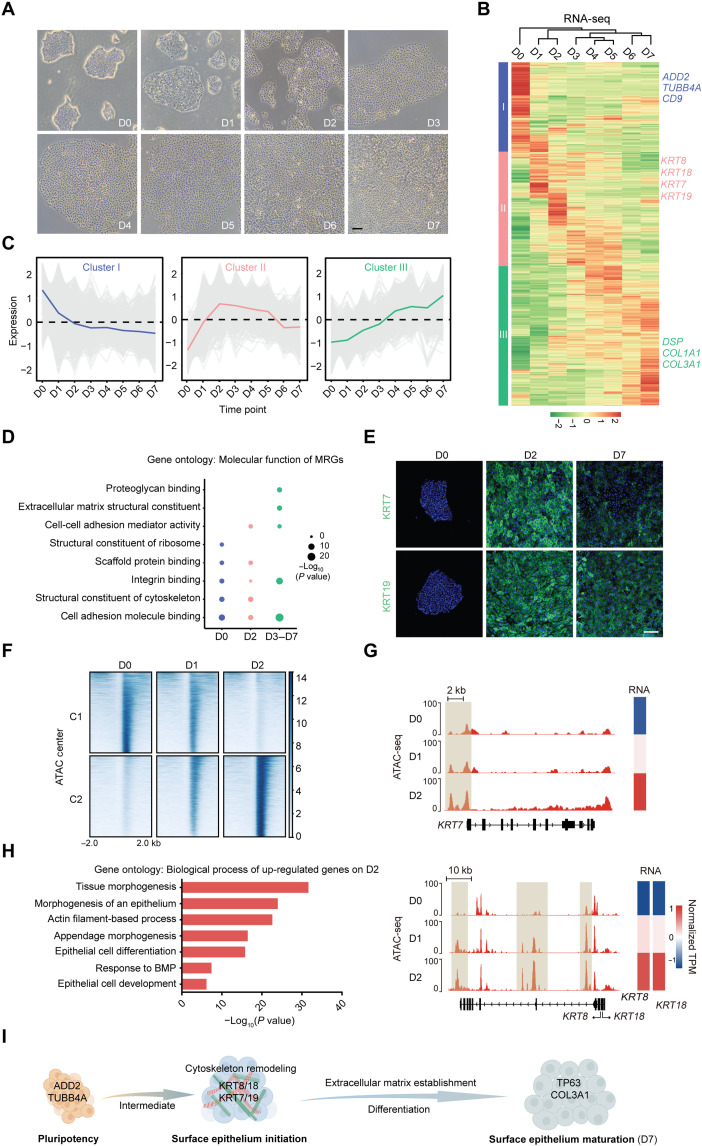
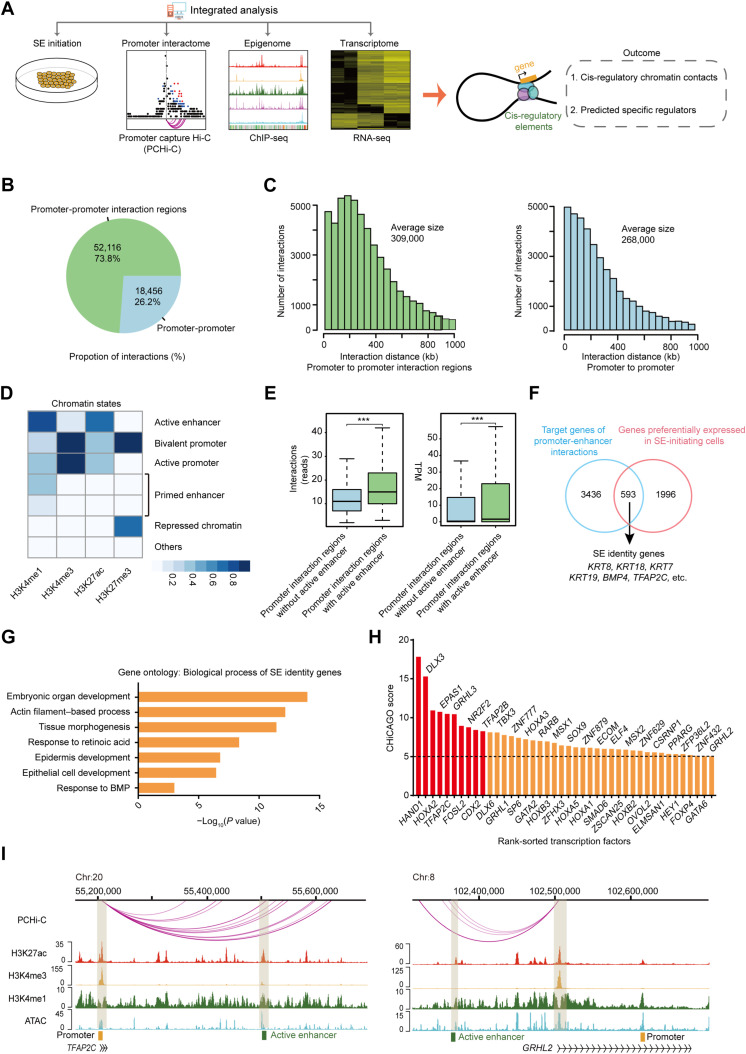
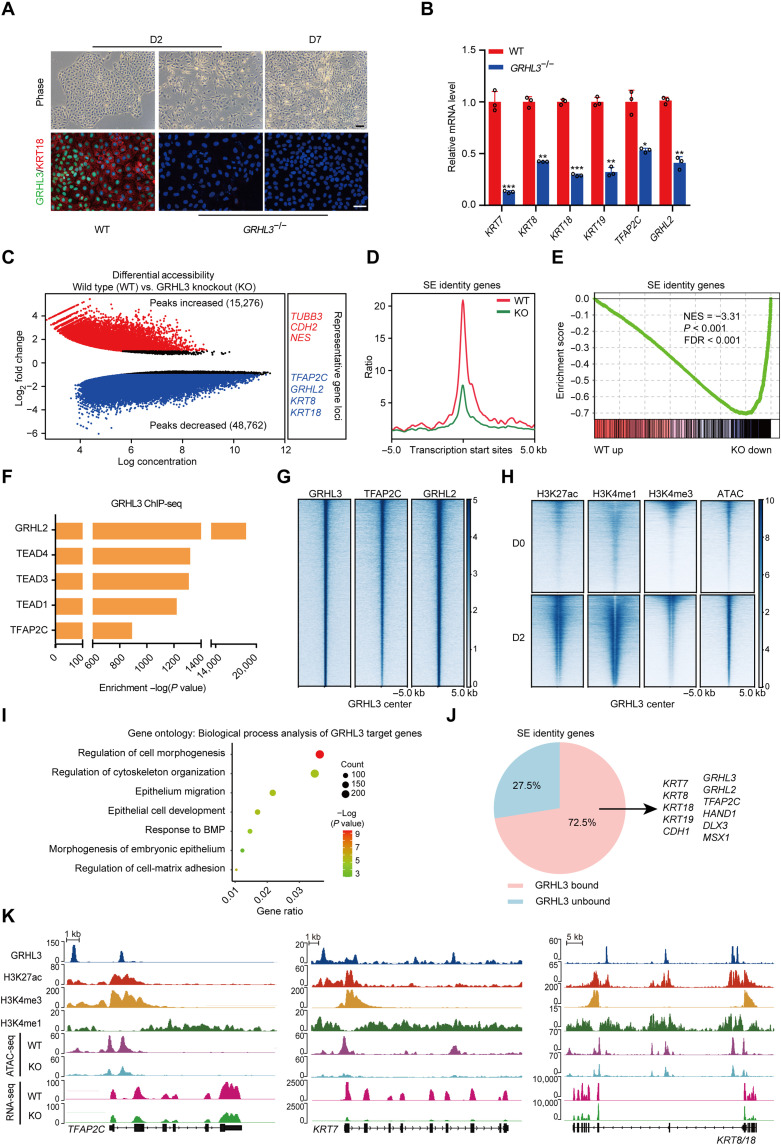
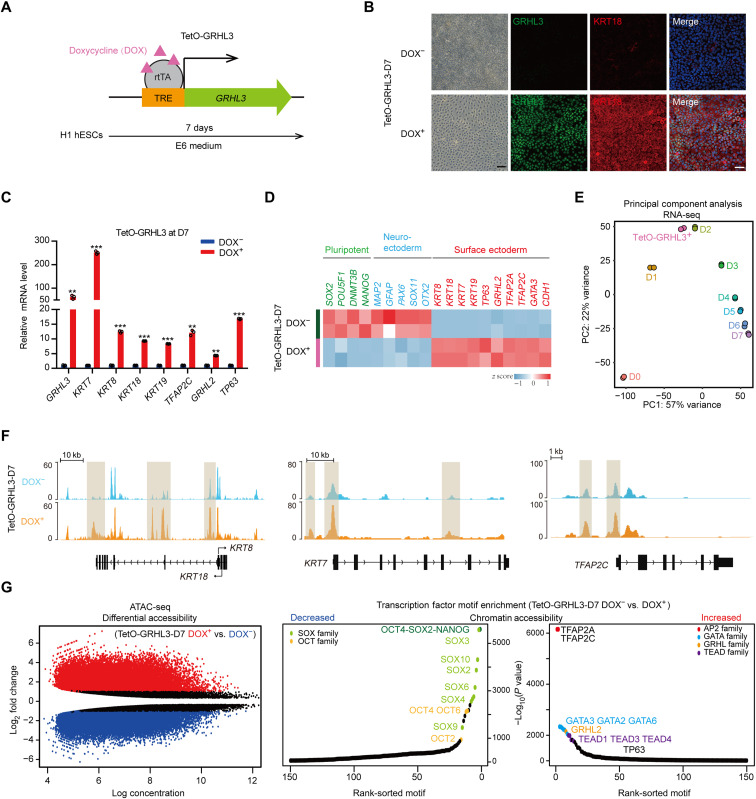
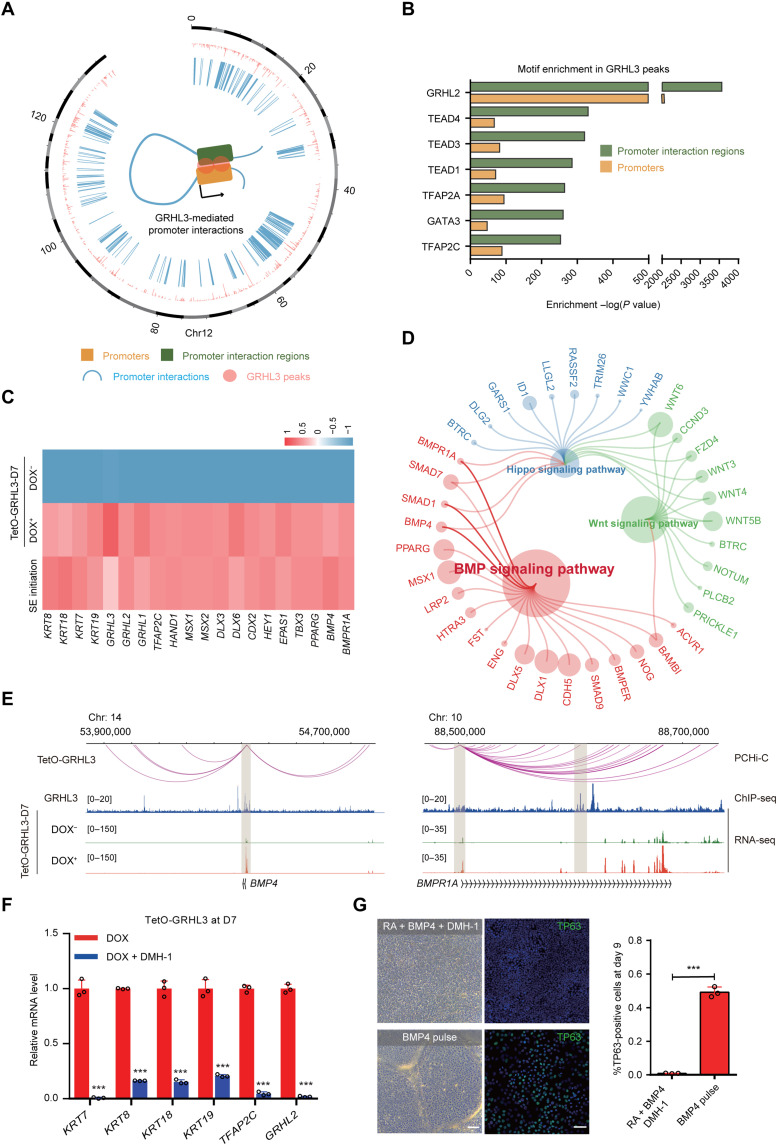
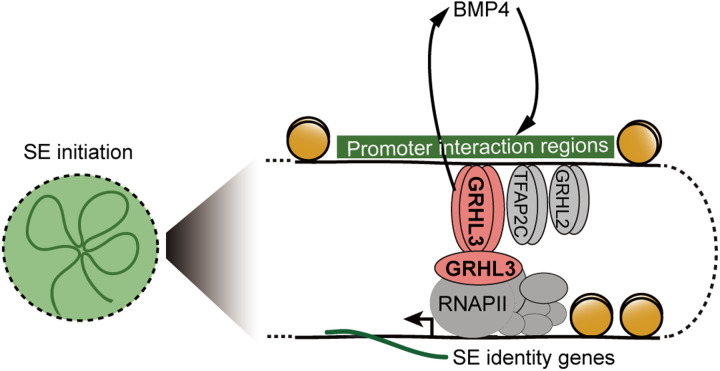
Understanding the regulatory network of cell fate acquisition remains a major challenge. Using the induction of surface epithelium (SE) from human embryonic stem cells as a paradigm, we show that the dynamic changes in morphology-related genes (MRGs) closely correspond to SE fate transitions. The marked remodeling of cytoskeleton indicates the initiation of SE differentiation. By integrating promoter interactions, epigenomic features, and transcriptome, we delineate an SE-specific cis-regulatory network and identify grainyhead-like 3 (GRHL3) as an initiation factor sufficient to drive SE commitment. Mechanically, GRHL3 primes the SE chromatin accessibility landscape and activates SE-initiating gene expression. In addition, the evaluation of GRHL3-mediated promoter interactions unveils a positive feedback loop of GRHL3 and bone morphogenetic protein 4 on SE fate decisions. Our work proposes a concept that MRGs could be used to identify cell fate transitions and provides insights into regulatory principles of SE lineage development and stem cell-based regenerative medicine.


Figures

Fig. 1.
Fig. 1.. Dynamic features of MRG identify cell fate transitions during SE lineage commitment.
(A) Phase contrast images of the differentiating hESCs during 7 days of culture. Scale bar, 100 μm. (B) Heatmap of MRG expression changes during SE differentiation. Hierarchical clustering yields three clusters of genes and four major groups of samples. The color bar shows the relative expression value [z score of TPM (transcripts per kilobase of exon model per million mapped reads)] from the RNA sequencing (RNA-seq). (C) The trend of expression changes of the three clusters identified from RNA-seq. (D) Gene ontology (molecular function) analysis of MRGs at each time point. (E) Immunofluorescence staining of KRT7 and KRT19 in the differentiated cells on D0, D2, and D7. Scale bar, 100 μm. (F) K-means clustering analysis of differential open chromatin regions during the first 2 days of SE differentiation. The color bar shows the relative assay for transposase accessible chromatin with high-throughput sequencing(ATAC-seq) signal (z score of normalized read counts) as indicated. (G) Snapshots of genome browser showing chromatin accessibility at KRT7, KRT8, and KRT18 loci. Gene expression is also displayed in heatmaps (log2 TPM). The genome browser view scales were adjusted on the basis of the global data range. (H) Representative gene ontology terms (biological process) identified from the differentially expressed genes in D2 differentiated cells. (I) Schematic diagram of SE differentiation.
Fig. 2.
Fig. 2.. Multiomics analysis delineates the cis-regulatory network of SE initiation.
(A) Scheme of the research route and method in this study. (B) Pie chart of the number and percentage of promoter-promoter interactions and promoter-promoter interaction regions interactions of SE-initiating cells. (C) Histograms of the distribution of the distance between promoter and promoter interaction regions and between promoter and promoter of SE-initiating cells. (D) Heatmap of different ChromHMM state enrichment of SE-initiating cells. The blue shading depicts the average intensity of a particular epigenetic mark across each chromatin state. The color scale shows the relative enrichment. (E) Left: Box plot of the number of interactions in promoter interaction regions with or without active enhancer. Right: Box plot of the target gene expression level of promoter interaction regions with or without active enhancer ***P < 0.001 from two-way ANOVA. (F) Venn diagram showing overlap between SE identity genes and genes highly expressed in SE-initiating cells. (G) Representative gene ontology terms (biological process) identified from SE identity genes. (H) Histogram of CHiCAGO scores of the candidate transcription factors. (I) Genome browser view of H3K27ac, H3K4me3, H3K4me1, ATAC-seq signals, and promoter-enhancer interactions at TFAP2C and GRHL2 loci in SE-initiating cells. Chromatin states are indicated (active enhancer, green; active promoter, yellow).
Fig. 3.
Fig. 3.. GRHL3 is required to activate SE identity genes through opening their chromatin accessibilities.
(A) Wild-type (WT) and GRHL3-knockout hESCs during SE differentiation. Top: Phase contrast images. Bottom: Immunofluorescence staining of GRHL3 (green) and KRT18 (red). Scale bars, 100 μm. (B) Quantitative reverse transcription polymerase chain reaction (qRT-PCR) analysis of representative genes in wild-type and GRHL3-knockout hESCs after 2 days of differentiation. qRT-PCR values were normalized to the values in wild-type group. Values are presented as means ± SD (n = 3 biological replicates; *P < 0.05; **P < 0.01; ***P < 0.001; t test). (C) Scatterplot of differential accessibility in wild-type versus GRHL3-knockout (KO) hESCs after 2 days of differentiation. Sites identified as significantly differentially bound [log2 fold change > 1 or < −1 and false discovery rate (FDR) < 0.05] are shown in color (red, peaks increased; blue, peaks decreased). (D) Metaplots of average ATAC-seq density around the SE identity genes in wild-type and GRHL3-knockout hESCs after 2 days of differentiation. (E) Gene set enrichment analysis of the SE identity gene set in the gene expression matrix of wild-type and GRHL3-knockout hESCs after 2 days of differentiation. NES, normalized enrichment score. (F) Enrichment of transcription factor motifs identified by HOMER at GRHL3 peaks. (G) Heatmaps of the binding signals of TFAP2C and GRHL2 at the center of GRHL3 peaks. (H) Heatmaps of H3K27ac, H3K4me1, H3K4me3, and ATAC-seq signals at GRHL3 peaks in hESCs and SE-initiating cells. (I) Gene ontology (biological process) analysis for the GRHL3 putative target genes. The GRHL3 peaks were annotated as follows: The intergenic peaks were assigned to the closest genes, and the intragenic peaks were assigned to those genes. (J) Pie chart of the percentages of SE identity genes with or without GRHL3 binding in SE-initiating cells. (K) Genome browser view of H3K27ac, H3K4me3, H3K4me1, GRHL3, ATAC-seq, and RNA-seq signal at TFAP2C, KRT7, and KRT8/18 loci.
Fig. 4.
Fig. 4.. GRHL3 induces SE commitment.
(A) Schematic diagram of establishment of a TetO-GRHL3 doxycycline-inducible expression system in hESC. Cells were induced with doxycycline for 7 days. TRE, tetracycline response element; rtTA, reverse tetracycline transactivator. (B) Immunofluorescence staining of GRHL3 (green) and KRT18 (red) in TetO-GRHL3+ and TetO-GRHL3 cells. Left: Phase contrast images. Scale bars, 100 μm. (C) qRT-PCR analysis of representative genes in TetO-GRHL3+ and TetO-GRHL3 cells. qRT-PCR values were normalized to the values in TetO-GRHL3 cells. Values are presented as means ± SD (n = 3 biological replicates; **P < 0.01; ***P < 0.001; t test). (D) Heatmap of germ layer–specific gene expression levels in TetO-GRHL3+ and TetO-GRHL3 cells. (E) PCA of RNA-seq data of TetO-GRHL3+ cells and hESCs at each time points during SE differentiation. (F) Genome browser tracks comparing ATAC-seq signal at KRT8/18, KRT7, and TFAP2C loci in TetO-GRHL3+ and TetO-GRHL3 cells. (G) Left: Scatterplot of differential accessibility in TetO-GRHL3+ versus TetO-GRHL3 cells. Sites identified as significantly differentially bound are shown in color (red, peaks increased; blue, peaks decreased). Right: Transcription factor motif enrichment in the regions of differential accessibility in TetO-GRHL3+ versus TetO-GRHL3 cells. TEAD, TEA domain transcription factor.
Fig. 5.
Fig. 5.. Positive feedback of the BMP4-GRHL3 axis mediated SE commitment.
(A) Circos diagram of genomic promoter associated interactions mediated by GRHL3 in TetO-GRHL3+ cells. The pink color refers to GRHL3 peak. The blue color refers to promoter interactions. (B) Enrichment of transcription factor motifs identified by HOMER in GRHL3 peaks of promoter interaction regions or promoters. (C) Heatmap showing expression levels of representative genes in SE-initiating cells, TetO-GRHL3+ and TetO-GRHL3 cells. (D) Pathway enrichment analysis of representative genes in TetO-GRHL3+ cells. (E) Genome browser view of promoter interactions, GRHL3, and RNA-seq signals at BMP4 and BMPR1A loci. (F) qRT-PCR analysis of representative genes in TetO-GRHL3+ cells with or without DMH-1 for 7 days. qRT-PCR values were normalized to the values in control cells. Values are shown as means ± SD (n = 3 biological replicates; ***P < 0.001; t test). (G) Phase contrast images and TP63 staining of the differentiated hESCs after 9 days of culture. Top: hESCs treated with RA/BMP4/DMH-1. Bottom: hESC treated with a 1-day pulse of BMP4. Right: Quantification of the percentage of TP63+ cells. Values are shown as means ± SD (n = 3 biological replicates; ***P < 0.001; t test). Scale bars, 100 μm.
Fig. 6.
Fig. 6.. A proposed mechanical model of SE initiation.
An early initiation factor, GRHL3, drives SE initiation by priming chromatin accessibility and activating the SE identity gene expression. A positive feedback loop between GRHL3 and BMP4 controls SE commitment.

Similar articles

Cited by

References

    1. Li L., Wang Y., Torkelson J. L., Shankar G., Pattison J. M., Zhen H. H., Fang F., Duren Z., Xin J., Gaddam S., Melo S. P., Piekos S. N., Li J., Liaw E. J., Chen L., Li R., Wernig M., Wong W. H., Chang H. Y., Oro A. E., TFAP2C- and p63-dependent networks sequentially rearrange chromatin landscapes to drive human epidermal lineage commitment. Cell Stem Cell 24, 271–284.e8 (2019). - PMC - PubMed
    1. Fan X., Wang D., Burgmaier J. E., Teng Y., Romano R. A., Sinha S., Yi R., Single cell and open chromatin analysis reveals molecular origin of epidermal cells of the skin. Dev. Cell 47, 133 (2018). - PubMed
    1. Schoenfelder S., Furlan-Magaril M., Mifsud B., Tavares-Cadete F., Sugar R., Javierre B. M., Nagano T., Katsman Y., Sakthidevi M., Wingett S. W., Dimitrova E., Dimond A., Edelman L. B., Elderkin S., Tabbada K., Darbo E., Andrews S., Herman B., Higgs A., LeProust E., Osborne C. S., Mitchell J. A., Luscombe N. M., Fraser P., The pluripotent regulatory circuitry connecting promoters to their long-range interacting elements. Genome Res. 25, 582–597 (2015). - PMC - PubMed
    1. Rubin A. J., Barajas B. C., Furlan-Magaril M., Lopez-Pajares V., Mumbach M. R., Howard I., Kim D. S., Boxer L. D., Cairns J., Spivakov M., Wingett S. W., Shi M., Zhao Z., Greenleaf W. J., Kundaje A., Snyder M., Chang H. Y., Fraser P., Khavari P. A., Lineage-specific dynamic and pre-established enhancer-promoter contacts cooperate in terminal differentiation. Nat. Genet. 49, 1522–1528 (2017). - PMC - PubMed
    1. Freire-Pritchett P., Schoenfelder S., Varnai C., Wingett S. W., Cairns J., Collier A. J., Garcia-Vilchez R., Furlan-Magaril M., Osborne C. S., Fraser P., Rugg-Gunn P. J., Spivakov M., Global reorganisation of cis-regulatory units upon lineage commitment of human embryonic stem cells. eLife 6, e21926 (2017). - PMC - PubMed