. 2022 Jul 8;377(6602):198-204.
doi: 10.1126/science.abn4663. Epub 2022 Jul 7.

Sound induces analgesia through corticothalamic circuits

Affiliations

Sound induces analgesia through corticothalamic circuits

Wenjie Zhou et al. Science. .

Abstract

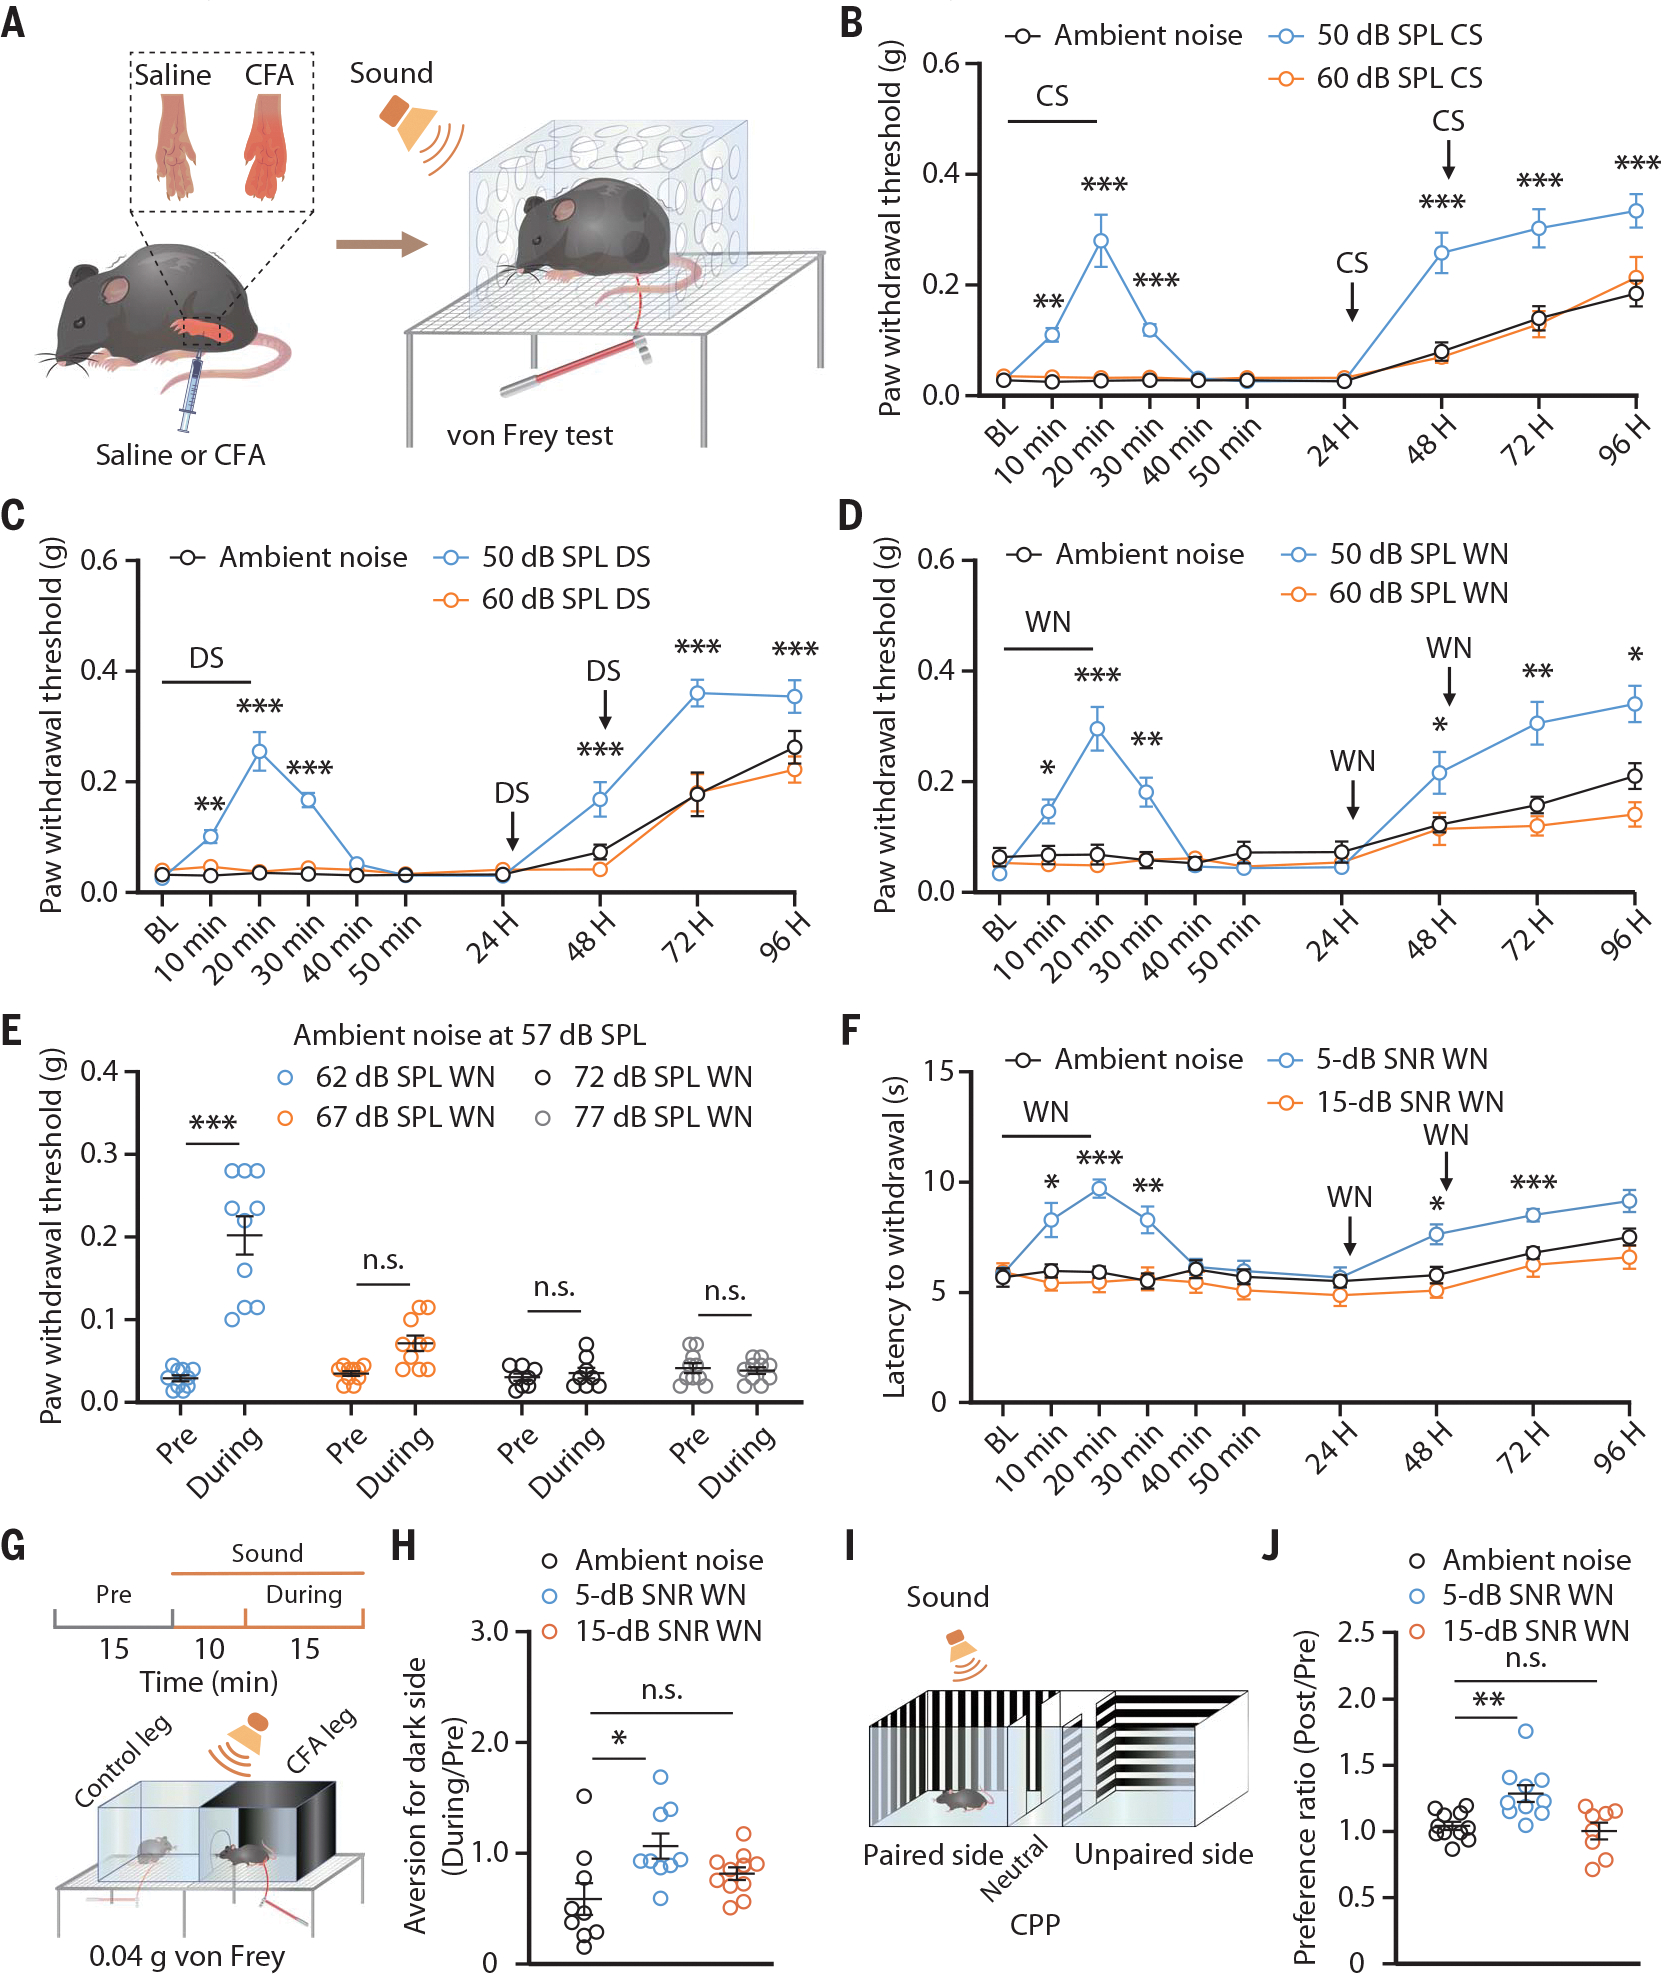
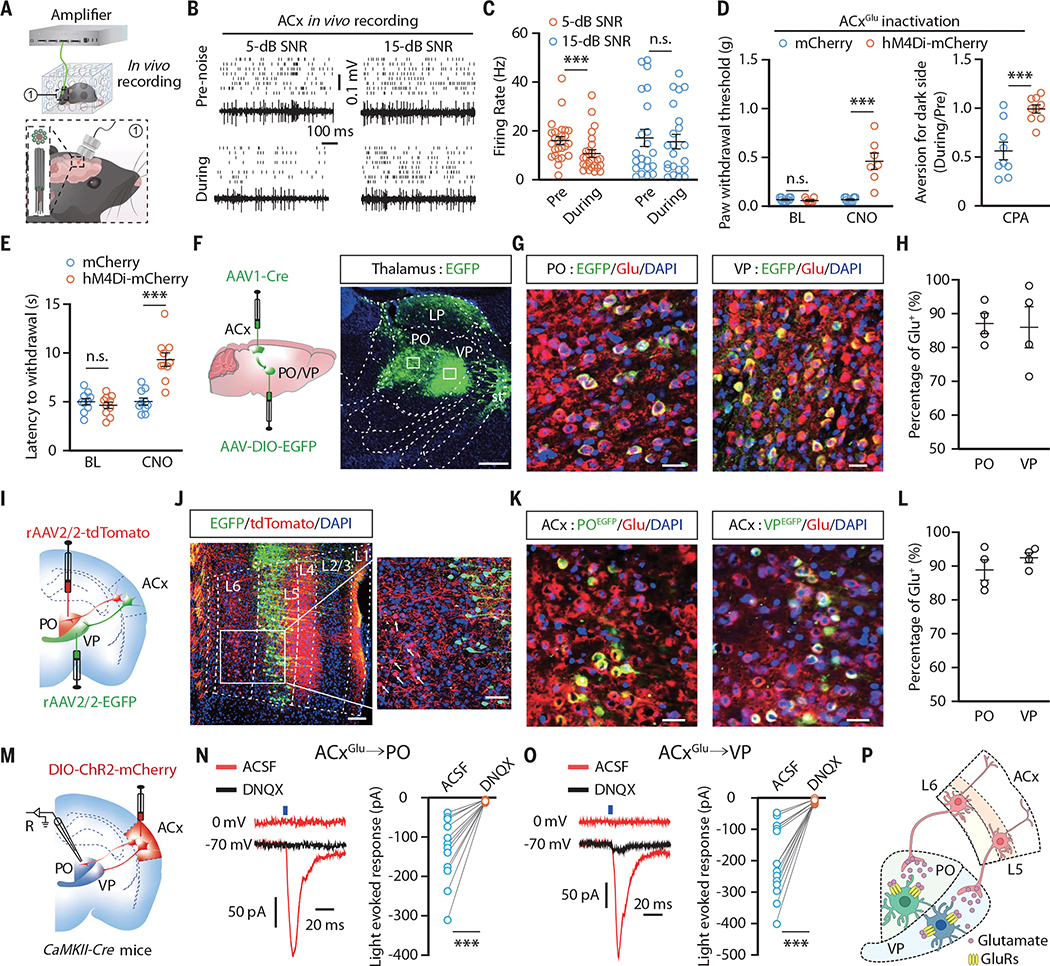
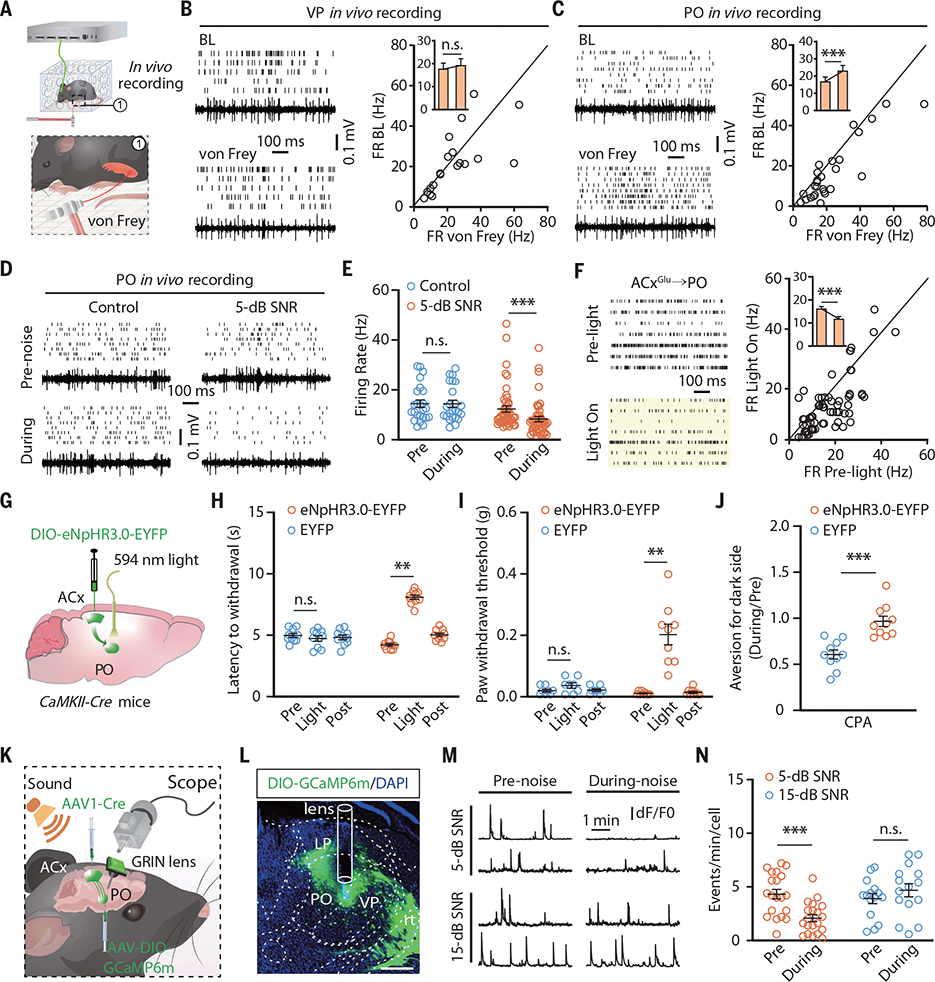
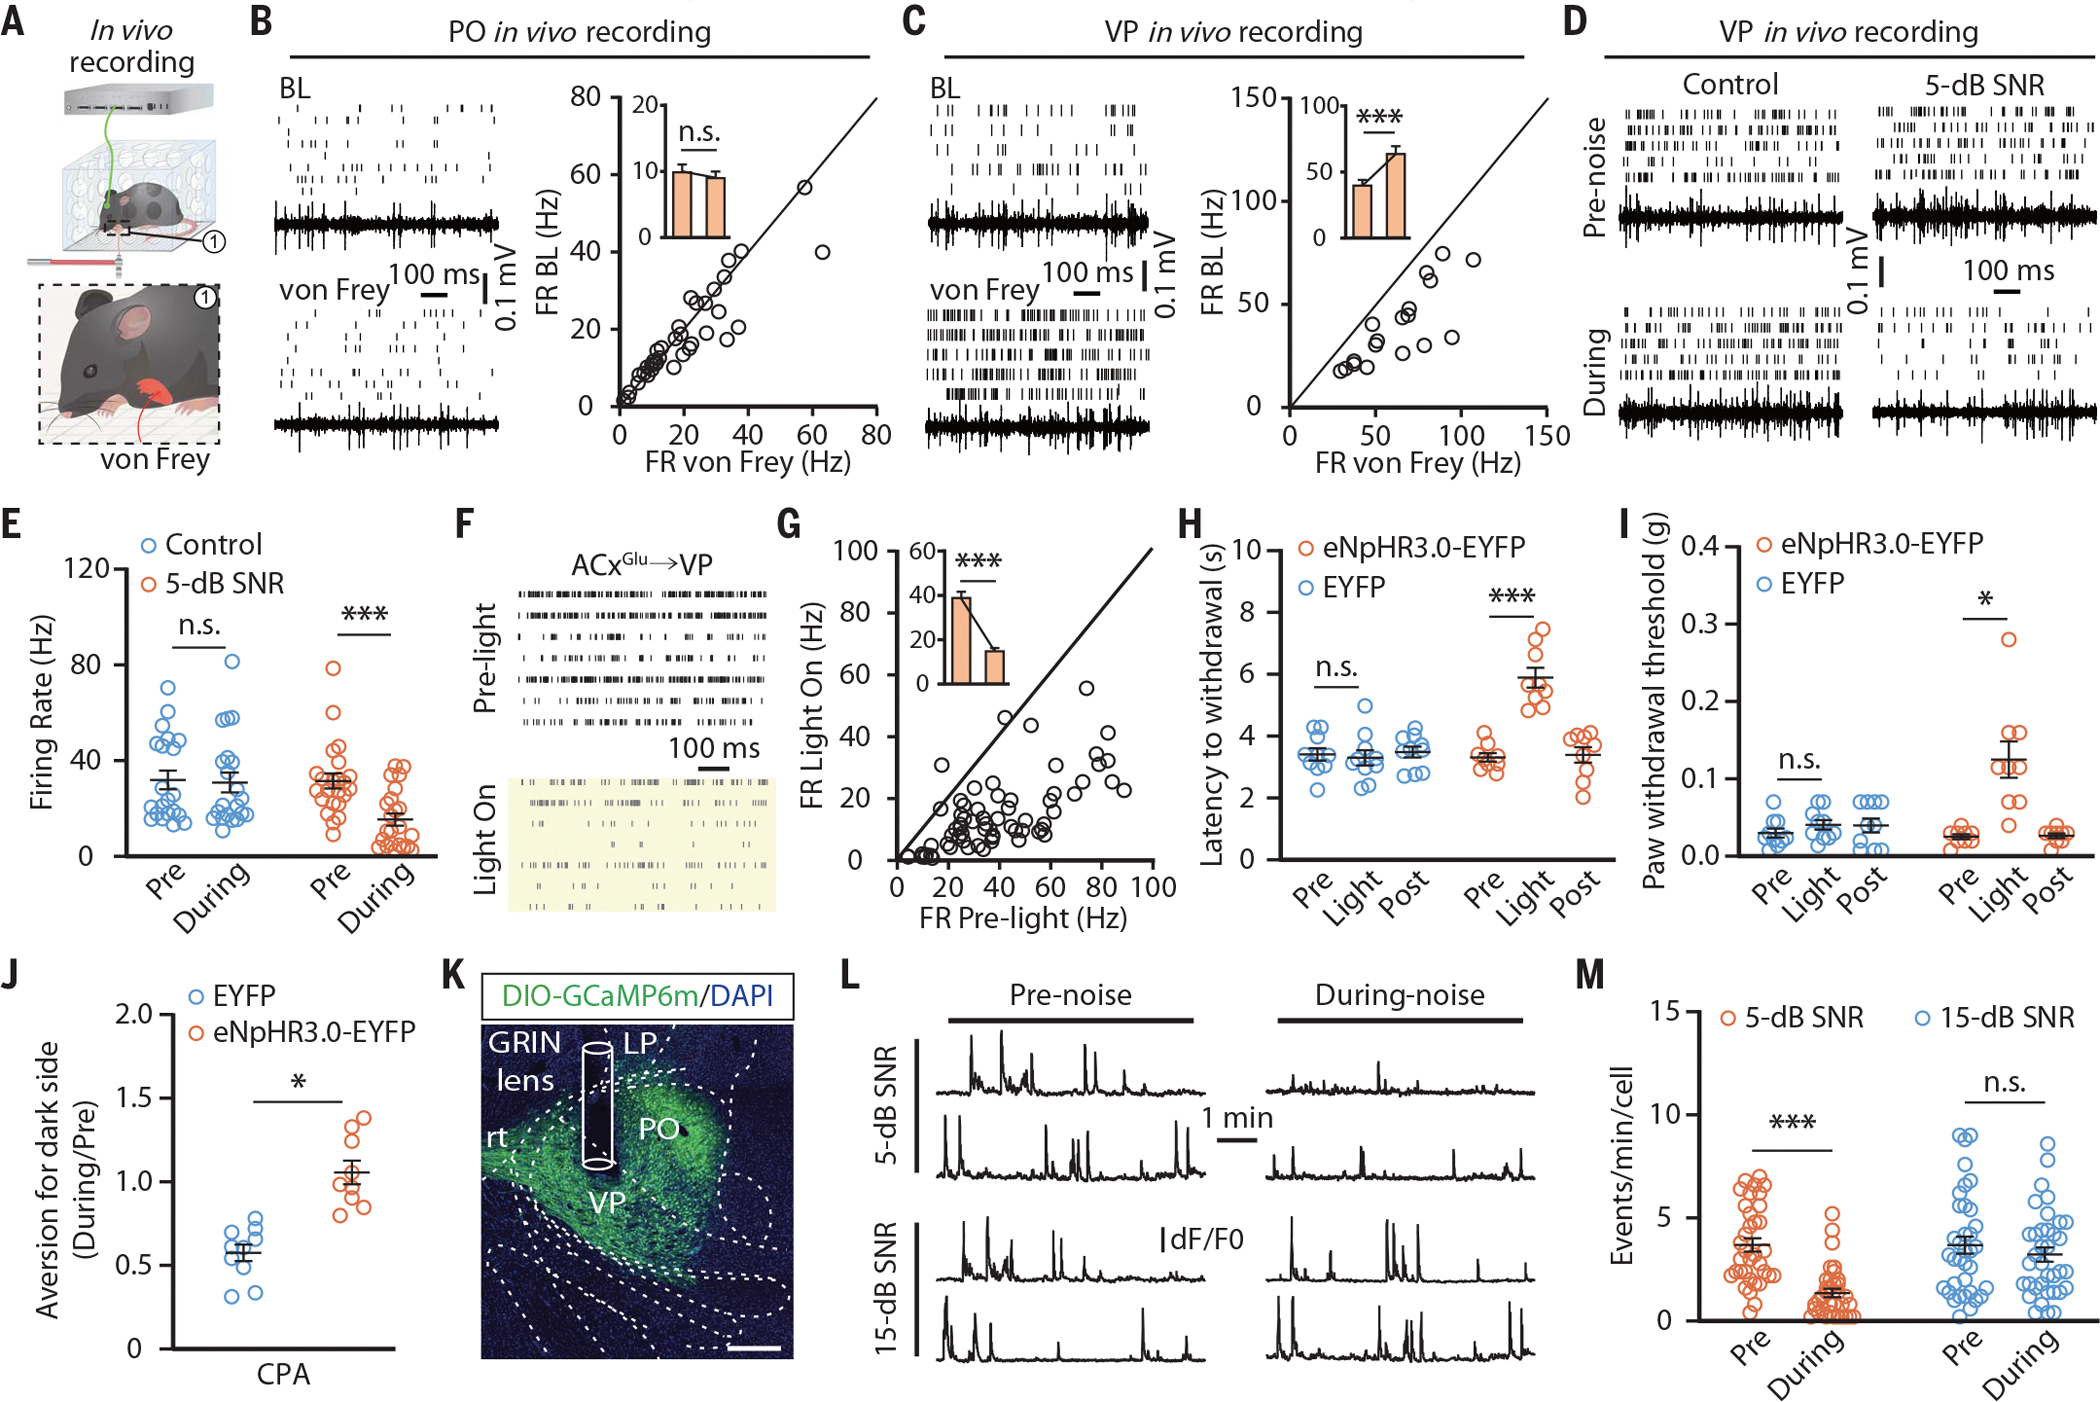
Sound-including music and noise-can relieve pain in humans, but the underlying neural mechanisms remain unknown. We discovered that analgesic effects of sound depended on a low (5-decibel) signal-to-noise ratio (SNR) relative to ambient noise in mice. Viral tracing, microendoscopic calcium imaging, and multitetrode recordings in freely moving mice showed that low-SNR sounds inhibited glutamatergic inputs from the auditory cortex (ACxGlu) to the thalamic posterior (PO) and ventral posterior (VP) nuclei. Optogenetic or chemogenetic inhibition of the ACxGlu→PO and ACxGlu→VP circuits mimicked the low-SNR sound-induced analgesia in inflamed hindpaws and forepaws, respectively. Artificial activation of these two circuits abolished the sound-induced analgesia. Our study reveals the corticothalamic circuits underlying sound-promoted analgesia by deciphering the role of the auditory system in pain processing.


Conflict of interest statement

Competing interests: The authors declare that they have no competing interests.

Figures

Fig. 1.
Fig. 1.. Low-intensity sound relative to ambient noise induces analgesia in mice.
(A) Schematic for inducing inflammatory pain and the von Frey test to assess the mechanical nociceptive threshold. Sound refers to delivered consonant sound (CS), dissonant sound (DS), or white noise (WN) given at the indicated SPLs. (B to D) The mechanical nociceptive threshold in CFA mice treated with or without consonant sound (ambient noise, n = 10 mice; 50-dB SPL, n = 10 mice; 60-dB SPL, n = 8 mice; P < 0.0001) (B), dissonant sound (n = 10 mice each group; P < 0.0001) (C), and white noise (ambient noise, n = 10 mice; 50-dB SPL, n = 10 mice; 60-dB SPL, n = 8 mice; P < 0.0001) (D) in an environment with an ambient noise at 45-dB SPL. BL, baseline. (E) The mechanical nociceptive threshold of CFA mice exposed to white noise at different intensities in an environment with ambient noise at 57-dB SPL (62-dB SPL, n = 10 mice; 67-dB SPL, n = 10 mice; 72-dB SPL, n = 8 mice; 77-dB SPL, n = 10 mice; P < 0.0001). (F) The thermal nociceptive threshold assessed by the Hargreaves test in CFA mice exposed to different SNR white noise (n = 10 mice each group; P < 0.0001). (G) Schematic for the CPA test. (H) Summarized data for the von Frey filament stimulus-induced place aversion in CFA mice treated with or without white noise (ambient noise, n = 9 mice; 5-dB SNR, n = 9 mice; 15-dB SNR, n = 11 mice; P = 0.0165). (I) Schematic for the CPP test (J) Summarized data for preference ratio for the sound-delivery side in CFA mice from the indicated group (ambient noise, n = 11 mice; 5-dB SNR, n = 10 mice; 15-dB SNR, n = 8 mice; P = 0.0015). The data are expressed as the means ± SEMs. *P < 0.05; **P < 0.01; ***P < 0.001; n.s., not significant. Details of the statistical analyses are presented in table S1.
Fig. 2.
Fig. 2.. ACxGlu neurons project to VPGlu and POGlu neurons.
(A) Schematic for multitetrode recording in freely moving mice. (B and C) Raster plots and voltage traces of the spontaneous firings recorded in the ACx (B) and summarized data (5-dB SNR, n = 25 cells from four mice; 15-dB SNR, n = 22 cells from four mice; P = 0.0053) (C). (D and E) Summarized data for the mechanical nociceptive threshold (mCherry, n = 10 mice; hM4Di-mCherry, n = 8 mice; BL, P = 0.3816; CNO, P < 0.0001) [(D), left], place aversion (n = 9 mice each group; P = 0.0006) [(D), right], and thermal nociceptive threshold (n = 10 mice each group; P < 0.0001) (E) in CFA mice upon chemogenetic inhibition of ACxGlu neurons. (F) Schematic for anterograde tracing and representative image of EGFP-expressing neurons in the PO and VP. Scale bar, 500 μm. LP, lateral posterior thalamic nucleus; st, stria terminalis. (G and H) Representative images showing the colocalization of EGFP-labeled neurons with glutamate (Glu) immunofluorescence (G) and summarized data (n = 4 slices) (H). Scale bars, 50 μm. DAPI, 4’,6-diamidino-2-phenylindole. (I) Schematic for retrograde tracing. (J) Representative images showing EGFP+ and tdTomato+ neurons in the ACx. Scale bars, 100 μm. (K and L) Representative images of the colocalization of EGFP-labeled PO- and VP-projecting ACx neurons with glutamate immunofluorescence (K) and summarized data (n = 4 slices) (L). Scale bars, 50 μm. (M) Schematic for viral injection and whole-cell recordings. R, recording. (N and O) Representative traces and summarized data for light-evoked postsynaptic currents recorded in PO neurons (n = 12 cells from four mice; P = 0.0002) (N) and VP neurons (n = 14 cells from four mice; P < 0.0001) (O). ACSF, artificial cerebrospinal fluid; DNQX, 6,7-dinitroquinoxaline-2,3-dione. (P) A model of ACxGlu→PO and ACxGlu→VP circuits. GluRs, glutamate receptors. The data are expressed as the means ± SEMs. ***P < 0.001; n.s., not significant. Details of the statistical analyses are presented in table S1.
Fig. 3.
Fig. 3.. Low-SNR sound inhibits the ACxGlu→PO circuit to induce analgesia on hindpaws.
(A) Schematic for multitetrode recording in freely moving mice with punctate mechanical stimulation (von Frey filament, 0.04 g). (B and C) Raster plots, voltage traces, and summarized data for the spontaneous firings recorded in VP neurons (n = 19 cells from four mice; P = 0.5079) (B) and in PO neurons (n = 27 cells from five mice; P = 0.0003) (C) before and during punctate mechanical stimulation of CFA-injected hindpaws. FR BL, firing rate baseline. (D and E) Raster plots and voltage traces of the spontaneous firings recorded in PO neurons in CFA mice with or without 5-dB SNR white noise exposure (D) and summarized data (control, n = 24 cells from four mice; 5-dB SNR, n = 47 cells from eight mice; P < 0.0001) (E). (F) Raster plots of the spontaneous firings recorded in PO neurons before and during optical inhibition of the ACxGlu→PO circuit (left) and summarized data (n = 71 cells from seven mice; P < 0.0001) (right). (G) Schematic for optogenetic inhibition of the ACxGlu→PO circuit. (H to J) Summarized data for the thermal nociceptive threshold (EYFP, n = 10 mice; eNpHR3.0-EYFP, n = 9 mice; P < 0.0001) (H), mechanical nociceptive threshold (EYFP, n = 8 mice; eNpHR3.0-EYFP, n = 9 mice; P < 0.0001) (I), and place aversion (n = 10 mice each group; P = 0.0001) (J) after optical inhibition of the ACxGlu→PO circuit in CFA mice. (K) Schematic for vial injection and microendoscopic calcium imaging. (L) A typical image showing the GCaMP6m fluorescence and track of lens in the PO. Scale bar, 200 μm. rt, reticular thalamic nucleus. (M and N) Representative traces of spontaneous Ca2+ signal transient recorded in PO neurons receiving ACx projections (M) and summarized data (5-dB SNR, n = 20 cells from four mice; 15-dB SNR, n = 15 cells from four mice; P < 0.0001) (N). dF/F0, the change in fluorescence (dF) over the baseline fluorescence (F0) of calcium spikes. The data are expressed as the means ± SEMs. **P < 0.01; ***P < 0.001; n.s., not significant. Details of the statistical analyses are presented in table S1.
Fig. 4.
Fig. 4.. Inhibition of the ACxGlu→VP circuit mediates low-SNR sound-induced analgesia on forepaws.
(A) Schematic for multitetrode recording in the VP or PO of freely moving mice. (B and C) Raster plots, voltage traces, and summarized data for the spontaneous firings recorded in PO neurons (n = 36 cells from four mice; t35 = 1.749; P = 0.089) (B) and VP neurons (n = 18 cells from four mice; t17 = 7.373; P < 0.0001) (C) before and during punctate mechanical stimulation (von Frey filament, 0.02 g) of inflamed forepaws. (D and E) Raster plots and voltage traces of the spontaneous firings recorded in VP neurons from CFA mice with or without 5-dB SNR white noise exposure (D) and summarized data (control, n = 21 cells from four mice; 5-dB SNR, n = 23 cells from four mice; F1,42 = 24.18; P < 0.0001) (E). (F and G) Raster plots of the spontaneous activity recorded in VP neurons before and during optical inhibition of the ACxGlu→VP circuit in CFA-treated mice (F) and summarized data (n = 67 cells from seven mice; t66 = 12.14; P < 0.0001) (G). (H to J) Summarized data for the thermal (EYFP, n = 10 mice; eNpHR3.0-EYFP, n = 9 mice; F2,34 = 20.98; P < 0.0001) (H) and mechanical (EYFP, n = 10 mice; eNpHR3.0-EYFP, n = 9 mice; F2,34 = 13.25; P < 0.0001) (I) nociceptive thresholds of CFA-injected forepaws and place aversion (EYFP, n = 10 mice; eNpHR3.0-EYFP, n = 9 mice; t17 = 5.648; P < 0.0001) (J) upon optical inhibition of the ACxGlu→VP circuit. (K) A typical image of GCaMP6m fluorescence and track of the lens in the VP. Scale bar, 200 μm. (L and M) Representative traces (L) of spontaneous Ca2+ signals recorded in VP neurons receiving ACx projections and summarized data (5-dB SNR, n = 35 cells from four mice; 15-dB SNR, n = 36 cells from four mice; F1,69 = 24.24; P < 0.0001) (M). The data are expressed as the means ± SEMs. *P < 0.05; ***P < 0.001; n.s., not significant. Details of the statistical analyses are presented in table S1.

Comment in

  • Sounding out pain.
    Kuner R, Kuner T. Kuner R, et al. Science. 2022 Jul 8;377(6602):155-156. doi: 10.1126/science.add0640. Epub 2022 Jul 7. Science. 2022. PMID: 35857551

Similar articles

Cited by

References

    1. Gardner WJ, Licklider JC, Weisz AZ, Science 132, 32–33 (1960). - PubMed
    1. Keenan A, Keithley JK, Oncol. Nurs. Forum 42, E368–E375 (2015). - PubMed
    1. Nguyen TN, Nilsson S, Hellström A-L, Bengtson A, J. Pediatr. Oncol. Nurs 27, 146–155 (2010). - PubMed
    1. Hartling L et al., JAMA Pediatr. 167, 826–835 (2013). - PubMed
    1. Boyd-Brewer C, McCaffrey R, Holist. Nurs. Pract 18, 111–118 (2004). - PubMed