. 2022 Jul 15;377(6603):276-284.
doi: 10.1126/science.abj8695. Epub 2022 Jul 14.

TCR-Vγδ usage distinguishes protumor from antitumor intestinal γδ T cell subsets

Affiliations

TCR-Vγδ usage distinguishes protumor from antitumor intestinal γδ T cell subsets

Bernardo S Reis et al. Science. .

Abstract

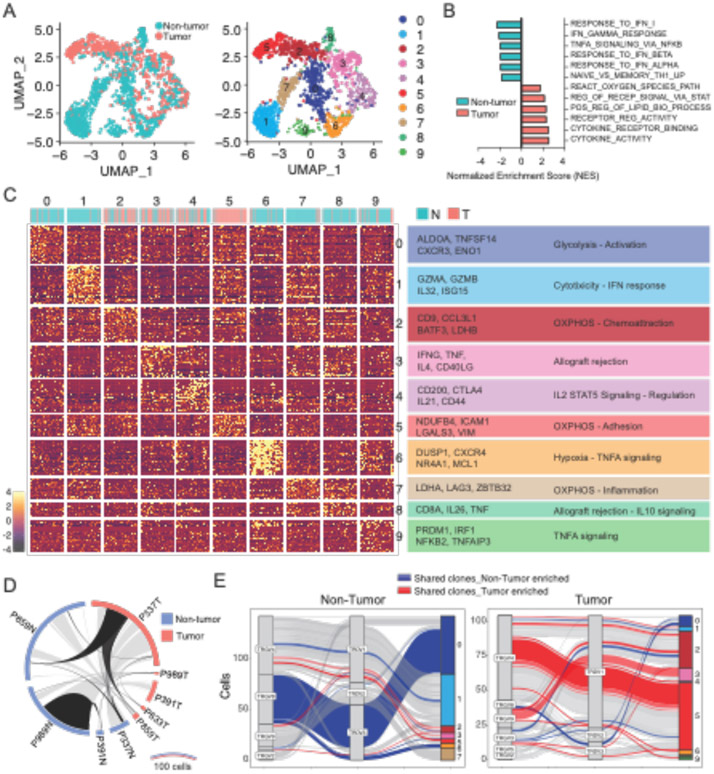
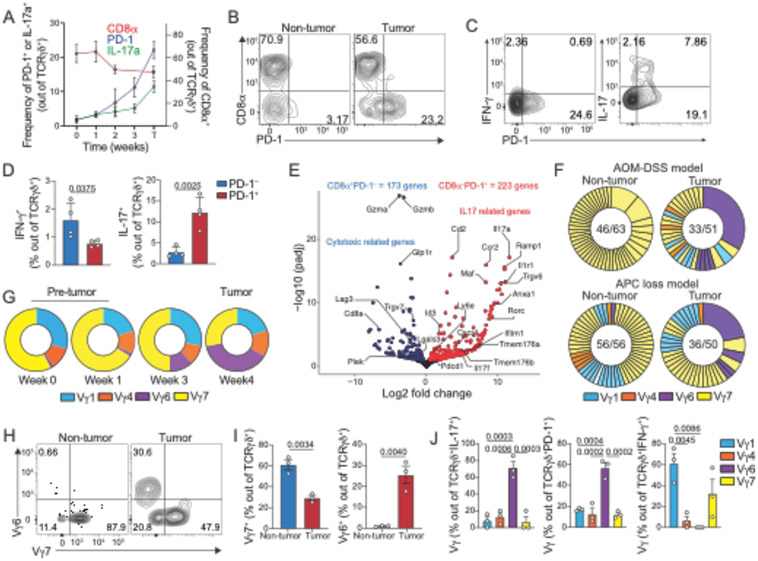
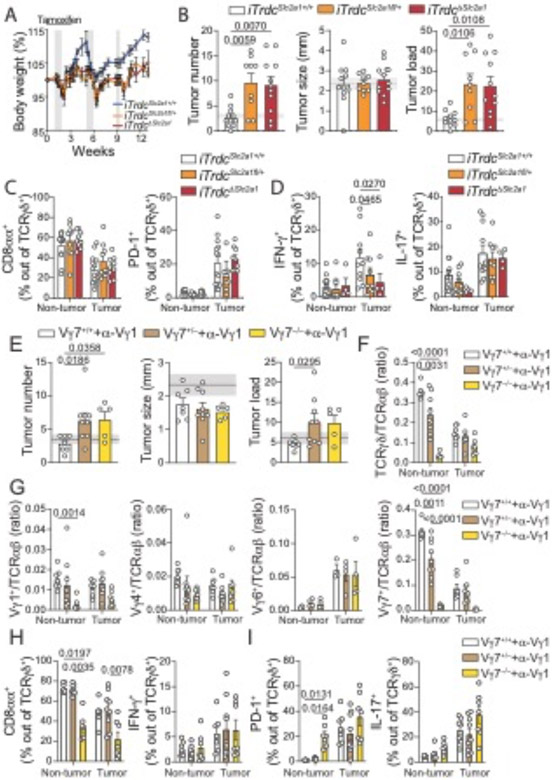
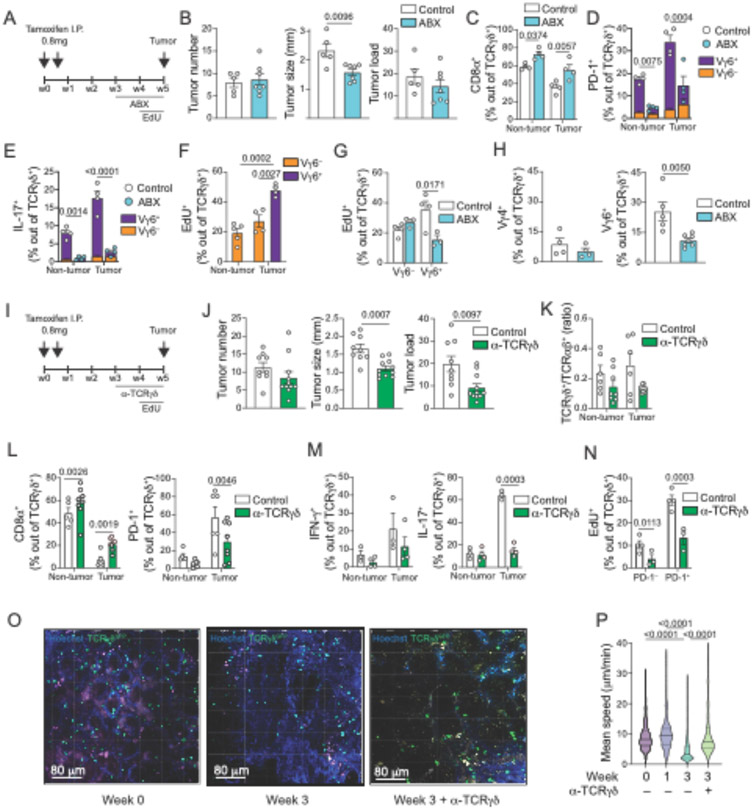
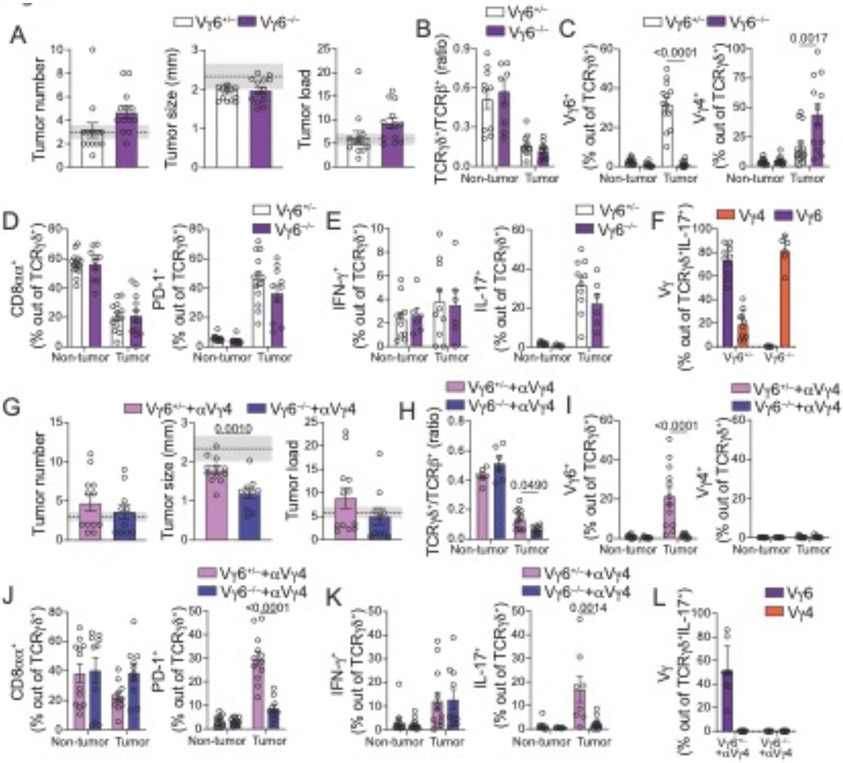
γδ T cells represent a substantial fraction of intestinal lymphocytes at homeostasis, but they also constitute a major lymphocyte population infiltrating colorectal cancers (CRCs); however, their temporal contribution to CRC development or progression remains unclear. Using human CRC samples and murine CRC models, we found that most γδ T cells in premalignant or nontumor colons exhibit cytotoxic markers, whereas tumor-infiltrating γδ T cells express a protumorigenic profile. These contrasting T cell profiles were associated with distinct T cell receptor (TCR)-Vγδ gene usage in both humans and mice. Longitudinal intersectional genetics and antibody-dependent strategies targeting murine γδ T cells enriched in the epithelium at steady state led to heightened tumor development, whereas targeting γδ subsets that accumulate during CRC resulted in reduced tumor growth. Our results uncover temporal pro- and antitumor roles for γδ T cell subsets.


Figures

Fig. 1.
Fig. 1.. Profiling of human γδ T cells in patients with CRC identifies tissue specific subsets.
(A-E) γδ+ T cells were sorted from tumor and adjacent (non-tumor) areas of human CRC colonic resection tissue and processed for 10X Genomics RNA and TCR sequencing. Cells were stimulated with PMA/Ionomycin prior to RNA sequencing. (A) UMAP plot colored by tissue (left) and gene expression cluster (right) of γδ+ T cells. (B) Gene set enrichment analysis (GSEA) of γδ+ T cells recovered from non-tumor (blue) and tumor (red) areas. (C) Gene expression heatmap and characterization of γδ+ clusters based on GSEA hallmarks. Contribution of non-tumor (blue) and tumor (red) cells in gene expression clusters is depicted above the heatmap. (D) Circos plot of shared clones between tissues (light gray) and between patients (black), based on amino acid CDR3 sequence. (E) Parallel plots depicting V gene usage and gene expression clusters of expanded clones found in non-tumor (left) and tumor (right) areas. Clones (represented by lines) shared between tissues are colored.
Fig. 2.
Fig. 2.. Profiling tumor–infiltrating γδ T cells in CRC models reveals distinct subsets.
(A-D) iCdx2ΔAPC animals were treated with tamoxifen and sacrificed at indicated time for analysis of large intestine IEls (week 0-3) and tumor areas (T week4). (A) Frequency of CD8α+ (right axis) and PD-1+ or IL-17+ (left axis) cells among TCRγδ+ T cells from large intestine before (week 0) and after (week 1, 2, 3 and T) tamoxifen treatment. (B) Representative dot-plot of CD8α+ and PD-1+ among TCR γδ+ cells at 4 weeks after tamoxifen administration. (C) Representative dot-plot and (D) frequency of IFN- γ+ (left) or IL-17+ (right) among tumor-infiltrating PD-1+ or PD-1− TCR γδ+ cells (APC loss model). (E) Volcano plot of differentially expressed genes from RNAseq analysis of sorted CD8α+PD-1 (blue) or CD8αPD-1+ (red) TCR γδ+ cells isolated from tumors of mice subjected to the AOM-DSS model. (F) Single-cell TCR sequencing of γδ T cells from tumor or non-tumor colonic tissue of 4 mice subjected to the AOM-DSS (top) and 4 mice from APC loss (bottom) models. Numbers in the center of pie charts represent number of clones (based on CDR3 aa sequence) per total cells sequenced. Expanded clones are fused. Clones are colored based on Vγ usage. Purple clones represent expanded Vγ6Vδ1 cell. (G) Pie chart of Vγ frequency among TCRγδ+ cells from large intestine tissue before (week 0) and after (week 1, 3 and T) tamoxifen treatment (APC loss model). (H-J) Vγ usage by γδ T cells from tumor or non-tumor colonic tissue of mice subjected to the AOM-DSS protocol. Representative dot-plot (H) and frequency (I) of Vγ6+ and Vγ7+ among TCRγδ+ cells.(J) Frequency of Vγ1+, Vγ4+, Vγ6+ and Vγ7+ among tumor-infiltrating TCRγδ+ cells expressing IL-17, PD-1 or IFN-γ. Representative data from 2 experiments with 3-4 animals per group. RNAseq and TCRseq data from pooled tumors. For cytokine staining, cells were stimulated with PMA and Ionomycin. Statistical P value differences are indicated. (E, I) two-tailed T-test, and (J) one-way ANOVA with Dunnett’s multiple comparison test). Error bars indicate SEM.
Fig. 3.
Fig. 3.. Loss-of-function or depletion of epithelium-resident γδ T cells results in increased tumor numbers.
(A-D) iTrdcSlc2a1fl/+, iTrdcΔSlc2a1 and littermate control (iTrdcSlc2al+/+) mice were subjected to AOM-DSS treatment, and tamoxifen was administered twice a week, starting 1 week before until 2 weeks after AOM injection. Animals were analyzed 12 weeks after initial AOM injection. (A) Mean percentage of body weight changes during AOM-DSS treatment. Gray bars represent DSS treatment. (B) Tumor number, size, and load. Shaded area bounded by dashed lines indicates mean ± SEM of all control C57BL6/J mice analyzed in fig. S3B (AOM-DSS model). (C, D) Flow cytometry analysis of γδ T cells from tumor or non-tumor colonic tissue. (C) Frequency of CD8α+ (left) and PD-1+ (right), and (D) IFN-γ+ (left) and IL-17+ (right) among TCRγδ+ cells in tumor or non-tumor colonic tissue. (E-I) Vγ7−/−, Vγ7+/− and littermate control mice (Vγ7+/+) were subjected to AOM-DSS model and analyzed 12 weeks after initial AOM injection. All groups were treated with 200μg of anti-Vγ1 depleting antibody (2.11) twice a week, starting one week before AOM administration until the second DSS cycle. (E) Tumor number, size and load. (F) Ratio of TCRγδ/αβ and (G) Vγ1/TCRαβ, Vγ4/TCRαβ, Vγ6/TCRαβ, Vγ7/TCRαβ among CD45+ cells from colonic tissue. (H) Frequency of CD8α+ (left) and IFN-γ+ (right) and (I) PD-1+ (left) and IL-17+ (right) among TCRγδ+ cells. iTrdcΔSlc2al data are pooled from 3 experiments with 3-5 animals per group. Vγ7−/− data are pooled from 2 experiments with 3-5 animals per group. For cytokine staining, cells were stimulated with PMA and Ionomycin. Statistical P value differences are indicated. (B-I) One-way ANOVA with Dunnett’s multiple comparison test. Error bars indicate SEM.
Fig. 4.
Fig. 4.. Tumor-infiltrating IL~17+ γδ T cells induce tumor growth in a microbiota- and TCR-dependent manner.
(A-P) iCdx2ΔAPC mice were treated with 2 i.p. injections of 0.8mg tamoxifen and analyzed 5 weeks after (A-N) or at the indicated time (O, P). For recovery and visualization of TCRγδ+ cells, iCdx2ΔAPCTrdcGFP reporter mice were used (I-P). (A-H) Mice were treated with antibiotic mix (ABX) in the drinking water or (I-N) treated twice a week with 400μg of anti-TCRγδ blocking antibody (UC7-13D5) for the last 2 weeks of the experiment. For in vivo quantification of cell proliferation, animals were treated with EdU in the drinking water for one week before analysis. (A, I) Protocol. (B, J) Tumor number, size and load. (C-H, K-N) Flow cytometry analysis of γδ T cells from tumor or non-tumor colonic tissue. (C) Frequency of CD8α+ cells among TCRγδ+ cells. (D) Frequency of PD-1+ and (E) IL-17+ among TCRγδ+ cells. Vγ6+ (purple) vs Vγ6 (orange) contribution to PD-1+ and IL-17–producing γδ T cells is also shown. (F, G) Frequency of EdU incorporation by Vγ6 or Vγ6+ among TCRγδ+ cells. G shows tumor infiltrating cells. (H) Frequency of Vγ4+ (left) and Vγ6+ (right) among TCRγδ+ cells. (K) γδGFP+/TCRαβ ratio among CD45+ cells. (L) Frequency of CD8α+ (left) and PD-1+ (right), and (M) IFN-γ+ (l eft) and IL-17+ (right) among γδGFP+ cells. (N) Frequency of EdU incorporation by PD-1 or PD-1+ among γδGFP+ cells. (O-P) Intravital imaging of colonic γδGFP+ cells. Animals were treated with α-TCRγδ blocking antibody (UC7-13D5) for 1 week before intravital imaging. (O) Representative image of γδGFP+ cells before and 3 weeks after tamoxifen administration. Cells were tracked using Imaris (Bitplane AG) software. (P) Mean speed of individual tracks. Data from iCdx2ΔAPC antibiotic treated (ABX) are representative from 3 independent experiments with 3-4 animals per group. Data from iCdx2ΔAPCTrdcGFP treated with UC7-13D5 are pooled from 3 independent experiments with 3-4 animals per group. Data from intravital imaging is representative of 2 experiments with 2 animals per group. (C-G and K-N) One-way ANOVA with Dunnett’s multiple comparison test; (B, H, J) two-tailed t-test; (P) Kruskal-Wallis test with Benjamin multiple comparison test. For cytokine staining, cells were stimulated with PMA and Ionomycin. Statistical P value differences are indicated. Error bars indicate SEM.
Fig. 5.
Fig. 5.. Redundant tumor–infiltrating IL-17–producing Vγ6+ and Vγ4+ γδ cells promote tumor growth.
(A-L) Female Vγ6−/− and Vγ6+/− littermate control mice were subjected to the AOM-DSS protocol and analyzed 12 weeks after initial AOM injection. In panels G to L, mice received injections of 200μg α-Vγ4 depleting antibody (UC3-10A6) twice a week starting one week after the 2nd DSS cycle (last six weeks of experiment). (A, G) Tumor number, size, and load. Shaded area bounded by dashed lines indicates mean ± SEM of all control C57BL6/J mice analyzed in fig. S3B (AOM+DSS model). (B-F; H-L) Flow cytometry analysis of γδ T cells from tumor or non-tumor colonic tissue. (B, H) TCRγδ/αβ ratio among CD45+ cells from colonic tumor tissue. (C, I) Frequency of Vγ6+ (left) and Vγ4+ (right) and (D, J) CD8α+ (left) and PD-1+ (right) among TCRγδ+ cells. (E, K) Frequency of IFN-γ+ (left) and IL-17+ (right) among TCRγδ+ cells. (F, L) Frequency of tumor-infiltrating Vγ6+ and Vγ4+ among IL-17–producing TCRγδ+ T cells. Data from Vγ6−/− and α-Vγ4-treated Vγ6−/− are pooled from 2 and 3 experiments, respectively, with 3-6 animals per group. For cytokine staining, cells were stimulated with PMA and Ionomycin. Statistical P value differences are indicated. (C-F; I-L) One-way ANOVA with Dunnett’s multiple comparison test; (A, B, G, H) two-tailed t-test. Error bars indicate SEM.

Comment in

References

    1. Ettersperger J et al., Interleukin-15-Dependent T-Cell-like Innate Intraepithelial Lymphocytes Develop in the Intestine and Transform into Lymphomas in Celiac Disease. Immunity 45, 610–625 (2016). - PubMed
    1. Sujino T et al., Tissue adaptation of regulatory and intraepithelial CD4(+) T cells controls gut inflammation. Science 352, 1581–1586 (2016). - PMC - PubMed
    1. Hoytema van Konijnenburg DP et al., Intestinal Epithelial and Intraepithelial T Cell Crosstalk Mediates a Dynamic Response to Infection. Cell 171, 783–794 e713 (2017). - PMC - PubMed
    1. McDonald BD, Jabri B, Bendelac A, Diverse developmental pathways of intestinal intraepithelial lymphocytes. Nature reviews. Immunology 18, 514–525 (2018). - PMC - PubMed
    1. Edelblum KL et al. , gammadelta Intraepithelial Lymphocyte Migration Limits Transepithelial Pathogen Invasion and Systemic Disease in Mice. Gastroenterology 148, 1417–1426 (2015). - PMC - PubMed

MeSH terms

Substances