. 2022 Sep 28;14(664):eabq3059.
doi: 10.1126/scitranslmed.abq3059. Epub 2022 Sep 28.

SARS-CoV-2 infection in hamsters and humans results in lasting and unique systemic perturbations after recovery

Affiliations

SARS-CoV-2 infection in hamsters and humans results in lasting and unique systemic perturbations after recovery

Justin J Frere et al. Sci Transl Med. .

Abstract

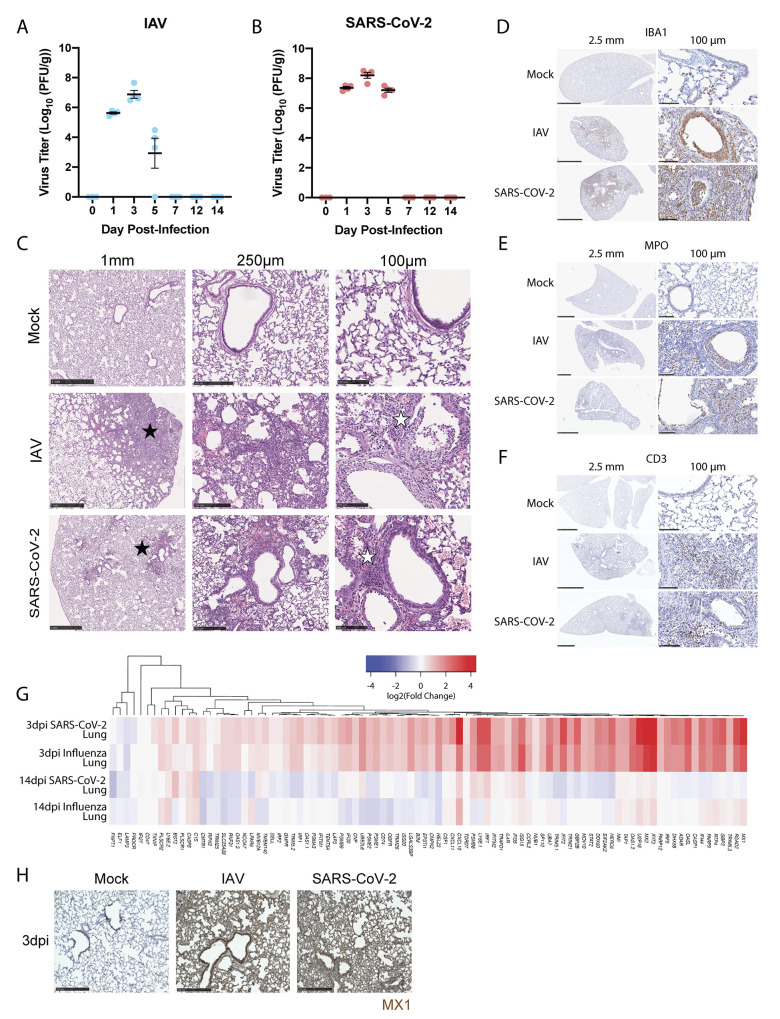
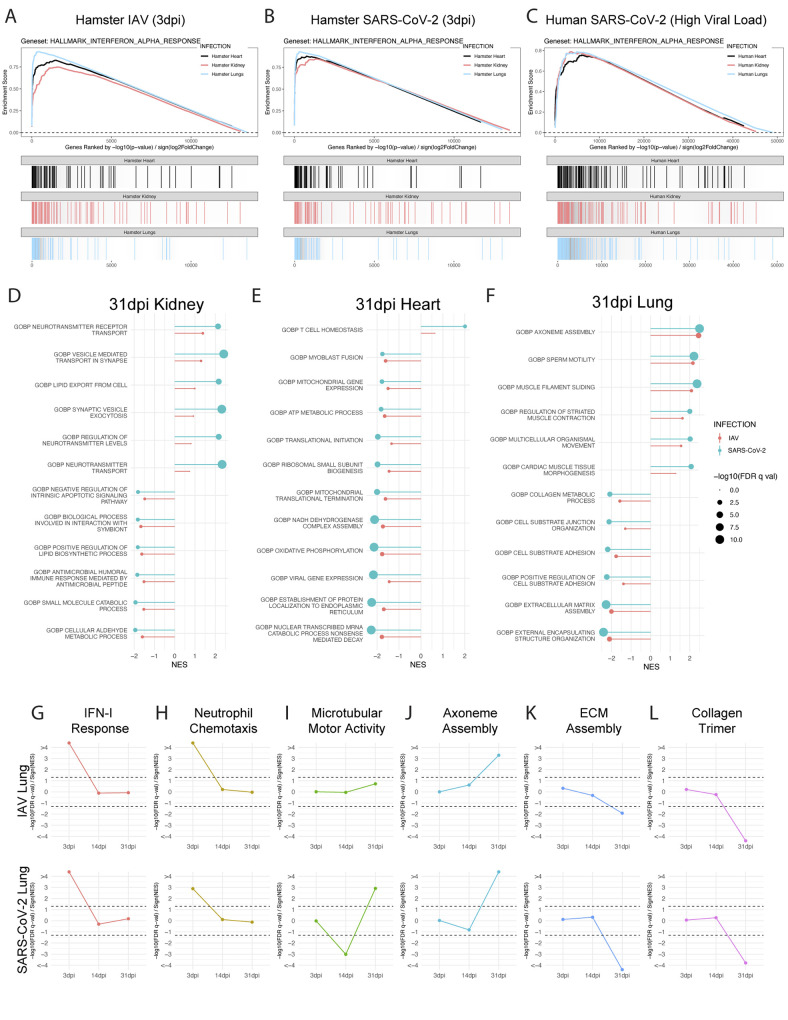
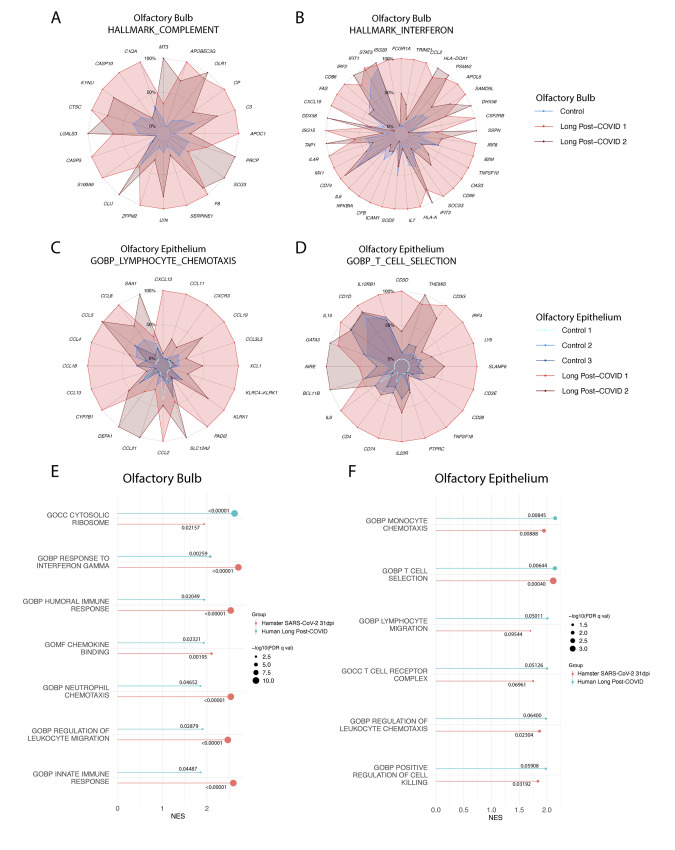
The host response to severe acute respiratory syndrome coronavirus 2 (SARS-CoV-2) infection can result in prolonged pathologies collectively referred to as post-acute sequalae of COVID-19 (PASC) or long COVID. To better understand the mechanism underlying long COVID biology, we compared the short- and long-term systemic responses in the golden hamster after either SARS-CoV-2 or influenza A virus (IAV) infection. Results demonstrated that SARS-CoV-2 exceeded IAV in its capacity to cause permanent injury to the lung and kidney and uniquely affected the olfactory bulb (OB) and olfactory epithelium (OE). Despite a lack of detectable infectious virus, the OB and OE demonstrated myeloid and T cell activation, proinflammatory cytokine production, and an interferon response that correlated with behavioral changes extending a month after viral clearance. These sustained transcriptional changes could also be corroborated from tissue isolated from individuals who recovered from COVID-19. These data highlight a molecular mechanism for persistent COVID-19 symptomology and provide a small animal model to explore future therapeutics.


Figures

Fig. 1.
Fig. 1.
SARS-CoV-2 and IAV infections induce clinically representative lung pathology and are cleared by 14dpi in the hamster model of disease. (A and B) Titer data was computed as plaque forming units per gram (PFU/g) of lung from hamsters infected with (A) IAV (A/California/04/2009) (n=4 per time point) or (B) SARS-CoV-2 (USA/WA1/2020) (n=4 per time point) on days indicated. Day 0 is representative of uninfected hamsters (n=3). (C) H&E staining of hamster lungs exposed to PBS (Mock), IAV, or SARS-CoV-2 at 3dpi is shown. Histological analysis at various magnifications denoting hypercellularity (black star) and infiltrate presence in bronchioles and alveoli (white star). Scale bar size is denoted above the images. (D to F) Immunohistochemical labeling for (D) IBA1, (E) MPO, and (F) CD3 were used to label macrophage, neutrophil, and T cell populations, respectively, in the lungs of mock-, IAV-, and SARS-CoV-2-infected hamsters at 3dpi. Size of inset scale bars matches length described in column headers. (G) RNA-seq of lungs from SARS-CoV-2- and IAV-infected hamsters was evaluated at 3dpi and 14dpi. Heatmap depicting log2 fold-change of IFN-I response genes (derived from HALLMARK_INTERFERON_ALPHA_RESPONSE gene set) compared to mock-infected animals was generated for these groups. (H) Immunohistochemical labeling for the interferon stimulated gene MX1 was assessed in lungs of mock-infected, IAV-infected, or SARS-CoV-2-infected hamsters at 3dpi. Scale bars indicate 250μm length.
Fig. 2.
Fig. 2.
Transcriptional profiling of peripheral organs reveals differences between active or resolved IAV and SARS-CoV-2 infections. (A to C) Lungs (blue), kidneys (red), and hearts (black) of SARS-CoV-2-, IAV-, and mock-treated hamsters were harvested at 3dpi and transcriptionally profiled by RNA-seq. Differential expression analysis was conducted between infected and mock-infected groups with DESeq2 and analyzed by Gene Set Enrichment Analysis (GSEA) for enrichment of indicated gene sets. Enrichment analysis results for all three tissue types are displayed in a GSEA enrichment plot for (A) IAV versus Mock and (B) SARS-CoV-2 versus Mock comparisons. (C) Similar transcriptomic analyses were conducted on RNA-seq data generated from human lung, heart, and kidney samples obtained from the post-mortem tissues of COVID-19-infected and control donors. Results from enrichment analyses are shown as a GSEA enrichment plot. (D to F) Differential expression analysis of RNA-seq data derived from (D) lungs, (E) kidneys, and (F) hearts of SARS-CoV-2-, IAV-, and mock-infected hamsters at 31dpi is shown. Differential expression results were assessed using GSEA to test for enrichment of gene sets present in the MSigDB C5 gene set collection, which contains curated gene sets derived from the Gene Ontology resource. Significant ontological enrichments for SARS-CoV-2 versus Mock differential expression analysis were further processed by REVIGO to remove redundant enrichments. The highest ranked non-redundant positive and negative enrichments for each organ are plotted by their normalized enrichment score (NES) (line magnitude) and significance (-log10(FDR q-value)) (dot size). GSEA enrichment for these same gene sets in IAV versus Mock differential expression data for the same tissue are plotted side-by-side for comparison. (Gene Ontology Biological Process: GOBP) (G to L) GSEA analysis from lung sequencing data from IAV-, SARS-CoV-2, and mock-infected hamster lungs at 3, 14, and 31dpi is shown using curated gene ontology and human phenotype ontology gene sets. Directional significance of enrichment was plotted over time for (G) IFN-I response (GOBP_RESPONSE_TO_TYPE_I_INTERFERON) (H) neutrophil chemotaxis (GOBP_NEUTROPHIL_CHEMOTAXIS) (I) microtubular motor activity (GOMF_ATP_DEPENDENT_MICROTUBULE_MOTOR_ACTIVITY) (J) axoneme assembly (GOBP_AXONEME_ASSEMBLY) (K) extracellular matrix (ECM) assembly (GOBP_EXTRACELLULAR_MATRIX_ASSEMBLY) (L) and collagen trimer-associated genes (GOCC_COLLAGEN_TRIMER). Dotted lines show the calculated statistic for FDR q-val = 0.05 for positive and negative enrichment; thus, any points falling outside the dotted lines have FDR q-val of < 0.05. (GOMF: Gene Ontology Molecular Function; GOCC: Gene Ontology Cellular Component)
Fig. 3.
Fig. 3.
Morphological characterization of lung, heart, and kidney reveal differences in response to SARS-CoV-2 or IAV at 31dpi. (A) H&E staining on lungs of SARS-CoV-2-, IAV-, and mock-infected hamsters at 31dpi is shown. Histological analysis of lungs highlights lambertosis at both low magnification (white stars) and at higher magnification (black stars) as well as residual immune infiltration into lung parenchyma (red stars). (B) H&E staining on kidneys collected from the same infection groups as (A) is shown. Black and red stars denote areas of tubular atrophy and proteinaceous fluid buildup, respectively. (C) Lambertosis and (D) average tubular epithelial size were quantified by morphometric image analysis. Error bars display standard error mean, and significance was quantified using one-way ANOVA with Tukey’s Multiple Comparison Test; *p<0.05, ***p<0.001. For (C), 9 Mock, 10 IAV, and 16 SARS-CoV-2 randomly subsampled images of 31dpi lung tissues were analyzed from lung slides generated from 5 hamsters per treatment condition. For (D), 100 Mock, 100 IAV, and 100 SARS-CoV-2 randomly subsampled images of 3dpi and 31dpi kidney tissues were analyzed from kidney slides generated from 10 hamsters per treatment condition.
Fig. 4.
Fig. 4.
SARS-CoV-2 induces a unique neural transcriptional profile compared to IAV. (A) Schematic of brain regions characterized in response to infection. mPFC, striatum, thalamus, cerebellum, trigeminal ganglion, and olfactory bulb were bilaterally harvested for RNA-seq analysis. (B) Alignment of RNA-seq data to the SARS-CoV-2 genome is shown. Coverage of raw reads over the length of the genome are displayed as a histogram from each brain region noted. (C to H) Volcano plots depict differential expression analysis conducted using samples from the (C) mPFC, (D) striatum, (E) thalamus, (F) cerebellum, (G) trigeminal ganglion, and (H) olfactory bulb of IAV- or SARS-CoV-2-infected hamsters. Samples were compared to mock-infected hamsters at 3dpi and 31dpi using DESeq2; differentially expressed genes with a p-adjusted value of less than 0.1 are plotted (black: p-adj > 0.05, log2 fold-change < 2; blue: p-adj < 0.05, log2 fold-change < 2; green: p-adj > 0.05, log2 fold-change > 2; red: p-adj < 0.05, log2 fold-change > 2). (I) Differential expression data were analyzed by GSEA using curated gene ontology and human phenotype ontology gene sets; significant enrichments for metabolic-, synaptic signaling-, neural plasticity-, and immune-related ontologies are displayed on the dot plot. Coloration designates normalized enrichment score (NES), with positive enrichment scores colored red and negative enrichment scores colored blue. Dot size is scaled to -log10(FDR q-val) of enrichment; only enrichments with an FDR q-val of less than 0.05 were plotted.
Fig. 5.
Fig. 5.
Persistent inflammation in the olfactory bulb and epithelium is observed in response to SARS-CoV-2 infection in hamsters. (A) A heat map is shown denoting differential expression analysis conducted on RNA-seq derived from olfactory bulbs of 3dpi and 31dpi IAV- and SARS-CoV-2-infected hamsters compared to mock-infected hamsters. Log2 fold-change of IFN-I response genes are displayed. (B to F) Expression of key IFN-I response associated genes (B) Isg15, (C) Mx2, and (D) Irf7; chemokines (E) Cxcl10, and (F) Ccl5 were quantified by qRT-PCR (n=4 to 5 per treatment and time point group). Error bars display standard deviation, and significance was determined by independent tests on samples from 3dpi and 31dpi for each gene using one-way ANOVA with Tukey’s multiple comparisons test; *p<0.05, **p<0.01, ***p<0.001, ****p<0.0001. (G) Differential expression data derived from olfactory bulbs of hamsters 31dpi was analyzed by GSEA analysis to deconvolute specific cellular identity signatures. Top positive enrichments are denoted by lollipop chart based on their NES (magnitude of line) and significance (-log10(FDR q-val)) (dot size). (CTX: Cortex; PFC: Prefrontal Cortex) (H) Expression of Aif-1 (also known as Iba1) was quantified by qRT-PCR (n=4 to 5 per treatment and time point group). Error bars display standard deviation, and significance was determined by independent tests on samples from 3dpi and 31dpi for each gene using one-way ANOVA with Tukey’s multiple comparisons test; **p<0.01, ***p<0.001. (I) Concentrations of IAV or SARS-CoV-2 RNA in the olfactory bulbs were measured by qRT-PCR with primers for IAV nucleoprotein (IAV NP) or SARS-CoV-2 subgenomic nucleocapsid protein (SARS-CoV-2 sgN), respectively (n=4 per treatment and time point group). Error bars display standard deviation. (J) Olfactory epithelium samples from mock-, IAV-, or SARS-CoV-2-infected hamsters were harvested and transcriptionally profiled using RNA-seq. Differential expression analysis was conducted on infected groups compared to mock. Log2 Fold Change for expression of individual genes relevant to ontologies concerning IFN-I, chemokine, and T cell activation are presented in the graph for both IAV and SARS-CoV-2 compared to mock; error bars denote standard error.
Fig. 6.
Fig. 6.
Olfactory inflammation is associated with behavioral alteration in hamsters. (A to C) IAV-, SARS-CoV-2, and mock-infected hamsters were assessed for smell at (A) 3dpi, (B) 15dpi, and (C) 28dpi using a buried food finding test (n=6 per treatment group per time point). Kaplan-Meier curves demonstrate time to discovery of food across all time points and infection groups. (D) All infection groups were assessed for behavior at 26dpi using the marble burying assay, a test classically utilized to measure repetitive, obsessive-compulsive, and anxiety-like behavior in rodents. The number of marbles that were greater than 60% buried were counted and graphed for each hamster. P-values plotted above the graph were calculated for pairwise comparisons using an ordinary one-way ANOVA with Fisher’s Least Significant Difference test. Outliers were corrected for using iterative Grubb’s test. n=1 sample was removed from the SARS-CoV-2 group (with outlier removed: n=14 Mock-infected, n=14 IAV-infected, and n=13 SARS-CoV-2-infected hamsters). Error bars indicate standard error mean.
Fig. 7.
Fig. 7.
SARS-CoV-2 infection is associated with sustained inflammatory transcriptional programs in human olfactory bulb and olfactory epithelium. (A and B) Radar plots derived from olfactory bulb tissues collected at autopsy from healthy control donor (Control) (n=1) as well as donors that had previously recovered from clinically documented COVID-19 (long Post-COVID) (n=2). Donors were screened to only include those where COVID-19 positivity was documented greater than 1 month prior to autopsy. Tissues were RNA-sequenced, and Long Post-COVID tissues were compared to control tissues by differential expression analysis. GSEA using the Hallmark Gene sets was utilized to characterize transcriptomic programs. Transcripts per million reads (TPM) counts for individual genes making up these responses were plotted onto radar plots. Gene expression is normalized to the highest expressing sample for each individual gene, with expression shown as the percentage of TPM value of that sample (which is shown as 100% of its own value). (A) Complement and (B) interferon responses were measured. (C and D) Analyses as described in (A) were used to characterize the transcriptional response of olfactory epithelium tissues harvested from Long-Post COVID (n=2) and control donors (n=3), evaluating (C) lymphocyte chemotaxis and (D) T cell selection. (E and F) GSEA enrichment plots from (E) olfactory bulb and (F) olfactory epithelium human tissues were plotted by their NES (magnitude of line) and significance (-log10(FDR q-value)) (size of dot). GSEA enrichments of these same gene sets from analogous tissue analysis in hamsters (SARS-CoV-2-infected versus mock-infected olfactory bulb and epithelium tissues at 31dpi) were plotted beside matching human enrichment data. The numerical FDR q-value of each enrichment is denoted above or below the respective NES line for that gene set.

References

    1. Yuki K., Fujiogi M., Koutsogiannaki S., COVID-19 pathophysiology: A review. Clin. Immunol. 215, 108427 (2020). 10.1016/j.clim.2020.108427 - DOI - PMC - PubMed
    1. Hu B., Guo H., Zhou P., Shi Z. L., Characteristics of SARS-CoV-2 and COVID-19. Nat. Rev. Microbiol. 19, 141–154 (2021). 10.1038/s41579-020-00459-7 - DOI - PMC - PubMed
    1. Wiersinga W. J., Rhodes A., Cheng A. C., Peacock S. J., Prescott H. C., Pathophysiology, Transmission, Diagnosis, and Treatment of Coronavirus Disease 2019 (COVID-19): A Review. JAMA 324, 782–793 (2020). 10.1001/jama.2020.12839 - DOI - PubMed
    1. Zhu N., Zhang D., Wang W., Li X., Yang B., Song J., Zhao X., Huang B., Shi W., Lu R., Niu P., Zhan F., Ma X., Wang D., Xu W., Wu G., Gao G. F., Tan W.; China Novel Coronavirus Investigating and Research Team , A Novel Coronavirus from Patients with Pneumonia in China, 2019. N. Engl. J. Med. 382, 727–733 (2020). 10.1056/NEJMoa2001017 - DOI - PMC - PubMed
    1. Bhopal S. S., Bhopal R., Sex differential in COVID-19 mortality varies markedly by age. Lancet 396, 532–533 (2020). 10.1016/S0140-6736(20)31748-7 - DOI - PMC - PubMed

Publication types