. 2023 Mar;19(3):984-999.
doi: 10.1080/15548627.2022.2100105. Epub 2022 Jul 20.

Lack of COL6/collagen VI causes megakaryocyte dysfunction by impairing autophagy and inducing apoptosis

Affiliations

Lack of COL6/collagen VI causes megakaryocyte dysfunction by impairing autophagy and inducing apoptosis

Vittorio Abbonante et al. Autophagy. 2023 Mar.

Abstract

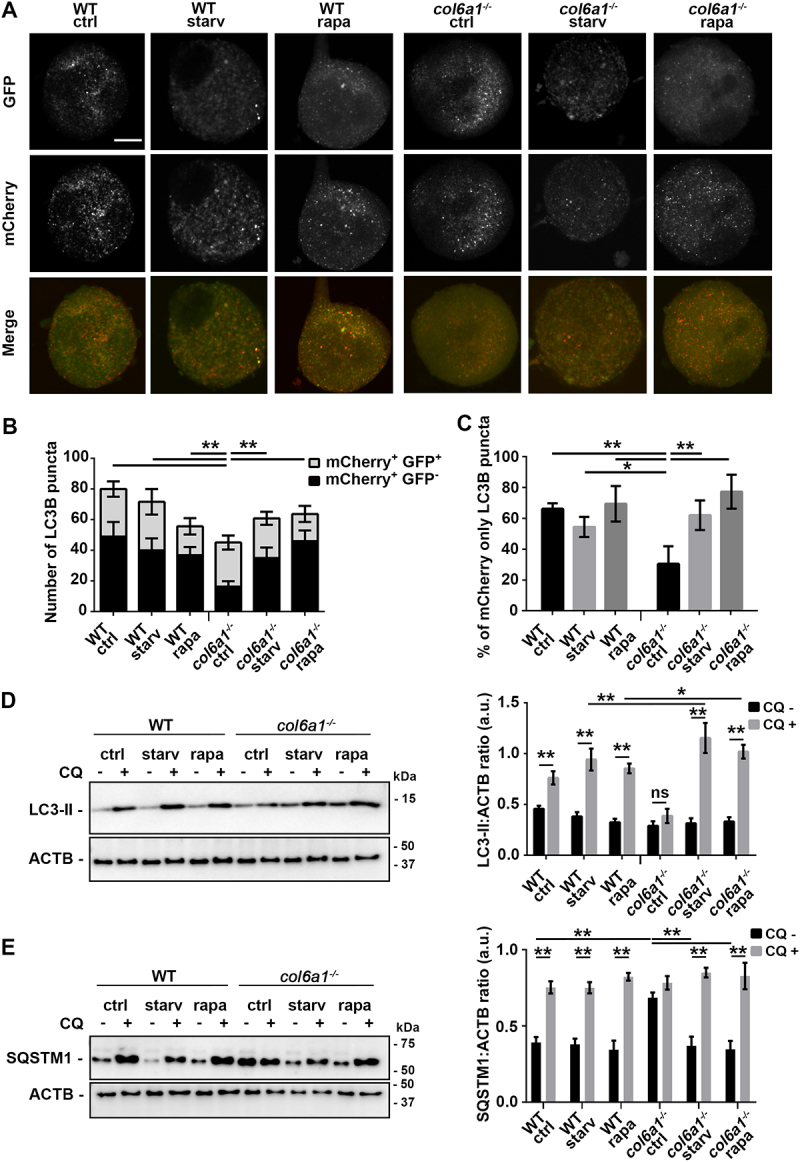
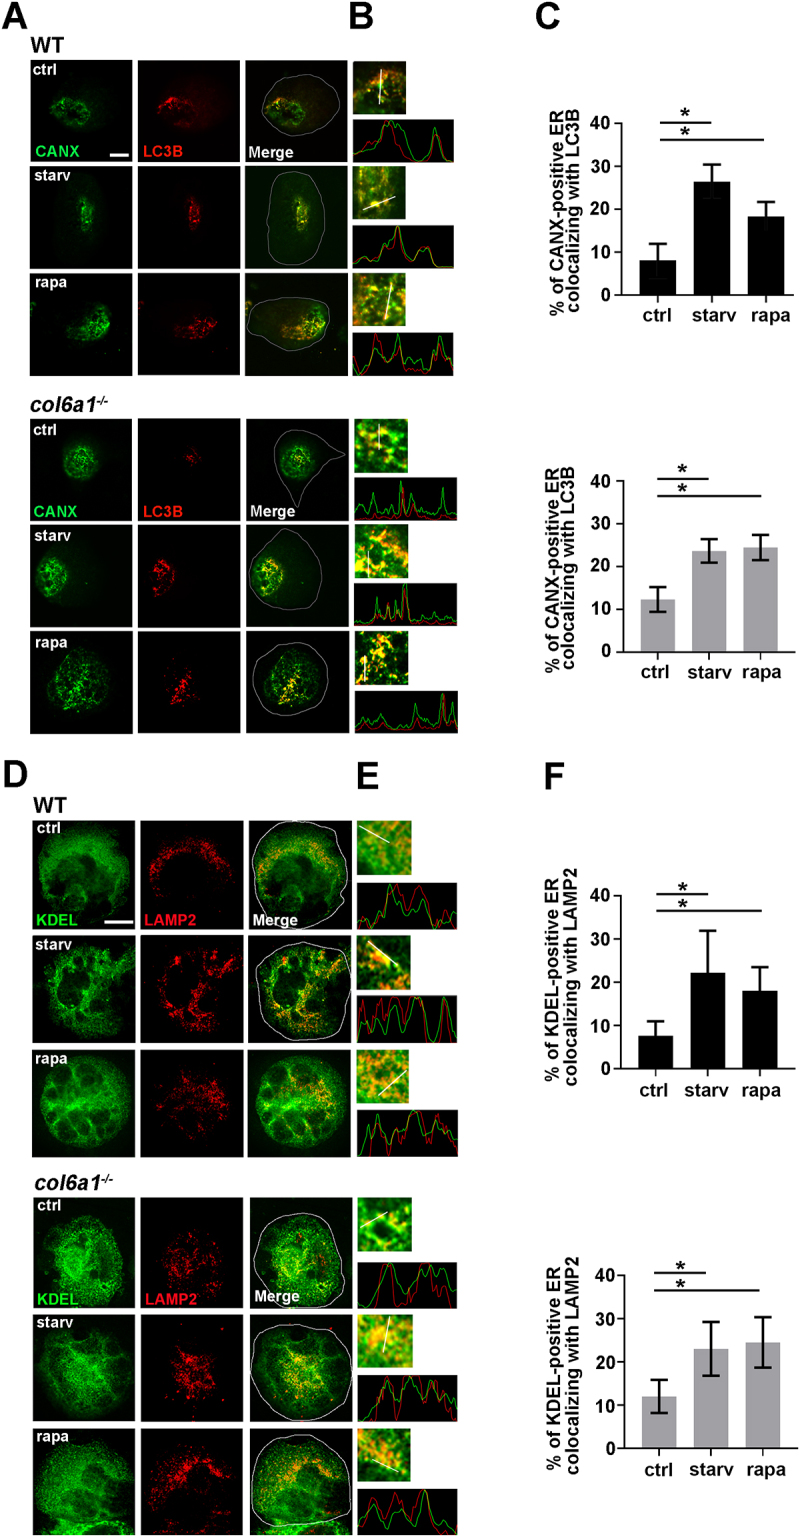
Endoplasmic reticulum stress is an emerging significant player in the molecular pathology of connective tissue disorders. In response to endoplasmic reticulum stress, cells can upregulate macroautophagy/autophagy, a fundamental cellular homeostatic process used by cells to degrade and recycle proteins or remove damaged organelles. In these scenarios, autophagy activation can support cell survival. Here we demonstrated by in vitro and in vivo approaches that megakaryocytes derived from col6a1-⁄- (collagen, type VI, alpha 1) null mice display increased intracellular retention of COL6 polypeptides, endoplasmic reticulum stress and apoptosis. The unfolded protein response is activated in col6a1-⁄- megakaryocytes, as evidenced by the upregulation of molecular chaperones, by the increased splicing of Xbp1 mRNA and by the higher level of the pro-apoptotic regulator DDIT3/CHOP. Despite the endoplasmic reticulum stress, basal autophagy is impaired in col6a1-⁄- megakaryocytes, which show lower BECN1 levels and reduced autophagosome maturation. Starvation and rapamycin treatment rescue the autophagic flux in col6a1-⁄- megakaryocytes, leading to a decrease in intracellular COL6 polypeptide retention, endoplasmic reticulum stress and apoptosis. Furthermore, megakaryocytes cultured from peripheral blood hematopoietic progenitors of patients affected by Bethlem myopathy and Ullrich congenital muscular dystrophy, two COL6-related disorders, displayed increased apoptosis, endoplasmic reticulum stress and impaired autophagy. These data demonstrate that genetic disorders of collagens, endoplasmic reticulum stress and autophagy regulation in megakaryocytes may be interrelated.Abbreviations: 7-AAD: 7-amino-actinomycin D; ATF: activating transcriptional factor; BAX: BCL2 associated X protein; BCL2: B cell leukemia/lymphoma 2; BCL2L1/Bcl-xL: BCL2-like 1; BM: bone marrow; COL6: collagen, type VI; col6a1-⁄-: mice that are null for Col6a1; DDIT3/CHOP/GADD153: DNA-damage inducible transcript 3; EGFP: enhanced green fluorescent protein; ER: endoplasmic reticulum; reticulophagy: endoplasmic reticulum-selective autophagy; HSPA5/Bip: heat shock protein 5; HSP90B1/GRP94: heat shock protein 90, beta (Grp94), member 1; LAMP2: lysosomal associated membrane protein 2; MAP1LC3B/LC3B: microtubule-associated protein 1 light chain 3 beta; Mk: megakaryocytes; MTOR: mechanistic target of rapamycin kinase; NIMV: noninvasive mechanical ventilation; PI3K: phosphoinositide 3-kinase; PPP1R15A/GADD34: protein phosphatase 1, regulatory subunit 15A; RT-qPCR: reverse transcription-quantitative real-time PCR; ROS: reactive oxygen species; SERPINH1/HSP47: serine (or cysteine) peptidase inhibitor, clade H, member 1; sh-RNA: short hairpin RNA; SOCE: store operated calcium entry; UCMD: Ullrich congenital muscular dystrophy; UPR: unfolded protein response; WIPI2: WD repeat domain, phosphoinositide-interacting 2; WT: wild type; XBP1: X-box binding protein 1.

Keywords: Apoptosis; autophagy; collagen VI; endoplasmic reticulum stress; megakaryocytes; rapamycin; unfolded protein response.


Conflict of interest statement

No potential conflict of interest was reported by the author(s).

Figures

Figure 1.
Figure 1.
Endoplasmic reticulum stress in col6a1−⁄− Mks. (A) RT-qPCR quantification of the mRNA levels for different UPR markers of in vitro differentiated WT and col6a1−⁄− Mks. Values for WT Mks were arbitrarily set to 1. Data are expressed as mean ± SD (n = 7). (B) PCR analysis of Xbp1 mRNA splicing in WT and col6a1−⁄− Mks. Quantification of the spliced (Xbp1s) vs. unspliced (Xbp1u) transcript forms is shown in the right panel. B2m (beta-2 microglobulin) transcript was used as a loading control. Data are expressed as mean ± SD (n = 3). (C) RT-qPCR quantification of the UPR signature in BM-sorted WT and col6a1−⁄− Mks. Levels of the different transcripts are shown as relative to WT Mks. Data are expressed as mean ± SD (n = 3). (D and E) Western blotting for key transcription factors and molecular chaperones of the UPR in WT and col6a1−⁄− Mks. ACTB/β-actin was used as a loading control. Densitometric quantifications, normalized on ACTB, are shown in panel E. Values for WT Mks were arbitrarily set to 1. Data are expressed as mean ± SD (n = 4). (F) Representative images of confocal microscopy for the ER marker CANX (gray) in WT and col6a1−⁄− Mks. Nuclei were counterstained with Hoechst (blue). Scale bar: 20 μm. (G) Transmission electron micrograph showing enlarged ER in col6a1−⁄− Mks but not in WT (black arrows). Scale bar: 500 nm. (H) Percentage of Mks with expanded ER (left panel) and percentage of ER area coverage (right panel), as quantified from confocal microscopy images. A minimum of 40 Mks per sample was analyzed. Data are expressed as mean SD (n = 4). *, P < 0.05; **, P < 0.01; a.u., arbitrary units.
Figure 2.
Figure 2.
Intracellular COL6 accumulation in col6a1−⁄− Mks. (A) Confocal microscopy immunofluorescence of WT and col6a1−⁄− Mks stained with a polyclonal antibody for COL6 (AS72, red) and with a monoclonal antibody for ITGA2B/CD41 (green). Where indicated, Mks were grown for 48 h in the presence of 50 μg/mL ascorbic acid. Scale bar: 10 μm. (B) Western blotting for the COL6A2/α2(VI) chain in cell lysates and cell culture media of WT and col6a1−⁄− Mks cultured for 48 h in the presence of 50 μg/mL ascorbic acid. ACTB/β-actin was used as a loading control. The right panel shows densitometric quantification, normalized on ACTB. Values for WT Mks were arbitrarily set to 1. Data are expressed as mean ± Standard Deviation (SD) (n = 4). **, P < 0.01. a.u., arbitrary units.
Figure 3.
Figure 3.
Insufficient basal autophagy activation in col6a1−⁄− Mks. (A) Representative confocal microscopy images of WT and col6a1−⁄− Mks expressing the tandem mCherry-EGFP-LC3B construct in standard culture conditions. Scale bar: 50 μm. (B) Quantification of the number of LC3B puncta per cell area. (C) Quantification of the percentage of mCherry-only positive puncta in WT and col6a1−⁄− Mks. A minimum of 40 Mks per sample was analyzed. Data are expressed as mean ± SD (n = 7). (D) Western blotting of LC3B lipidation (LC3-II) in WT and col6a1−⁄− Mks. Where indicated, Mks were treated for 4 h with 50 μM of the lysosome inhibitor chloroquine (CQ). ACTB/β-actin was used as a loading control. Densitometric quantification of the LC3-II:ACTB ratio is shown in the right panel. Data are expressed as mean ± SD (n = 4). (E) Western blotting of SQSTM1/p62 accumulation-degradation in WT and col6a1−⁄− Mks. Where indicated, Mks were treated for 4 h with 50 μM of the lysosome inhibitor chloroquine (CQ). ACTB was used as a loading control. Densitometric quantification of the SQSTM1:ACTB ratio is shown in the right panel. Data are expressed as mean ± SD (n = 4). *, P < 0.05; **, P < 0.01; a.u., arbitrary units.
Figure 4.
Figure 4.
Col6a1−⁄− Mks and platelets display increased apoptosis in vitro and in vivo. (A and B) Representative flow cytometry of WT and col6a1−⁄− BM flushes stained for ITGA2B/CD41, ANXA5/annexin V and 7-AAD. ITGA2B/CD41+ Mks were gated and analyzed for ANXA5/annexin V surface expression and 7-AAD staining. Data are expressed as mean ± SD (n = 5). (C and D) Western blotting for BAX, BCL2 and BCL2L1/Bcl-xL protein levels in WT and col6a1−⁄− Mks. ACTB/β-actin was used as a loading control. Densitometric quantification of the BAX:BCL2L1 ratio (D, left panel) and of the BAX:BCL2 ratio (D, right panel) are shown. Data are expressed as mean ± SD (n = 4). (E and F) Representative flow cytometry for ITGA2B/CD41 and ANXA5/annexin V in peripheral blood platelets from WT and col6a1−⁄− mice. The percentage of ANXA5/annexin V+ ITGA2B/CD41+ platelets is shown in the right panel. Data are expressed as mean ± SD (n = 4). (G H) Western blotting for BAX, BCL2 and BCL2L1/Bcl-xL protein levels in WT and col6a1−⁄− peripheral blood platelets. ACTB/β-actin was used as a loading control. Densitometric quantification of the BAX:BCL2L1 ratio (H, left panel) and of the BAX:BCL2 ratio (H, right panel) are shown. Data are expressed as mean ± SD (n = 3). ***, P < 0.001, **, P < 0.01; *, P < 0.05; a.u., arbitrary units.
Figure 5.
Figure 5.
Starvation and rapamycin treatment rescue autophagy activation in col6a1−⁄− Mks. (A) Representative images of confocal microscopy WT and col6a1−⁄− Mks expressing the tandem mCherry-EGFP-LC3B construct unDer Standard culture conditions and upon 4 h serum starvation or 100 nM rapamycin treatment. Scale bar: 10 μm. (B) Quantification of LC3B-tagged puncta per cell area in WT and col6a1−⁄− Mks. (C) Quantification of the percentage of mCherry-only positive puncta in WT and col6a1−⁄− Mks. A minimum of 40 Mks per sample was analyzed. Data are expressed as mean ± SD (n = 4). (D) Western blotting for LC3B lipidation (LC3-II) in WT and col6a1−⁄− Mks unDer Standard culture conditions (ctrl) and upon 4 h serum starvation or 100 nM rapamycin treatment. Where indicated, Mks were treated for 4 h with 50 μM of the lysosome inhibitor chloroquine (CQ). Densitometric quantification of the LC3-II:ACTB ratio is shown in the right panel. Data are expressed as mean ± SD, (n = 4). (E) Western blotting for SQSTM1/p62 accumulation-degradation in WT and col6a1−⁄− Mks unDer Standard culture conditions (ctrl) and upon 4 h serum starvation or 100 nM rapamycin treatment. Where indicated, Mks were treated for 4 h with 50 μM of the lysosome inhibitor chloroquine (CQ). Densitometric quantification of the SQSTM1:ACTB ratio is shown in the right panel. Data are expressed as mean ± SD, (n = 4). *, P < 0.05; **, P < 0.01. n.s., not significant; rapa, rapamycin; starv, serum starvation; a.u., arbitrary units.
Figure 6.
Figure 6.
ER colocalization with LC3B-positive autophagosomes and LAMP2-positive lysosomes in WT and col6a1−⁄− Mks. (A) Representative confocal laser microscopy images of WT and col6a1−⁄− Mks maintained in standard culture conditions (ctrl) or cultured for 6 h in serum starved conditions (starv) or in the presence of 100 nM rapamycin (rapa), following labeling with anti-LC3B (red) and anti-CANX (green) antibodies. Scale bar: 10 μm. (B) The white line indicates the segment used for line scan analysis of colocalization. The line scan shows colocalization between autophagosomes (LC3B, red line) and the ER (CANX, green line). (C) Quantification of the percentage of CANX-positive ER colocalizing with LC3B. A minimum of 40 Mks per sample was analyzed. Data are expressed as mean ± SD (n = 3). *, P < 0.05. (D) Representative confocal laser microscopy images of WT and col6a1−⁄− Mks cultured as in A, following labeling with anti-LAMP2 (red) and anti-KDEL (green) antibodies. Scale bar: 10 μm. (E) The white line indicates the segment used for line scan analysis of colocalization. The line scan shows colocalization between lysosomes (LAMP2, red line) and the ER (KDEL, green line). (F) Quantification of the percentage of KDEL-positive ER colocalizing with LAMP2. A minimum of 40 Mks per sample was analyzed. Data are expressed as mean ± SD (n = 3). *, P < 0.05.
Figure 7.
Figure 7.
Starvation and rapamycin treatment rescue intracellular COL6 retention, ER stress and apoptosis in col6a1−⁄− Mks. (A and B) Representative confocal microscopy of COL6 immunofluorescence (red) in WT and col6a1−⁄− Mks. Where indicated, col6a1−⁄− Mks were cultured for 6 h in serum-starved conditions or in the presence of 100 nM rapamycin. Staining densities were quantified and expressed relative to WT Mks. Values for WT cells in standard culture conditions were arbitrarily set to 1. Data are expressed as mean ± SD (n = 3). Scale bar: 10 μm. (C) RT-qPCR quantification of the mRNA levels for different UPR markers on in vitro differentiated WT and col6a1−⁄− Mks upon 6 h serum starvation or 100 nM rapamycin treatments. Levels of the different transcripts after serum starvation or rapamycin treatment are expressed relative to standard culture conditions (ctrl). Data are expressed as mean ± SD (n = 3). (D) PCR analysis of Xbp1 spliced (Xbp1s) and unspliced (Xbp1u) transcript isoforms in WT and col6a1−⁄− Mks in the absence or presence of 100 nM rapamycin treatment for 6 h. B2m (beta-2 microglobulin) transcript was used as loading control. (E) Western blotting for key transcription factors and molecular chaperones of the UPR in WT and col6a1−⁄− Mks in standard culture conditions (ctrl) and upon 6 h serum starvation or 100 nM rapamycin treatment. ACTB/β-actin was used as loading control. (F) Transmission electron micrograph showing ER morphology in WT and col6a1−⁄− Mks treated or not with 100 nM rapamycin for 8 h (white arrows). Scale bar: 500 nm. (G) Western blotting for BAX, BCL2 and BCL2L1/Bcl-xL in WT and col6a1−⁄− Mks in standard culture conditions (ctrl) and upon 6 h serum starvation or 100 nM rapamycin treatment. ACTB/β-actin was detected as loading control. The right panels show densitometric quantification of the BAX:BCL2L1 ratio (H) and of the BAX:BCL2 ratio (I). Data are expressed as mean ± SD (n = 3). (J) Percentage of 7-AAD-positive cells, as determined by flow cytometry analysis of 7-AAD staining in WT and col6a1−⁄− Mks treated or not for 48 h with 100 nM rapamycin. Data are expressed as mean ± SD (n = 4). (K and L) RT-qPCR quantification of the UPR and autophagy signatures in BM-sorted Mks obtained from col6a1−⁄− mice maintained unDer Standard housing conditions or following in vivo administration of rapamycin (2 mg/kg body weight) for 14 days. For each transcript, data are given as the ratio of its respective levels in rapamycin-treated vs. untreated mice. Data are expressed as mean ± SD (n = 3). *, P < 0.05; **, P < 0.01; a.u., arbitrary units; rapa, rapamycin; starv, serum starvation.
Figure 8.
Figure 8.
Mks derived from patients affected by COL6-related disorders display increased apoptosis, endoplasmic reticulum stress and defective autophagy. (A) RT-qPCR quantification of the UPR signature in in vitro differentiated Mks derived from healthy subjects (HS) and Bethlem myopathy/UCMD patients (p). Data are expressed as mean ± SD (n = 3 HS; n = 4 P). (B and C) Quantitative capillary-based gel electrophoresis with the indicated antibodies. Representative data are displayed as blots (B) and as quantified peak areas (C) Data are expressed as mean ± SD (n = 3 HS; n = 3 P). 5 F, 1 F and 2 M acronyms refers to patient as described in Fig. S8. (D) Representative images of confocal microscopy analysis of the ER marker KDEL (gray) in Mks derived from healthy subjects (HS) and Bethlem myopathy/UCMD patients (P). Nuclei were counterstained with Hoechst. Scale bar: 10 μm. The percentage of Mks with expanded ER (top panel) and the percentage of ER area coverage (bottom panel), as determined from confocal microscopy analysis, are shown on the right. A minimum of 30 Mks per sample was analyzed. Data are expressed as mean ± SD (n = 3 HS; n = 4 P). (E) Representative confocal microscopy images for LC3B (red) in Mks derived from healthy subjects (HS) and Bethlem myopathy/UCMD patients (P) unDer Standard culture conditions (CQ -) or following treatment for 4 h with 50 μM chloroquine (CQ +). Nuclei were counterstained with Hoechst. Scale bar: 10 μm. The right panel shows the number of LC3B puncta per cell area. Data are expressed as mean ± SD (n = 3 HS; n = 4 P). (F) Percentages of apoptotic and necrotic ITGA2B/CD41+ Mks from healthy subjects (HS) and Bethlem myopathy/UCMD patients (P), as determined by flow cytometry. ITGA2B/CD41+ Mks were gated and analyzed for ANXA5/annexin V surface expression and 7-AAD staining. Data are expressed as mean ± SD (n = 3 HS; n = 4 P). (G) Percentages of apoptotic ITGA2B/CD41+ peripheral blood platelets (Plt) from healthy subjects (HS) and Bethlem myopathy/UCMD (P), as determined by flow cytometry. Data are expressed as mean ± SD (n = 5 HS; n = 5 P). *, P < 0.05; **P < 0.01; n.s., not significant.

References

    1. Rutkowski DT, Hegde RS.. Regulation of basal cellular physiology by the homeostatic unfolded protein response. J Cell Biol. 2010. May 31;189(5):783–794. - PMC - PubMed
    1. Hetz C. The unfolded protein response: controlling cell fate decisions under ER stress and beyond. Nat Rev Mol Cell Biol. 2012. Jan 18;13(2):89–102. - PubMed
    1. Urra H, Dufey E, Lisbona F, et al. When ER stress reaches a dead end. Biochim Biophys Acta. 2013. Dec;1833(12):3507–3517. - PubMed
    1. Sano R, Reed JC. ER stress-induced cell death mechanisms. Biochim Biophys Acta. 2013. Dec;1833(12):3460–3470. - PMC - PubMed
    1. Senft D, Ronai ZA. UPR, autophagy, and mitochondria crosstalk underlies the ER stress response. Trends Biochem Sci. 2015. Mar;40(3):141–148. - PMC - PubMed

Publication types

Substances

Supplementary concepts