. 2022 Jul 19;119(29):e2117090119.
doi: 10.1073/pnas.2117090119. Epub 2022 Jul 12.

Specialization of the photoreceptor transcriptome by Srrm3-dependent microexons is required for outer segment maintenance and vision

Affiliations

Specialization of the photoreceptor transcriptome by Srrm3-dependent microexons is required for outer segment maintenance and vision

Ludovica Ciampi et al. Proc Natl Acad Sci U S A. .

Abstract

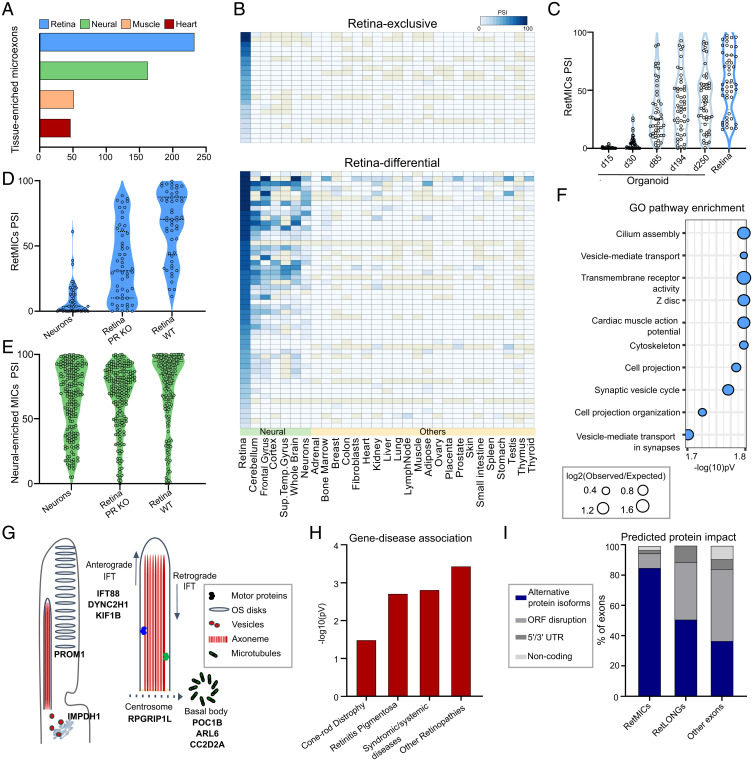
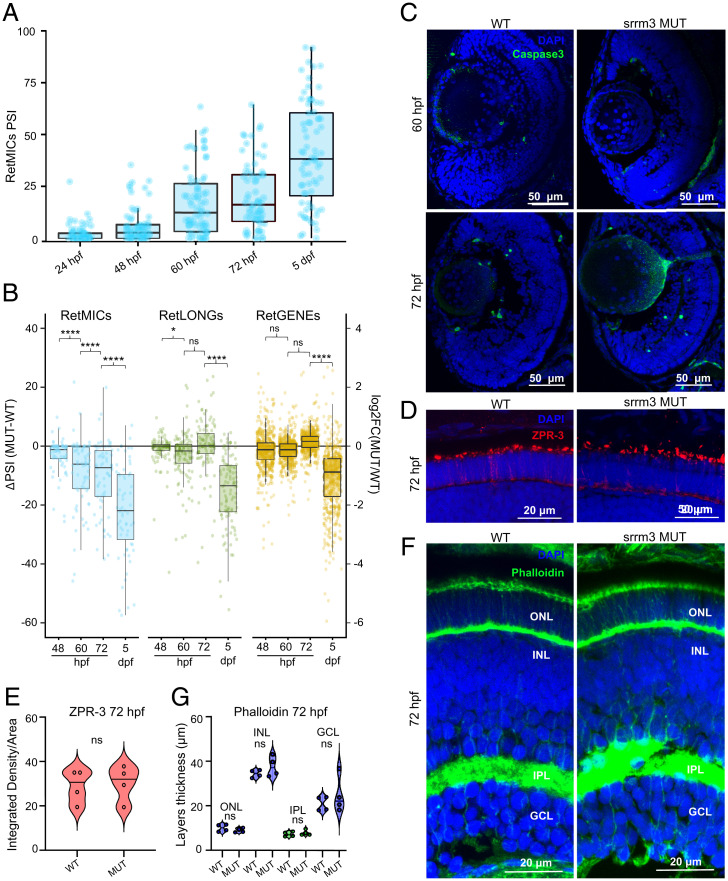
Retinal photoreceptors have a distinct transcriptomic profile compared to other neuronal subtypes, likely reflecting their unique cellular morphology and function in the detection of light stimuli by way of the ciliary outer segment. We discovered a layer of this molecular specialization by revealing that the vertebrate retina expresses the largest number of tissue-enriched microexons of all tissue types. A subset of these microexons is included exclusively in photoreceptor transcripts, particularly in genes involved in cilia biogenesis and vesicle-mediated transport. This microexon program is regulated by Srrm3, a paralog of the neural microexon regulator Srrm4. Despite the fact that both proteins positively regulate retina microexons in vitro, only Srrm3 is highly expressed in mature photoreceptors. Its deletion in zebrafish results in widespread down-regulation of microexon inclusion from early developmental stages, followed by other transcriptomic alterations, severe photoreceptor defects, and blindness. These results shed light on the transcriptomic specialization and functionality of photoreceptors, uncovering unique cell type-specific roles for Srrm3 and microexons with implications for retinal diseases.

Keywords: alternative splicing; retinal disease model; zebrafish.


Conflict of interest statement

The authors declare no competing interest.

Figures

Fig. 1.
Fig. 1.
Characterization and identification of the human RetMIC program. (A) Number of tissue-enriched microexons by tissue type in humans. Only the four tissues with the highest number of tissue-enriched microexons are depicted. (B) Heatmap showing RetMIC inclusion in different human tissues. RetMICs are divided into retina-exclusive (inclusion only in retina samples) and retina-enriched (biased inclusion in retina compared to neural samples). Each row corresponds to a different microexon. Inclusion levels were obtained from VastDB (23). (C) Inclusion levels (PSIs) of RetMICs in cone-rich human organoids (SRP056957) and whole retina. Developing organoid time points: day 15 (d15), day 30 (d30), day 85 (d85), day 194 (d194), and day 250 (d250). Data plotted are averaged PSIs of three biological replicates; events with NA values due to insufficient read coverage were omitted. (D and E) Violin plots depicting inclusion levels of mouse RetMICs (D) and neural-enriched microexons (neural MICs) (E) in hippocampal neurons, WT and Aipl1 KO retinae (data from SRP068974). Events with insufficient read coverage were omitted. (F) Top 10 enriched GO terms for human RetMIC-containing genes. P values are false-discovery rate (FDR)-adjusted. (G) Schematic representation of the OS and localization of selected RetMIC genes; IFT, intraflagellar transport. (H) Enrichment of RetMIC-containing genes among loci associated with different retinal diseases. P values from hypergeometric tests. Complete inputs and results are provided in Dataset S3. (I) Predicted protein impact of different exon types as annotated in VastDB.
Fig. 2.
Fig. 2.
Evolutionary study of RetMICs. (A) Number of tissue-enriched microexons (as in Fig. 1A) in mouse, chicken, and zebrafish. Only the four tissues with the highest number of tissue-enriched microexons are represented. (B) Genomic conservation of human RetMICs (full color, left bar) and human RetLONGs (transparent color, right bar) in mouse, chicken, and zebrafish. Human RetMICs/RetLONGs are considered genomically conserved in another species when they belong to an exon orthogroup including at least one exon from that species. Asterisks indicate significant differences between RetMICs and RetLONGs conservation (P < 0.05, hypergeometric test). (C) Heatmap showing the bias in retina inclusion for genomically conserved human RetMICs (top row) and their respective orthologs in mouse, chicken, and zebrafish. Each column corresponds to a different RetMIC, and the color represents the ΔPSI between the average of the retina samples and of all the other tissues, with darker blue reflecting greater retina inclusion bias. In case of multiple orthologs, only the one with the highest ΔPSI (retina − others) was plotted. Blanks and ivory rectangles indicate missing orthologs and missing ΔPSI values due to lack of read coverage, respectively. (D) Dot plot representing functional enrichment of RetMIC-containing genes across species. The functional enrichment of genes containing RetMICs was separately tested for each of the species, and significant categories in at least two species (FDR-adjusted P ≤ 0.05) were plotted. The color reflects the adjusted P value, with yellow color depicting P ≥ 0.05. The size of the dots is proportional to the log2 of the observed vs. expected ratio (O/E), and black borders around the categories highlight log2 O/E ≥ 1. PMD, plasma membrane bounded.
Fig. 3.
Fig. 3.
Regulation of RetMICs by MSI1, SRRM3, and SRRM4. (A) Inclusion levels (using the PSI metric) of RetMICs in HEK293 cells ectopically expressing SRRM3, SRRM4, and MSI1. EV, empty vector. PSIs are quantified using vast-tools on RNA-seq data from cells 24 h postinduction with 1 µg/mL doxycycline; ****P < 0.0001 Wilcoxon test; ns: not significant. (B) RT-PCR assays showing the inclusion of RetMICs (CKAP5, ARL6, IMPDH1, PROM1, DYNC2H1, and CC2D2A), a RetLONG (MBD1), and a known MSI1-dependent exon (TAB3) in HEK293 cell lines upon ectopic expression of SRRM3, SRRM4, and MSI1. PSI levels quantified using ImageJ are shown below each gel. (C) Percent of retina-enriched exons by length group that showed substantial up-regulation (ΔPSI > 15) upon SRRM3/4 (dark gray) or MSI1 (gray) expression in at least one experiment. (D) RNA maps of SRRM3/4 and MSI1 associated binding motifs in the regions surrounding retina-enriched exons by length group and 1,000 random exons used as a control set. For simplicity, only the relevant upstream (SRRM3/4) or downstream (MSI1) introns are shown (full maps shown in SI Appendix, Fig. S8). Regions with a significant difference (FDR < 0.05) in motif coverage in the tested exon group with respect to the random exons are marked by thicker lines. Sliding window = 27 bp. (E) Srrm3 and Srrm4 gene expression levels (using the cRPKM metric) across mouse developing rods (data from VastDB). Expression levels are normalized to the stage with the highest cRPKM value for each gene.
Fig. 4.
Fig. 4.
srrm3 depletion in zebrafish causes early lethality and RetMIC down-regulation. (A) Genotype distribution for surviving larvae at different time points from in-crosses of srrm4+/−, srrm3+/−, or srrm4−/−;srrm3+/− (double mutants) fish. (B) Genotype distribution for surviving larvae at 13 dpf from a srrm3+/− in-cross in dark and control light conditions. For both A and B, the number of animals per genotype and time-point is indicated in the plots. (C) Enriched biological process GO terms for genes down-regulated in srrm3 homozygous mutants (MUT) eyes at 5 dpf [log2FC(MUT/WT) ≤ −1.5]. GO terms are grouped by ClueGO into three networks according to their GO groups. GO groups are highlighted using three different arbitrary colors, as listed in Dataset S9. P values are corrected with Bonferroni step down. (D) Change in inclusion levels [ΔPSI (MUT-WT)] quantified using vast-tools for all exons shorter than 300 bp with sufficient read coverage in WT and srrm3 MUT eyes at 5 dpf. Blue/green dots correspond to RetMICs and RetLONGs, respectively. (E) Density plots for ΔPSI distributions of RetMICs, RetLONGs, and other alternative exons (10 < PSI < 90 in WT and MUT at 5 dpf) (P = 8.0e-5; Wilcoxon rank-sum test).
Fig. 5.
Fig. 5.
PR degeneration and visual impairment in srrm3 mutants. (AF) ZPR-3 staining in WT (A and D) and srrm3 homozygous mutants (MUT) (B and E) siblings at 5 and 10 dpf. Arrows show rhodopsin mislocalization. n = 5 for 5 dpf and n = 3 for 10 dpf fish. Quantifications of the ZPR-3+ area are provided for 5 dpf (C) and 10 dpf (F). P values from unpaired t tests. (G) Phalloidin staining in WT and srrm3 MUT retinae. The violin plot shows a thickness analysis for different retina layers: inner nuclear layer (INL), inner plexiform layer (IPL), and ganglion cell layer (GCL); n = 6. P values from unpaired t tests. (HJ) Electron microscopy images show absence of OSs or a dramatic OS length decrease in eyes of both srrm3 MUT (I) and DMUT (J) compared to WT ones (H) at 5 dpf; n = 2 for all the genotypes. Further magnification in the Lower panels (HJ) revealed smaller mitochondria (asterisks indicate mitochondria in fission process) and enlarged interphotoreceptor space (ips), quantified as mean of mitochondria area per field and interphotoreceptor space area normalized on field area, represented as fold-change (FC) in K and L, respectively. P values from one-way ANOVA tests with Tukey post hoc analyses. (Scale bars, 2 μm, Upper, and 1 μm, Lower.) n ≥ 4 eyes per genotype; n ≥ 13 fields per genotype were analyzed. (M) Caspase3 staining and associated quantifications in 5 dpf retina sections. n = 4 for each genotype. (N) Averaged ERG b-wave amplitudes from WT, srrm3 HET, and srrm3 MUT, or srrm3 MUT and DMUT at 5 dpf upon different light stimuli (1%, 10%, and 100%). All recordings were done in two independent experiments. n = 20 for WT, n = 34 for srrm3 HET, n = 17 for srrm3 MUT (N), n = 22 for srrm3 MUT (O), and n = 15 for DMUT. P values from one-way ANOVA tests. Error bars correspond to the SEM. Significance code for all tests: ****P = 0; ***, 0 < P < 0.001; **, 0.001 ≤ P < 0.01; *, 0.01 ≤ P < 0.05.
Fig. 6.
Fig. 6.
Transcriptomic and morphological alterations of srrm3 mutants throughout development. (A) Inclusion levels (PSIs) of RetMICs in WT zebrafish heads at 24 hpf and eyes at 48 hpf, 60 hpf, 72 hpf, and 5 dpf. (B) Box plots showing the distribution of changes in inclusion levels for RetMICs and RetLONGs [ΔPSI (MUT-WT)] (left y axis) and in expression levels for RetGENEs [log2FC(MUT/WT)] (right y axis) in WT and srrm3 MUT eyes at different time points. Only exons with sufficient read coverage across all conditions are shown. P values from paired one-tailed Wilcoxon tests. (C) Caspase3 staining for WT and srrm3 MUT retinae at 60 hpf and 72 hpf; n = 4 for all genotypes and conditions. (D and E) ZPR-3 staining (D) and positive area quantification (E) for WT and srrm3 MUT retinae at 72 hpf; n = 4. P values from unpaired t tests. (F and G) Phalloidin staining (F) and thickness analysis for different retinal layers (G) for WT and srrm3 MUT retinae. n = 4. P values from unpaired t tests.

Similar articles

Cited by

References

    1. Wert K. J., Lin J. H., Tsang S. H., General pathophysiology in retinal degeneration. Dev. Ophthalmol. 53, 33–43 (2014). - PMC - PubMed
    1. Hoon M., Okawa H., Della Santina L., Wong R. O. L., Functional architecture of the retina: Development and disease. Prog. Retin. Eye Res. 42, 44–84 (2014). - PMC - PubMed
    1. Campbell L. J., West M. C., Jensen A. M., A high content, small molecule screen identifies candidate molecular pathways that regulate rod photoreceptor outer segment renewal. Sci. Rep. 8, 14017 (2018). - PMC - PubMed
    1. Sánchez-Bellver L., Toulis V., Marfany G., On the wrong track: Alterations of ciliary transport in inherited retinal dystrophies. Front. Cell Dev. Biol. 9, 623734 (2021). - PMC - PubMed
    1. Waters A. M., Beales P. L., Ciliopathies: An expanding disease spectrum. Pediatr. Nephrol. 26, 1039–1056 (2011). - PMC - PubMed

Publication types