. 2022 Jul 19;119(29):e2123527119.
doi: 10.1073/pnas.2123527119. Epub 2022 Jul 11.

Gd2O3-mesoporous silica/gold nanoshells: A potential dual T1/ T2 contrast agent for MRI-guided localized near-IR photothermal therapy

Affiliations

Gd2O3-mesoporous silica/gold nanoshells: A potential dual T1/ T2 contrast agent for MRI-guided localized near-IR photothermal therapy

Yara Kadria-Vili et al. Proc Natl Acad Sci U S A. .

Abstract

A promising clinical trial utilizing gold-silica core-shell nanostructures coated with polyethylene glycol (PEG) has been reported for near-infrared (NIR) photothermal therapy (PTT) of prostate cancer. The next critical step for PTT is the visualization of therapeutically relevant nanoshell (NS) concentrations at the tumor site. Here we report the synthesis of PEGylated Gd2O3-mesoporous silica/gold core/shell NSs (Gd2O3-MS NSs) with NIR photothermal properties that also supply sufficient MRI contrast to be visualized at therapeutic doses (≥108 NSs per milliliter). The nanoparticles have r1 relaxivities more than three times larger than those of conventional T1 contrast agents, requiring less concentration of Gd3+ to observe an equivalent signal enhancement in T1-weighted MR images. Furthermore, Gd2O3-MS NS nanoparticles have r2 relaxivities comparable to those of existing T2 contrast agents, observed in agarose phantoms. This highly unusual combination of simultaneous T1 and T2 contrast allows for MRI enhancement through different approaches. As a rudimentary example, we demonstrate T1/T2 ratio MR images with sixfold contrast signal enhancement relative to its T1 MRI and induced temperature increases of 20 to 55 °C under clinical illumination conditions. These nanoparticles facilitate MRI-guided PTT while providing real-time temperature feedback through thermal MRI mapping.

Keywords: MRI contrast; gadolinium oxide; gold nanoshells; mesoporous silica; photothermal.


Conflict of interest statement

Competing interest statement: A patent is being filed on the nanoparticle whose synthesis and properties we report in this manuscript.

Figures

Fig. 1.
Fig. 1.
Synthesis and characterization of 2k-PEGylated Gd2O3-MS NSs. (A) A schematic representation of the steps involved in synthesizing 2k-PEGylated MRI active Gd2O3-MS NS. A 95 ± 16-nm diameter of MS silica particles was incubated with ∼2 nm Gd2O3 NPs and sealed with Au shell to form Gd2O3-MS NSs. The Gd2O3-MS NS nanoparticle was stabilized by adsorbing 2 kDa methoxy PEG molecules onto its surface through their thiol group. (B) TEM images corresponding to each step of the 2k-PEGylated Gd2O3-MS NS synthesis: (i and ii) cores of silica (i) before and (ii) after CTAC removal through 4 h of baking at 500 °C, (iii) Gd2O3-MS, (iv) Au-seeded Gd2O3-MS, and (v) 2k-PEGylated Gd2O3-MS NS. (Scale bar: 50 nm.) (C) (i) A high-resolution STEM image of a 2k-PEGylated Gd2O3-MS NS sample with STEM-HAADF imaging mode and its elemental mapping images correspond to (ii) Si, (iii) Gd, and (iv) Au atoms present in the sample. (Scale bar: 200 nm.) (D) Gold-shell thickness distributions of three samples of 2k-PEGylated Gd2O3-MS NSs determined by high resolution TEM image analysis. The distributions were fitted with a Gauss function utilizing OriginPro 2021b, giving an average shell thickness ± SE of (i) 22.3 ± 0.1 nm (305 NSs), (ii) 27.5 ± 0.1 nm (339 NSs), and (iii) 31.0 ± 0.2 nm (297 NSs). (E) Their corresponding extinction spectra in Milli-Q water with the same color code (blue, 22.3 nm; green, 27.5 nm; and red, 31.0 nm).
Fig. 2.
Fig. 2.
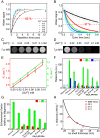
MRI characterization of 2k-PEGylated Gd2O3-MS NSs in Milli-Q water at 4.7 T, 20 °C. (A–D) Longitudinal magnetization recovery (T1), transverse magnetization decay (T2), and their T1w and T2w MR images, respectively, at various gadolinium concentrations of Gd2O3-MS NSs with a gold shell thickness of 22.3 ± 0.1 nm. Dots are experimental data ± SD and solid lines are the fit functions using Eq. 1. The data in A and B were obtained with a RARE spin–echo sequence that loops across a range of repetition time values and MSME spin–echo scanning, respectively. T1w MR imaging parameters: TR = 400 ms, TE = 9.9 ms, flip angle (FA) = 180°. T2w MR imaging parameters: TR = 1,750 ms, TE = 423 ms, FA = 180°. (E) The inverse of T1 (R1, open red circles) and the inverse of T2 (R2, open green triangle) relaxivity rate constants at various gadolinium concentrations gave slope values of r1 = 15.8 ± 0.6 mMGd−1·s−1 and r2 = 120 ± 5 mMGd−1·s−1 (mean ± SE), respectively, for Gd2O3-MS NSs (22.3 ± 0.1 nm Au). (F) r1 (red) and r2 (green) relaxivity rates, and their r2/r1 ratio (blue) for an aqueous suspension of 2k-PEGylated Gd2O3 as synthesized (15.8 ± 0.7 mMGd−1·s−1, 30.6 ± 0.3 mMGd−1·s−1, 1.94 ± 0.09), Au-seeded Gd2O3-MS (19 ± 1 mMGd−1·s−1, 132 ± 6 mMGd−1·s−1, 6.9 ± 0.5), and Gd2O3-MS NSs with gold shell thicknesses of 22.3 ± 0.1 nm (15.8 ± 0.6 mMGd−1·s−1, 120 ± 5 mMGd−1·s−1, 7.6 ± 0.4), 27.5 ± 0.1 nm (8.3 ± 0.2 mMGd−1·s−1, 66 ± 3 mMGd−1·s−1, 8.0 ± 0.4), and 31.0 ± 0.2 nm (3.6 ± 0.1 mMGd−1·s−1, 41 ± 3 mMGd−1·s−1, 11.4 ± 0.9) in comparison with a T1 contrast agent (Magnevist: 4.7 ± 0.1 mMGd−1·s−1, 5.34 ± 0.04 mMGd−1·s−1, 1.14 ± 0.03) and T2 contrast agents (Resovist, 2.8 ± 0.1 mMGd−1·s−1, 176 ± 9 mMGd−1·s−1, 63 ± 4; Ferumoxide, 2.3 ± 0.1 mMGd−1·s−1, 105 ± 5 mMGd−1·s−1, 46 ± 3). The blue dashed line is r2/r1 ratio = 10. Results show that Gd2O3, Au-seeded Gd2O3, and Gd2O3-MS NSs (Au shell thickness: 22.3 ± 0.1 nm and 27.5 ± 0.1 nm) have statistically higher r1 relaxivity values than Magnevist (*P < 0.001 vs. Magnevist by ANOVA with Tukey’s honestly significant difference post hoc test). (G) Enhancement factors r1 (red) and r2 (green) relative to Magnevist. Relaxivity values Resovist and Ferumoxide were taken from reference (41). (H) r1 relaxivity values versus gold shell thickness. The SBM theoretical data (black solid line) with 3.3 × 10⁶ Gd3+ per Gd2O3-MS NS is in good agreement with the experimental data (red symbols), r2 = 0.74. Error bars are represented in E–H as ± SE.
Fig. 3.
Fig. 3.
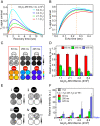
MR imaging processing of T1w/T2w intensity ratio with 2k-PEGylated Gd2O3-MS NSs (27.5 ± 0.1 nm gold shell) in 0.48% agarose phantoms performed under 4.7 T magnetic strength. (A and B) T1 and T2 signal contrast for agarose phantoms consisting of 1.1 × 10⁹ (C4, red), 2.1 × 10⁹ (C3, green), 4.2 × 10⁹ (C2, blue), and 8.4 × 10⁹ (C1, cyan) Gd2O3-MS NSs per milliliter. The profiles were obtained by subtracting the fitted longitudinal recovery and the fitted transverse decay, respectively, for each Gd2O3-MS NS dilution from Milli-Q water. Orange dashed lines indicate the repetition time (TR = 1,580 ms) and the echo time (TE = 250 ms) at which the optimum T1 and T2 signal contrast, respectively, can be achieved. (C and D) T2w MR images (Upper, gray scale; Lower, color scale) and their corresponding signal intensities at echo times = 83 ms (red), 250 ms (green), and 425 ms (purple) for various concentrations of 2k-PEGylated Gd2O3-MS NSs relative to that for Milli-Q water. (E) MR images acquired with TE = 9.9 ms and TR = 1,580 ms (i) and images of the processed T1w/T2w intensity ratio with T2w MRI at TR = 3,857 ms and TE = 83 ms (ii), 250 ms (iii), and 425 ms (iv) for 2k-PEGylated Gd2O3-MS NSs at various concentrations. (F) Their corresponding MRI signal intensities relative to water signal (= 1). The values and the error bars are the mean ± SD. The data for T1w MR images and T2w MR images were obtained utilizing RARE sequence (TR = 1,580 ms, TE = 9.9 ms, flip angle = 180°) and MSME (TR = 3,857 ms; TE = 83 ms, 250 ms, or 425 ms; and flip angle = 180°), respectively.
Fig. 4.
Fig. 4.
Experimental setup for 2k-PEGylated Gd2O3-MS NSs-assisted MRI-guided PTT. (A, Lower) A schematic representation of the MRI-guided photothermal illumination setup showing the sample placed in the active field of the 72-mm ID MRI coil and water sample as the reference. The samples were illuminated with a CW-GaAlAs Laser diode (810 ± 20 nm) coupled with Visualase laser diffusing fiber. (A, Upper) Set of snapshot images of (i) a diffusing tip illumination profile of the 635 to 655 nm aiming beam illumination and (ii) a superimposed image of the sample with a cartoon image of the diffuser tip illustrating the way it was set up during the thermal MRI measurements. (B, Lower) Coronal T1w MR image obtained before PTT with a fast-spoiled gradient-echo (fSPGR) sequence, TR = 275 ms, TE = 5.1 ms, number of averages = 2, FA = 90°, FOV = 35 mm, and matrix size = 256 × 256. (B, Upper) Axial T1w MR images at the (i) 2k-PEGylated Gd2O3-MS NSs location (slice 2), consisting of 1.1 × 10⁹ (C4), 2.1 × 10⁹ (C3), 4.2 × 10⁹ (C2), and 8.4 × 10⁹ (C1) Gd2O3-MS NSs per milliliter and (ii) NS-free agarose (slice 4) were taken during PTT with a FLASH sequence. TR = 577 ms, TE = 6 ms, number of averages = 1, FA = 35°, FOV = 35 mm, matrix size = 128 × 128, slice thickness = 1.5 mm, and spacing between slices = 1.75 mm (scale bar = 2.6 mm).
Fig. 5.
Fig. 5.
Temperature change measurements with thermal MRI method at 4.7 T of various concentrations of 2k-PEGylated Gd2O3-MS NSs (27.5-nm gold shell) in 0.48% agarose phantoms under 3 min of 810-nm illumination at 4 W/1 W. (A) Maximum temperature changes across the four NMR tubes at the 2k-PEGylated Gd2O3-MS NS locations (slice 2 in Fig. 4B, XY plane), consisting of 1.1 × 10⁹ (C4), 2.1 × 10⁹ (C3), 4.2 × 10⁹ (C2), and 8.4 × 10⁹ (C1) Gd2O3-MS NSs per milliliter. The thermal MRI mapping was obtained using a MATLAB code by processing the last T1w MRI collected before the laser illumination was turned OFF. (B) Temperature change profile during the treatment of three areas of interest: 2k-PEGylated Gd2O3-MS NSs with 8.4 × 10⁹ NSs per milliliter (red, slice 2), ∼2 mm below the 2k-PEGylated Gd2O3-MS NSs where the agarose medium was NS-free (green, slice 4), and the controlled measurements–Milli-Q water (black, slice 2). Each data point at time x represents the maximum temperature change calculated based on the phase change in T1w MR image collected at time x relative to the first T1w MR image. A two-dimensional fast-low-angle-shot (FLASH) gradient-echo scanning sequence was used to acquire time series of 14 T1w images, 1 min and 13 s per scan. Solid lines are a guide to the eye. The red shaded area represents the illumination phase; its left side is the baseline phase, and its right side is the recovery phase. (C and D) Maximum temperature changes reached at the 2k-PEGylated Gd2O3-MS NS locations with various concentrations and NP-free agarose (∼2 mm below the 2k-PEGylated Gd2O3-MS NSs band) after 3 min of NIR illumination at 4- and 1-W laser powers, respectively (***P < 0.0001, **P < 0.001, *P < 0.05 utilizing ANOVA with Tukey’s honestly significant difference post hoc test). Error bars represent ± SE.

References

    1. Rastinehad A. R., et al. , Gold nanoshell-localized photothermal ablation of prostate tumors in a clinical pilot device study. Proc. Natl. Acad. Sci. U.S.A. 116, 18590–18596 (2019). - PMC - PubMed
    1. Jain N. K., et al. , Nanoengineered photoactive theranostic agents for cancer. Nanophotonics 10, 2973–2997 (2021).
    1. Weissleder R., A clearer vision for in vivo imaging. Nat. Biotechnol. 19, 316–317 (2001). - PubMed
    1. Smith A. M., Mancini M. C., Nie S., Bioimaging: Second window for in vivo imaging. Nat. Nanotechnol. 4, 710–711 (2009). - PMC - PubMed
    1. Hudson D. E., Hudson D. O., Wininger J. M., Richardson B. D., Penetration of laser light at 808 and 980 nm in bovine tissue samples. Photomed. Laser Surg. 31, 163–168 (2013). - PMC - PubMed

Publication types

MeSH terms